You are not logged in.
This means you
CAN ONLY VIEW reports that were published prior to Sunday, March 23, 2025.
You
MUST UPGRADE YOUR MEMBERSHIP if you want to see any current reports.
AFTER MARKET UPDATE - WEDNESDAY, JULY 10TH, 2024
Previous After Market Report Next After Market Report >>>
|
|
|
|
DOW |
+429.39 |
39,721.36 |
+1.09% |
|
Volume |
807,984,114 |
+1% |
|
Volume |
5,285,243,600 |
+6% |
|
NASDAQ |
+218.16 |
18,647.45 |
+1.18% |
|
Advancers |
2,073 |
75% |
|
Advancers |
2,692 |
64% |
|
S&P 500 |
+56.93 |
5,633.91 |
+1.02% |
|
Decliners |
696 |
25% |
|
Decliners |
1,526 |
36% |
|
Russell 2000 |
+22.28 |
2,051.75 |
+1.10% |
|
52 Wk Highs |
130 |
|
|
52 Wk Highs |
178 |
|
|
S&P 600 |
+14.23 |
1,295.47 |
+1.11% |
|
52 Wk Lows |
51 |
|
|
52 Wk Lows |
143 |
|
|
 |
Breadth Positive as Major Indices Posted Solid Gains
Kenneth J. Gruneisen - Passed the CAN SLIM® Master's Exam
The major indices all jumped more than +1.0% and the S&P 500 closed above 5,600 for the first time. Volume was higher than the prior session totals on the NYSE and on the Nasdaq exchange. Breadth was clearly positive as advancers led decliners by a 3-1 margin on the NYSE and by a 5-3 margin on the Nasdaq exchange. There were 55 high-ranked companies from the Leaders List that hit new 52-week highs and were listed on the BreakOuts Page, versus the total of 43 on the prior session. New 52-week highs outnumbered new 52-week lows on the NYSE and on the Nasdaq exchange. The major indices are in a confirmed uptrend (M criteria) that recently endured some pressure. Remember that any uptrend requires healthy leadership.
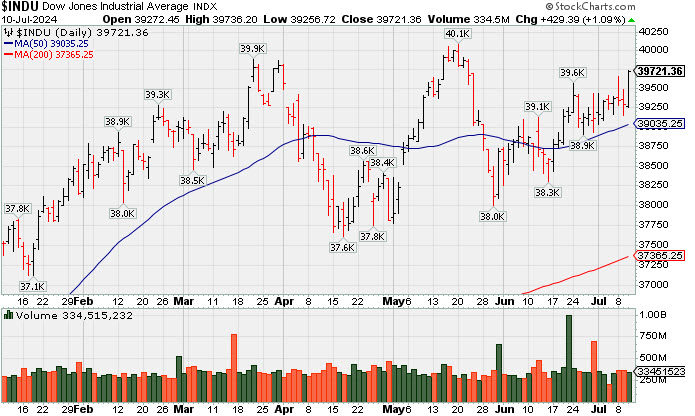 PICTURED: The Dow Jones Industrial Average posted a gain on Wednesday while consolidating above its 50-day moving average (DMA) line. It is perched -0.9% off its all-time high.
With the June Consumer Price Index data due tomorrow and the start of earnings season on Friday, mega cap and semiconductor-related names boosted the broader market on Wednesday's session. NVIDIA (NVDA +2.7%), Apple (AAPL +1.8%), Microsoft (MSFT +1.5%), and Alphabet (GOOG +1.2%) each rose. Bank stocks also outperformed the broader market. The SPDR S&P Bank ETF (KBE) rose +2.0% and the SPDR Regional Banking ETF (KRE) closed with a +2.2% gain.
All 11 S&P 500 sectors closed higher. The heavily-weighted information technology sector (+1.6%) led the market as the financial sector (+0.4%) posted releatively smaller gains. The 10-yr note yield dropped two basis points to 4.28% and the 2-yr note yield settled unchanged at 4.63%. There was strong demand for the latest $39 billion 10-yr note sale.
|
 Kenneth J. Gruneisen started out as a licensed stockbroker in August 1987, a couple of months prior to the historic stock market crash that took the Dow Jones Industrial Average down -22.6% in a single day. He has published daily fact-based fundamental and technical analysis on high-ranked stocks online for two decades. Through FACTBASEDINVESTING.COM, Kenneth provides educational articles, news, market commentary, and other information regarding proven investment systems that work in good times and bad.
Comments contained in the body of this report are technical opinions only and are not necessarily those of Gruneisen Growth Corp. The material herein has been obtained from sources believed to be reliable and accurate, however, its accuracy and completeness cannot be guaranteed. Our firm, employees, and customers may effect transactions, including transactions contrary to any recommendation herein, or have positions in the securities mentioned herein or options with respect thereto. Any recommendation contained in this report may not be suitable for all investors and it is not to be deemed an offer or solicitation on our part with respect to the purchase or sale of any securities. |
|
 |
Retail, Financial, Tech, and Commodity-Linked Groups Rose
Kenneth J. Gruneisen - Passed the CAN SLIM® Master's Exam
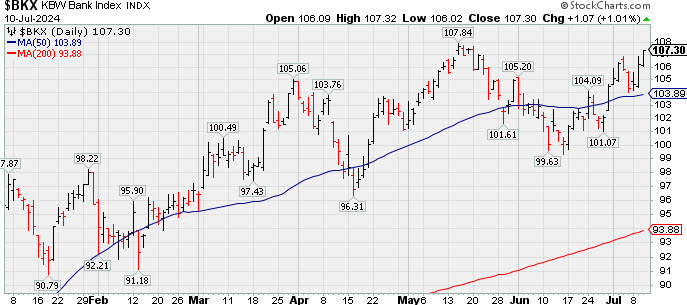
The Bank Index ($BKX +1.01%) and the Broker/Dealer Index ($XBD +1.29%) both posted solid gains while the Retail Index ($RLX +0.65%) posted a smaller gain on Wednesday. The Semiconductor Index ($SOX +2.42%) outpaced the Biotech Index ($BTK +1.17%) while the Networking Index ($NWX +0.69%) also edged higher. The Gold & Silver Index ($XAU +2.76%) outpaced the Integrated Oil Index ($XOI +0.50%) and the Oil Services Index ($OSX +0.99%).
PICTURED: The Bank Index ($BKX +1.01%) has been rising above its 50-day moving average (DMA) line toward its 2024 high.
| Oil Services |
$OSX |
84.19 |
+0.82 |
+0.99% |
+0.37% |
| Integrated Oil |
$XOI |
2,004.57 |
+10.06 |
+0.50% |
+7.63% |
| Semiconductor |
$SOX |
5,904.54 |
+139.34 |
+2.42% |
+41.41% |
| Networking |
$NWX |
843.49 |
+5.78 |
+0.69% |
+1.28% |
| Broker/Dealer |
$XBD |
646.70 |
+8.22 |
+1.29% |
+16.04% |
| Retail |
$RLX |
4,680.63 |
+30.23 |
+0.65% |
+20.36% |
| Gold & Silver |
$XAU |
149.32 |
+4.01 |
+2.76% |
+18.80% |
| Bank |
$BKX |
107.30 |
+1.07 |
+1.01% |
+11.75% |
| Biotech |
$BTK |
5,384.81 |
+62.18 |
+1.17% |
-0.63% |
|
|
|
 |
Lingering Below 50-Day Moving Average But Only -7% Off High
Kenneth J. Gruneisen - Passed the CAN SLIM® Master's Exam
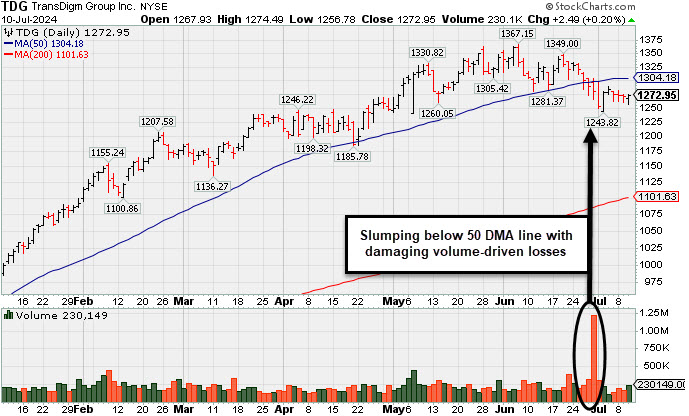
Transdigm Group Inc (TDG +$2.22 or +0.17% to $1,272.68) is still lingering below its 50-day moving average (DMA) line ($1,304) yet perched only -7.1% off its all-time high. Only a prompt rebound above the 50 DMA line would help its outlook improve. Fundamentals remain strong.
TDG was last shown in this FSU section on 6/12/24 with an annotated graph under the headline, "Transdigm Consolidating Above 50-Day Moving Average". TDG reported Mar '24 quarterly earnings +34% on +21% sales revenues versus the year-ago period, its 12th consecutive comparison above the +25% minimum earnings guideline (C criteria). Growth has been very strong after a downturn in FY '20 and '21 (A criteria) hurt its earnings track record. It has a 92 Earnings Per Share Rating.
The number of top-rated funds owning its shares rose from 1,332 in Dec '22 to 1,602 in Jun '24, a reassuring trend concerning the I criteria. Its small supply of 53.7 million shares (S criteria) in the public float can contribute to greater price volatility in the event of institutional buying or selling. It has a Timeliness Rating of A and an Accumulation/Distribution rating of E. |
|
|
Color Codes Explained :
Y - Better candidates highlighted by our
staff of experts.
G - Previously featured
in past reports as yellow but may no longer be buyable under the
guidelines.
***Last / Change / Volume data in this table is the closing quote data***
Symbol/Exchange
Company Name
Industry Group |
PRICE |
CHANGE
(%Change) |
Day High |
Volume
(% DAV)
(% 50 day avg vol) |
52 Wk Hi
% From Hi |
Featured
Date |
Price
Featured |
Pivot Featured |
|
Max Buy |
 TDG
-
NYSE
TDG
-
NYSE
TransDigm Group
Aerospace/Defense
|
$1,273.00
|
+2.54
0.20% |
$1,274.49
|
136,378
56.59% of 50 DAV
50 DAV is 241,000
|
$1,369.58
-7.05%
|
4/12/2024
|
$1,224.21
|
PP = $1,246.32
|
|
MB = $1,308.64
|
Most Recent Note - 7/8/2024 5:36:46 PM
G - Still lingering below its 50 DMA line ($1,303.65). Only a prompt rebound above the 50 DMA line would help its outlook improve. Fundamentals remain strong.
>>> FEATURED STOCK ARTICLE : Transdigm Consolidating Above 50-Day Moving Average - 6/12/2024 |
View all notes |
Set NEW NOTE alert |
Company Profile |
SEC
News |
Chart |
Request a new note
C
A
S
I |
USLM
-
NASDAQ
U.S. Lime & Minerals
Bldg-Cement/Concrt/Ag
|
$360.54
|
+4.35
1.22% |
$360.54
|
3,143
13.67% of 50 DAV
50 DAV is 23,000
|
$378.78
-4.82%
|
6/18/2024
|
$356.30
|
PP = $378.88
|
|
MB = $397.82
|
Most Recent Note - 7/8/2024 5:37:51 PM
Y - Still perched within close striking distance of all-time high. Color code was changed to yellow with new pivot point cited based on its 5/15/24 high plus 10 cents. Subsequent gains above the pivot point backed by at least +40% above average volume may trigger a new (or add-on) technical buy signal. Found prompt support after briefly undercutting its 50 DMA line ($348) in recent weeks. Fundamentals remain strong.
>>> FEATURED STOCK ARTICLE : in Striking Distance of All-Time High After Volume-Driven Gains - 6/28/2024 |
View all notes |
Set NEW NOTE alert |
Company Profile |
SEC
News |
Chart |
Request a new note
C
A
S
I |
CLS
-
NYSE
Celestica
Elec-Contract Mfg
|
$61.86
|
+2.60
4.39% |
$62.09
|
1,126,122
51.87% of 50 DAV
50 DAV is 2,171,000
|
$61.06
1.31%
|
7/6/2024
|
$57.62
|
PP = $61.16
|
|
MB = $64.22
|
 Most Recent Note - 7/10/2024 2:22:15 PM
Y - Hitting a new all-time high with today's 3rd consecutive gain. A gain backed by at least +40% above average volume and a close above the new pivot point cited based on its 5/28/24 high plus 10 cents may trigger a proper technical buy signal. Important support is at prior highs in the $51 area and its 50 DMA line.
>>> FEATURED STOCK ARTICLE : Consolidating Above Prior Highs in an Orderly Fashion - 6/27/2024 |
View all notes |
Set NEW NOTE alert |
Company Profile |
SEC
News |
Chart |
Request a new note
C
A
S
I |
DECK
-
NYSE
Deckers Outdoor
Apparel-Shoes and Rel Mfg
|
$887.54
|
-51.51
-5.49% |
$927.50
|
458,891
137.81% of 50 DAV
50 DAV is 333,000
|
$1,106.89
-19.82%
|
5/24/2024
|
$1,010.60
|
PP = $956.27
|
|
MB = $1,004.08
|
Most Recent Note - 7/10/2024 2:20:29 PM
Gapped down today undercutting the prior low and raising more serious concerns while suffering a big loss with above-average volume. It will be dropped from the Featured Stocks list tonight. A rebound above its 50 DMA line ($956) is needed for its outlook to improve.
>>> FEATURED STOCK ARTICLE : Deckers Consolidating Near High - 6/13/2024 |
View all notes |
Set NEW NOTE alert |
Company Profile |
SEC
News |
Chart |
Request a new note
C
A
S
I |
ELF
-
NYSE
e.l.f. Beauty
Cosmetics/Personal Care
|
$200.32
|
-6.11
-2.96% |
$211.20
|
775,852
50.09% of 50 DAV
50 DAV is 1,549,000
|
$221.83
-9.70%
|
6/18/2024
|
$212.40
|
PP = $221.93
|
|
MB = $233.03
|
Most Recent Note - 7/10/2024 2:23:20 PM
Y - Pulling back today with below-average volume. Color code was changed to yellow with new pivot point cited based on its 3/04/24 high plus 10 cents. Subsequent gains above the pivot point backed by at least +40% above average volume may trigger a new (or add-on) technical buy signal. Its 50 DMA line ($184.51) defines important near-term support to watch.
>>> FEATURED STOCK ARTICLE : Perched Within Striking Distance of All-Time High - 6/20/2024 |
View all notes |
Set NEW NOTE alert |
Company Profile |
SEC
News |
Chart |
Request a new note
C
A
S
I |
Symbol/Exchange
Company Name
Industry Group |
PRICE |
CHANGE
(%Change) |
Day High |
Volume
(% DAV)
(% 50 day avg vol) |
52 Wk Hi
% From Hi |
Featured
Date |
Price
Featured |
Pivot Featured |
|
Max Buy |
PDD
-
NASDAQ
PDD Holdings ADR
Retail-Internet
|
$137.86
|
+0.14
0.10% |
$139.61
|
2,647,971
28.49% of 50 DAV
50 DAV is 9,294,000
|
$164.69
-16.29%
|
5/24/2024
|
$161.85
|
PP = $153.09
|
|
MB = $160.74
|
Most Recent Note - 7/9/2024 10:44:35 PM
G - Posted a small gain today with light volume, still lingering below its 50 DMA line ($141.65). A rebound above the 50 DMA line is needed for its outlook to improve. Its 200 DMA line ($128) defines important near-term support.
>>> FEATURED STOCK ARTICLE : Still Sputtering Below Pivot Point After Negating Breakout - 6/17/2024 |
View all notes |
Set NEW NOTE alert |
Company Profile |
SEC
News |
Chart |
Request a new note
C
A
S
I |
CRWD
-
NASDAQ
CrowdStrike Holdings
Computer Sftwr-Security
|
$372.27
|
-13.61
-3.53% |
$385.02
|
4,447,342
88.36% of 50 DAV
50 DAV is 5,033,000
|
$398.33
-6.54%
|
5/28/2024
|
$351.47
|
PP = $365.10
|
|
MB = $383.36
|
Most Recent Note - 7/9/2024 10:42:15 PM
G - Color code is changed to green after it touched a new high today above its "max buy" level but reversed into the red. Prior highs in the $358-365 area define initial support to watch above its 50 DMA line ($350). Fundamentals remain strong.
>>> FEATURED STOCK ARTICLE : Encountered Distributional Pressure Hovering Near All-Time High - 6/21/2024 |
View all notes |
Set NEW NOTE alert |
Company Profile |
SEC
News |
Chart |
Request a new note
C
A
S
I |
NVO
-
NYSE
Novo Nordisk ADR
Medical-Ethical Drugs
|
$142.46
|
+2.03
1.44% |
$142.53
|
2,157,169
55.35% of 50 DAV
50 DAV is 3,897,000
|
$148.15
-3.84%
|
6/7/2024
|
$143.06
|
PP = $138.38
|
|
MB = $145.30
|
Most Recent Note - 7/9/2024 12:05:20 PM
Y - Consolidating above prior highs in the $138 area which define initial support to watch above its 50 DMA line ($136.40). Fundamentals remain strong.
>>> FEATURED STOCK ARTICLE : Perched Near All-Time High Following Recent Gap Up With Volume - 7/1/2024 |
View all notes |
Set NEW NOTE alert |
Company Profile |
SEC
News |
Chart |
Request a new note
C
A
S
I |
GVA
-
NYSE
Granite Construction
Bldg-Heavy Construction
|
$60.24
|
+1.31
2.22% |
$60.25
|
509,204
94.30% of 50 DAV
50 DAV is 540,000
|
$65.08
-7.44%
|
6/11/2024
|
$59.76
|
PP = $64.33
|
|
MB = $67.55
|
Most Recent Note - 7/9/2024 11:57:58 AM
G - Slumping below its 50 DMA line ($60.92) raising concerns and triggering a technical sell signal and its color code is changed to green. Only a prompt rebound above the 50 DMA line would help its outlook improve.
>>> FEATURED STOCK ARTICLE : Granite Testing Support at 50-Day Moving Average - 7/2/2024 |
View all notes |
Set NEW NOTE alert |
Company Profile |
SEC
News |
Chart |
Request a new note
C
A
S
I |
DDOG
-
NASDAQ
Datadog Inc
Computer Sftwr-Enterprse
|
$126.19
|
-0.45
-0.35% |
$128.14
|
1,755,301
41.47% of 50 DAV
50 DAV is 4,232,500
|
$138.61
-8.96%
|
7/9/2024
|
$126.92
|
PP = $138.71
|
|
MB = $145.65
|
Most Recent Note - 7/9/2024 10:43:37 PM
Y - Suffered a loss today with above average volume, finishing weak after highlighted in yellow in the earlier mid-day report with pivot point cited based on its 2/13/24 high plus 10 cents. Consolidating above its 50 DMA line and perched within striking distance of its 52-week high. Reported Mar '24 quarterly earnings +91% on +27% sales revenues versus the year-ago period its 4th consecutive quarterly comparison well above the +25% minimum earnings guideline (C criteria). Its annual earnings (A criteria) history has been strong since completing its $27 IPO on 9/19/19. See the latest FSU analysis for more details and a new annotated graph.
>>> FEATURED STOCK ARTICLE : Consolidating Within Close Range of 52-Week High - 7/9/2024 |
View all notes |
Set NEW NOTE alert |
Company Profile |
SEC
News |
Chart |
Request a new note
C
A
S
I |
Symbol/Exchange
Company Name
Industry Group |
PRICE |
CHANGE
(%Change) |
Day High |
Volume
(% DAV)
(% 50 day avg vol) |
52 Wk Hi
% From Hi |
Featured
Date |
Price
Featured |
Pivot Featured |
|
Max Buy |
|
|
|
THESE ARE NOT BUY RECOMMENDATIONS!
Comments contained in the body of this report are technical
opinions only. The material herein has been obtained
from sources believed to be reliable and accurate, however,
its accuracy and completeness cannot be guaranteed.
This site is not an investment advisor, hence it does
not endorse or recommend any securities or other investments.
Any recommendation contained in this report may not
be suitable for all investors and it is not to be deemed
an offer or solicitation on our part with respect to
the purchase or sale of any securities. All trademarks,
service marks and trade names appearing in this report
are the property of their respective owners, and are
likewise used for identification purposes only.
This report is a service available
only to active Paid Premium Members.
You may opt-out of receiving report notifications
at any time. Questions or comments may be submitted
by writing to Premium Membership Services 665 S.E. 10 Street, Suite 201 Deerfield Beach, FL 33441-5634 or by calling 1-800-965-8307
or 954-785-1121.
|
|
|