There are no featured stock write-ups on QLYS proir to 1/4/2025
 Upgrade your membership to see all of the expert analysis we have published on QLYS now!
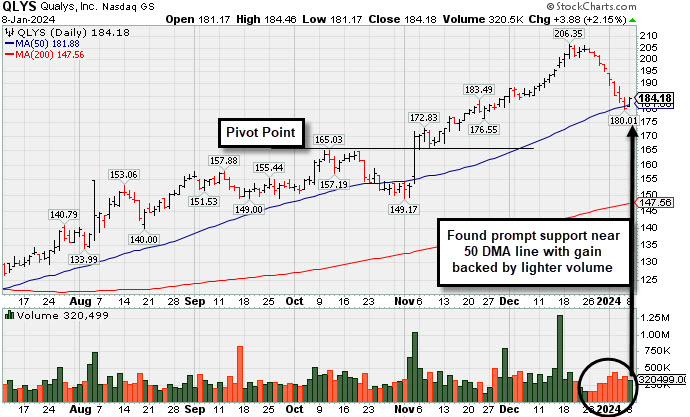
Posted Light Volume Gain Finding Support at 50-Day Moving Average - Monday, January 8, 2024
Qualys Inc (QLYS +$3.88 or +2.15% to $184.18) posted a gain today with lighter than average volume, finding prompt support near its 50-day moving average (DMA) line ($181.88). The prior session low ($180.01) defines important near-term support to watch where more damaging losses would raise greater concerns.
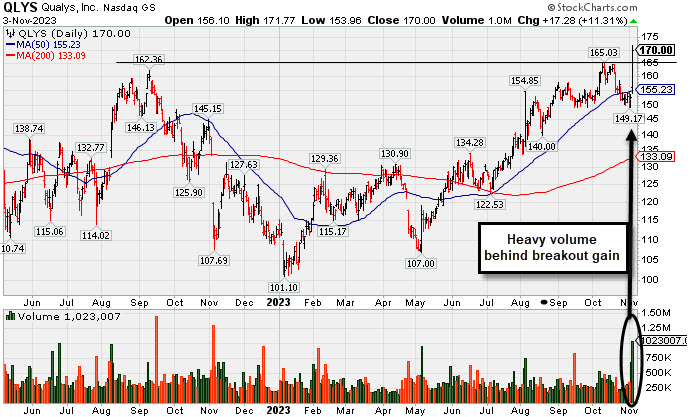
QLYS finished strong after highlighted in yellow in the 11/03/23 mid-day report (read here) with pivot point cited based on its 10/11/23 high after a cup-with-handle base. The gap up and considerable gain had it hitting new 52-week and all-time highs triggering a technical buy signal. QLYS was last shown in this FSU section on 12/12/23 with an annotated graph under the headline, "Extended From Base Following Big Breakout".
QLYS reported Sep '23 quarterly earnings +61% on +13% sales revenues versus the year ago period, its 2nd strong quarterly comparison well above the +25% minimum earnings guideline (C criteria). It has a 99 Earnings Per Share Rating. Its annual earnings history (A criteria) has also been very strong and steady. The Computer Software - Security group is currently ranked 11th on the 197 Industry Groups list, and leadership (L criteria) in the industry group is another favorable factor with respect to the fact-based investment system.
QLYS has a Relative Strength Rating of 92, well above the 80+ minimum guideline for buy candidates. Currently it has a Timeliness Rating of A but a Sponsorship Rating of D. Its Accumulation/Distribution rating is C+ while its Up/Down Volume Ratio of 2.1 is an unbiased indication its shares have been under accumulation over the past 50 days. The number of top-rated funds owning its shares rose from 294 in Jun '17 to 744 in Sep '23, a reassuring sign concerning the I criteria. Its small supply of only 36 million shares (S criteria) in the public float can contribute to greater volatility in the event of institutional buying or selling.
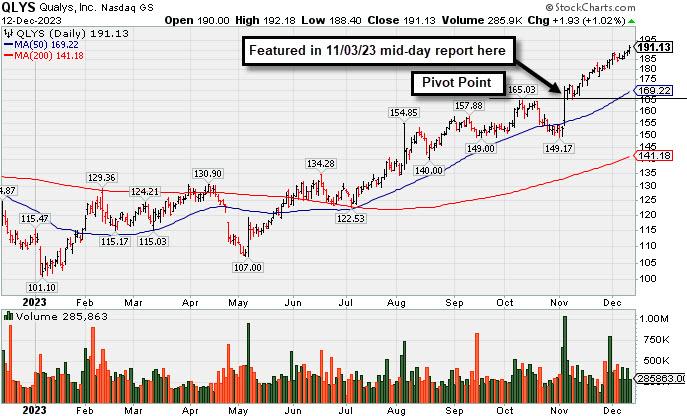
Extended From Base Following Big Breakout - Tuesday, December 12, 2023
Qualys Inc (QLYS +$1.93 or +1.02% to $191.13) posted a 5th consecutive gain with light volume as it hit another new all-time high. Its 50-day moving average (DMA) line defines initial support to watch on pullbacks above the prior high ($165). It is on track for its 7th straight weekly gain since last shown in this FSU section with an annotated graph under the headline, "Powerful Breakout for Qualys".
QLYS finished strong after highlighted in yellow in the 11/03/23 mid-day report (read here) with pivot point cited based on its 10/11/23 high after a cup-with-handle base. The gap up and considerable gain had it hitting new 52-week and all-time highs triggering a technical buy signal. Reported Sep '23 quarterly earnings +61% on +13% sales revenues versus the year ago period, its 2nd strong quarterly comparison well above the +25% minimum earnings guideline (C criteria). Made choppy progress and fundamentals remained reasonably strong since dropped from the Featured Stocks list on 6/15/20.
It has a 99 Earnings Per Share Rating. Its annual earnings history (A criteria) has also been very strong an steady. The Computer Software - Security group is currently ranked 15th on the 197 Industry Groups list, and leadership (L criteria) in the industry group is another favorable factor with respect to the fact-based investment system.
QLYS has a Relative Strength Rating of 95, well above the 80+ minimum guideline for buy candidates. Currently it has a Timeliness Rating of A but a Sponsorship Rating of D. Its Accumulation/Distribution rating is B+ while its Up/Down Volume Ratio of 2.5 is an unbiased indication its shares have been under accumulation over the past 50 days. The number of top-rated funds owning its shares rose from 294 in Jun '17 to 721 in Sep '23, a reassuring sign concerning the I criteria. Its small supply of only 36 million shares (S criteria) in the public float can contribute to greater volatility in the event of institutional buying or selling.
Powerful Breakout for Qualys - Friday, November 3, 2023
Qualys Inc (QLYS +$17.28 or +11.31% to $170.00) finished strong after highlighted to yellow with pivot point cited based on its 10/11/23 high after a cup-with-handle base. Today's gap up and considerable gain had it hitting new 52-week and all-time highs triggering a technical buy signal. Reported Sep '23 quarterly earnings +61% on +13% sales revenues versus the year ago period, its 2nd strong quarterly comparison well above the +25% minimum earnings guideline (C criteria). Made choppy progress and fundamentals remained reasonably strong since dropped from the Featured Stocks list on 6/15/20.
It has a 99 Earnings Per Share Rating. Its annual earnings history (A criteria) has also been very strong an steady. The Computer Software - Security group is currently ranked 15th on the 197 Industry Groups list, and leadership (L criteria) in the industry group is another favorable factor with respect to the fact-based investment system.
QLYS has a Relative Strength Rating of 94, well above the 80+ minimum guideline for buy candidates. Currently it has a Timeliness Rating of A and Sponsorship Rating of D. Its Accumulation/Distribution rating is B- while its Up/Down Volume Ratio of 1.4 is an unbiased indication its shares have been under accumulation over the past 50 days. The number of top-rated funds owning its shares rose from 294 in Jun '17 to 725 in Sep '23, a reassuring sign concerning the I criteria. Its small supply of only 36 million shares (S criteria) in the public float can contribute to greater volatility in the event of institutional buying or selling.
Symbol/Exchange
Company Name
Industry Group | PRICE | CHANGE
(%Change) | Day High | Volume
(% DAV)
(% 50 day avg vol) | 52 Wk Hi
% From Hi | Featured
Date | Price
Featured | Pivot Featured |
| Max Buy |
 PLUS - NASDAQ PLUS - NASDAQ
ePlus
Computer-Tech Services | $65.01 | +1.30
2.04% | $65.43 | 77,180
71.46% of 50 DAV
50 DAV is 108,000 | $75.90
-14.35%
| 8/8/2023 | $67.60 | PP = $62.92 |
| MB = $66.07 |
 Most Recent Note - 11/3/2023 4:47:26 PM Most Recent Note - 11/3/2023 4:47:26 PM
Y - Color code is changed to yellow after rebounding above its 50 DMA line ($64.24) with today''s 5th consecutive gain helping its outlook to improve.
>>> FEATURED STOCK ARTICLE : Orderly Consolidation Continues for ePlus - 9/28/2023 | View all notes | Set NEW NOTE alert | Company Profile | SEC News | Chart | Request a new note C A S I |
ANET - NYSE
Arista Networks
Computer-Networking | $212.49 | +0.81
0.38% | $213.66 | 2,140,148
99.04% of 50 DAV
50 DAV is 2,161,000 | $214.26
-0.83%
| 10/31/2023 | $188.84 | PP = $198.80 |
| MB = $208.74 |
Most Recent Note - 11/3/2023 4:43:52 PM
G - Color code is changed to green after rising above its "max buy" level with today''s 4th consecutive gain. Bullish action came after it reported Sep ''23 quarterly earnings +46% on +28% sales revenues versus the year-ago period. Prior highs in the $198 area define near-term support above its 50 DMA line ($189.39).
>>> FEATURED STOCK ARTICLE : Powerful Gain Following Earnings Report for Arista Networks - 10/31/2023 | View all notes | Set NEW NOTE alert | Company Profile | SEC News | Chart | Request a new note C A S I |
NVO - NYSE
Novo Nordisk ADR
Medical-Ethical Drugs | $98.17 | -2.76
-2.73% | $98.84 | 4,412,877
96.41% of 50 DAV
50 DAV is 4,577,000 | $104.00
-5.61%
| 11/2/2023 | $100.97 | PP = $104.10 |
| MB = $109.31 |
Most Recent Note - 11/3/2023 4:45:53 PM
Y - Gapped down today for a loss with lighter volume. Subsequent gains for new highs backed by at least +40% above average volume are needed to trigger a technical buy signal. This Denmark-based Medical - Ethical Drugs firm found support after briefly undercutting its 50 DMA line in recent weeks. Shares split 2-1 on 9/20/23. Reported Sep '23 quarterly earnings +69% on +39% sales revenues versus the year-ago period, its 3rd strong quarter, well above the +25% minimum earnings guideline (C criteria). Annual earnings growth has been slow and steady.
>>> FEATURED STOCK ARTICLE : Approaching Prior High With Strong Fundamentals - 11/2/2023 | View all notes | Set NEW NOTE alert | Company Profile | SEC News | Chart | Request a new note C A S I |
QLYS - NASDAQ
Qualys
Computer Sftwr-Security | $170.00 | +17.28
11.31% | $171.77 | 1,032,064
327.64% of 50 DAV
50 DAV is 315,000 | $165.03
3.01%
| 11/3/2023 | $167.50 | PP = $165.03 |
| MB = $173.28 |
Most Recent Note - 11/3/2023 4:49:09 PM
Y - Finished strong after highlighted in yellow in the earlier mid-day report with pivot point cited based on its 10/11/23 high after a cup-with-handle base. Today's gap up and considerable gain hit new 52-week and all-time highs triggering a technical buy signal. Reported Sep '23 quarterly earnings +61% on +13% sales revenues versus the year ago period, its 2nd strong quarterly comparison well above the +25% minimum earnings guideline (C criteria). Made choppy progress and fundamentals remained reasonably strong since dropped from the Featured Stocks list on 6/15/20. See the latest FSU analysis for more details and a new annotated graph.
>>> FEATURED STOCK ARTICLE : Powerful Breakout for Qualys - 11/3/2023 | View all notes | Set NEW NOTE alert | Company Profile | SEC News | Chart | Request a new note C A S I |
Qualys is Extended From Prior Base and Perched Near All-Time High - Friday, May 29, 2020
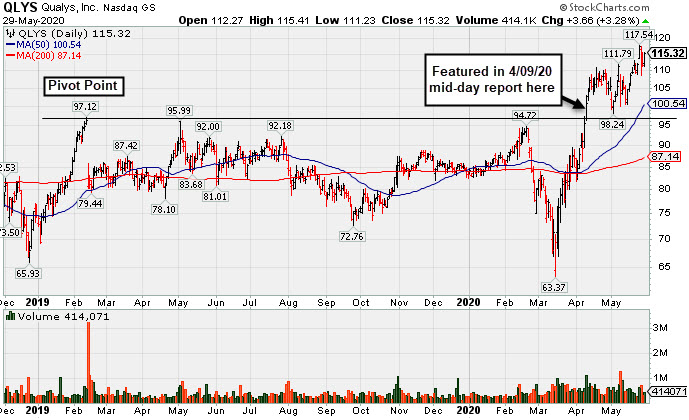
Qualys Inc (QLYS +$3.66 or +3.28% to $115.32) posted a gain with below average volume today for a second best ever close. It is extended from the previously noted base. The 50-day moving average (DMA) llinne and prior low ($98.24 on 5/04/20) define important near-term support to watch on pullbacks.
It has a 98 earnings Per Share Rating and recently reported Mar '20 quarterly earnings +33% on +14% sales revenues versus the year ago period, continuing its strong earnings track record with its 12th consecutive quarter above the +25% minimum earnings guideline (C criteria). Its annual earnings history (A criteria) has also been very strong an steady. The Computer Software - Security group has a 91 Group Relative Strength Rating, and leadership (L criteria) in the industry group is another favorable factor with respect to the fact-based investment system.
QLYS has traded up as much as +17% since highlighted in yellow with new pivot point cited based on its 2/12/19 high plus 10 cents in the 4/09/20 mid-day report (read here). When it powered to a new all-time highs with big volume-driven gains it was noted, "The volume-driven gains above the pivot point for a new high (N criteria) may be an indication of fresh institutional buying demand that can lead to a meaningful and sustained advance in price."
QLYS was last shown in this FSU section on 5/13/20 with a annotated graph under the headline, "Quiet Pullback Just Below "Max Buy" Level". Its Relative Strength Rating of 94 is well above the 80+ minimum guideline for buy candidates. Currently it has a Timeliness Rating of A and Sponsorship Rating of D. Its Accumulation/Distribution rating is A while its Up/Down Volume Ratio of 1.9 is an unbiased indication its shares have been under accumulation over the past 50 days. The number of top-rated funds owning its shares rose from 294 in Jun '17 to 478 in Mar '20, a reassuring sign concerning the I criteria. Its small supply of only 32.3 million shares (S criteria) in the public float can contribute to greater volatility in the event of institutional buying or selling.
Quiet Pullback Just Below "Max Buy" Level - Wednesday, May 13, 2020
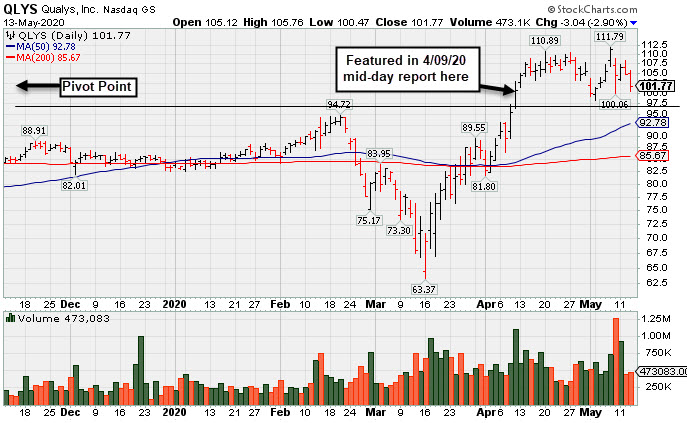
Qualys Inc (QLYS -$3.04 or -2.90% to $101.77) pulled back today with below average volume and its color code was changed to yellow after dipping back below its "max buy" level again. Prior highs in the $97 area recently acted as support. More damaging losses would raise concerns and trigger a technical sell signal.
It has a 98 earnings Per Share Rating and recently reported Mar '20 quarterly earnings +33% on +14% sales revenues versus the year ago period, continuing its strong earnings track record with its 12th consecutive quarter above the +25% minimum earnings guideline (C criteria). Its annual earnings history (A criteria) has also been very strong an steady. The Computer Software - Security group has a 92 Group Relative Strength Rating, and leadership (L criteria) in the industry group is another favorable factor with respect to the fact-based investment system.
QLYS has traded up as much as +11.3% since highlighted in yellow with new pivot point cited based on its 2/12/19 high plus 10 cents in the 4/09/20 mid-day report (read here). It powered to a new all-time highs with big volume-driven gains. It was noted, "The volume-driven gains above the pivot point for a new high (N criteria) may be an indication of fresh institutional buying demand that can lead to a meaningful and sustained advance in price."
Currently it has a Timeliness Rating of A and Sponsorship Rating of D. Its Accumulation/Distribution rating is A while its Up/Down Volume Ratio of 1.5 is an unbiased indication its shares have been under accumulation over the past 50 days. The number of top-rated funds owning its shares rose from 294 in Jun '17 to 490 in Mar '20, a reassuring sign concerning the I criteria. Its small supply of only 32.4 million shares (S criteria) in the public float can contribute to greater volatility in the event of institutional buying or selling.
Volume Totals Cooling While Stubbornly Holding Ground Near High - Monday, April 27, 2020
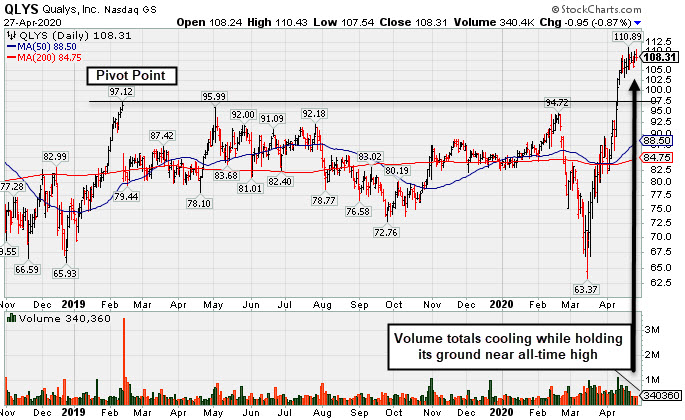
Qualys Inc (QLYS -$0.95 or -0.87% to $108.31) has seen recent volume totals cooling while stubbornly holding its ground near its all-time high. It is very extended from the previously noted base. Prior highs in the $97 area define initial support to watch on pullbacks.
QLYS has traded up as much as +10.4% since highlighted in yellow with new pivot point cited based on its 2/12/19 high plus 10 cents in the 4/09/20 mid-day report (read here). It powered to a new all-time highs with big volume-driven gains. It was noted, "The volume-driven gains above the pivot point for a new high (N criteria) may be an indication of fresh institutional buying demand that can lead to a meaningful and sustained advance in price."
Keep in mind it is due to report Mar '20 quarterly earnings news on 5/07/20. Volume and volatility often increase near earnings news. For the Dec '19 quarter its earnings rose +25% on +14% sales revenues, its 11th consecutive quarter above the +25% minimum earnings guideline (C criteria). Its annual earnings history (A criteria) has also been strong. The Computer Software - Security group has a 91 Group Relative Strength Rating, and leadership (L criteria) in the industry group is another favorable factor with respect to the fact-based investment system.
Currently it has a Timeliness Rating of A and Sponsorship Rating of E. Its Accumulation/Distribution rating is A while its Up/Down Volume Ratio of 1.4 is an unbiased indication its shares have been under accumulation over the past 50 days. The number of top-rated funds owning its shares rose from 294 in Jun '17 to 481 in Mar '20, a reassuring sign concerning the I criteria. Its small supply of only 32.4 million shares (S criteria) in the public float can contribute to greater volatility in the event of institutional buying or selling.
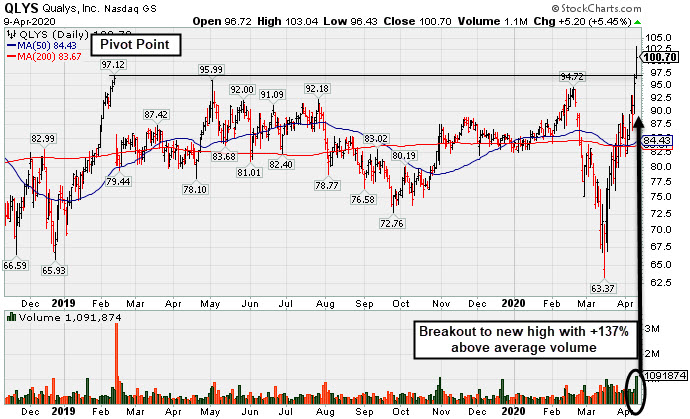
Volume-Driven Breakout Indicative of Institutional Buying Demand - Thursday, April 9, 2020
Qualys Inc (QLYS +$5.20 or +5.45% $100.70) finished strong after highlighted in yellow with new pivot point cited based on its 2/12/19 high plus 10 cents in the earlier mid-day report (read here). It powered to new 52-week and all-time highs with today's big volume-driven gain adding to an impressive spurt of gains from below its 50-day and 200-day moving average (DMA) lines. The volume-driven gains above the pivot point for a new high (N criteria) may be an indication of fresh institutional buying demand that can lead to a meaningful and sustained advance in price.
Fundamentals remain strong after it reported Dec '19 earnings +25% on +14% sales revenues, , its 11th consecutive quarter above the +25% minimum earnings guideline (C criteria). Its annual earnings history (A criteria) has also been strong. The Computer Software - Security group has a 84 Group Relative Strength Rating, and leadership (L criteria) in the industry group is another favorable factor with respect to the fact-based investment system.
It went through a choppy consolidation since dropped from the Featured Stocks list when noted with caution on 6/26/19. Relative Strength Rating of 95 is now above the 80+ minimum guideline for buy candidates. It previously met stubborn resistance in the $97 area. QLYS was last shown in this FSU section on 6/11/19 with annotated graphs under the headline, "Encountering Distributional Pressure in Recent Weeks".
Currently it has a Timeliness Rating of A and Sponsorship Rating of E. Its Accumulation/Distribution rating is A- while its Up/Down Volume Ratio of 1.2 is an unbiased indication its shares have been under accumulation over the past 50 days. The number of top-rated funds owning its shares rose from 294 in Jun '17 to 476 in Dec '19, a reassuring sign concerning the I criteria. Its small supply of only 32.1 million shares (S criteria) in the public float can contribute to greater volatility in the event of institutional buying or selling.
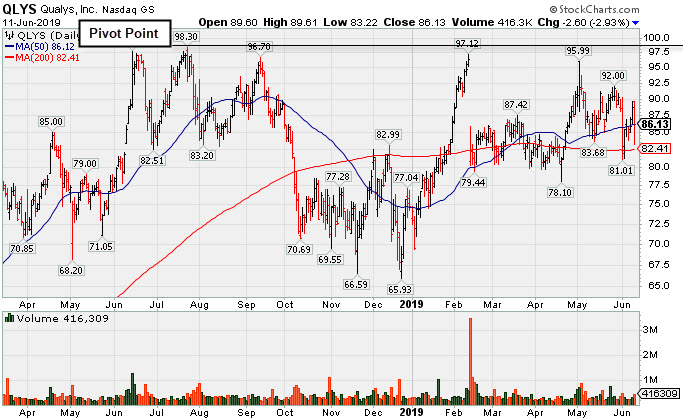
Encountering Distributional Pressure in Recent Weeks - Tuesday, June 11, 2019
Qualys Inc (QLYS -$2.60 or -2.93% to $86.13) is sputtering near its 50-day moving average (DMA) line ($86.12) after today's volume-driven loss. It recently encountered distributional pressure yet found support near its 200 DMA line. Its Relative Strength Rating is 72, below the 80+ minimum guideline for buy candidates. It has met stubborn resistance in the $97-98 area.
QLYS was highlighted in yellow with pivot point cited still based on its 7/24/18 high plus 10 cents in the 5/02/19 mid-day report (read here). It was last shown in this FSU section on 5/02/19 with annotated graphs under the headline, "Rallying to Challenge Previously Stubborn Resistance". Subsequent volume-driven gains above the pivot point for a new high (N criteria) may trigger a technical buy signal. Convincing gains into new high territory may be an indication of fresh institutional buying demand that can lead to a meaningful and sustained advance in price.
It reported earnings +36% on +16% sales revenues for the Mar '19 quarter, its 8th consecutive quarter above the +25% minimum earnings guideline (C criteria). Annual earnings history (A criteria) has been strong. The Computer Software - Security group has a 94 Group Relative Strength Rating, and leadership (L criteria) in the industry group is another favorable factor with respect to the fact-based investment system.
Currently it has a Timeliness Rating of A and Sponsorship Rating of C. Its Accumulation/Distribution rating is C+ while its Up/Down Volume Ratio of 1.4 is an unbiased indication its shares have been under accumulation over the past 50 days. The number of top-rated funds owning its shares rose from 294 in Jun '17 to 401 in Mar '19, a reassuring sign concerning the I criteria. Its small supply of only 32.1 million shares (S criteria) in the public float can contribute to greater volatility in the event of institutional buying or selling.
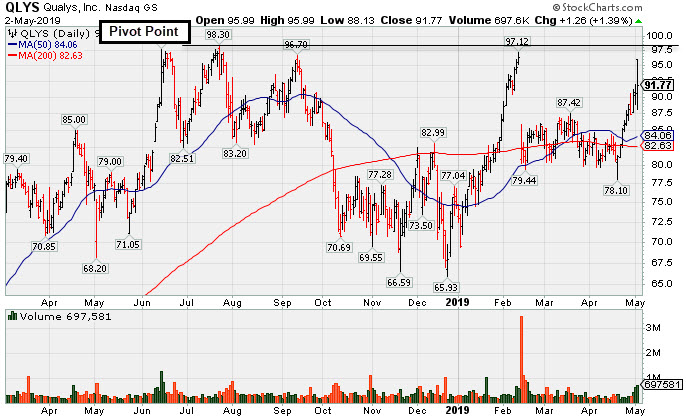
Rallying to Challenge Previously Stubborn Resistance - Thursday, May 2, 2019
Qualys Inc (QLYS +$1.26 or +1.39% to $91.77) was highlighted in yellow with pivot point cited still based on its 7/24/18 high plus 10 cents in the earlier mid-day report (read here). Subsequent volume-driven gains above the pivot point for a new high (N criteria) may trigger a technical buy signal. Once again it is perched very near its 52-week and all-time highs after today's 3rd consecutive volume-driven gain. It met stubborn resistance in the $97-98 area in the past year. Convincing gains into new high territory may be an indication of fresh institutional buying demand that can lead to a meaningful and sustained advance in price.
The Computer Software - Security group has a 97 Group Relative Strength Rating, and leadership (L criteria) in the industry group is another favorable factor with respect to the fact-based investment system. It reported earnings +36% on +16% sales revenues for the Mar '19 quarter, its 8th consecutive quarter above the +25% minimum earnings guideline (C criteria). Annual earnings history (A criteria) has been strong.
Price action was choppy since dropped from the Featured Stocks list on 10/08/18. QLYS was last shown in this FSU section on 9/03/18 with annotated graphs under the headline, "Cloud Security Firm Faces Some Near Term Resistance". Currently it has a Timeliness Rating of A and Sponsorship Rating of B. Its Accumulation/Distribution rating is B while its Up/Down Volume Ratio of 1.6 is an unbiased indication its shares have been under accumulation over the past 50 days.
The number of top-rated funds owning its shares rose from 294 in Jun '17 to 401 in Mar '19, a reassuring sign concerning the I criteria. Its small supply of only 32.1 million shares (S criteria) in the public float can contribute to great volatility in the event of institutional buying or selling.
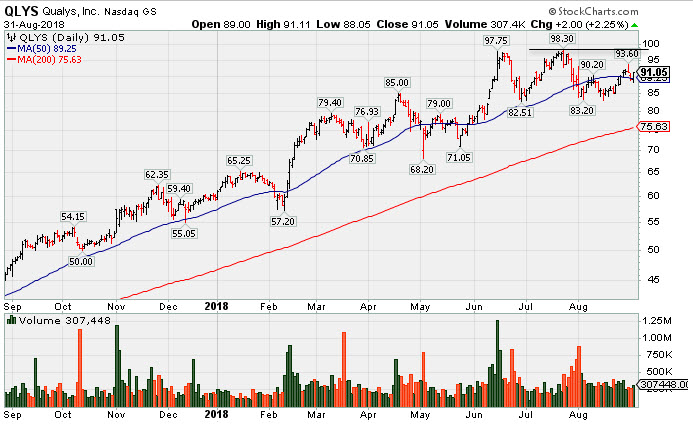
Cloud Security Firm Faces Some Near Term Resistance - Monday, September 3, 2018
Qualys Inc (QLYS +$2.00 or +2.25% to $91.05)Y- Consolidating near its 50 DMA line ($89.25). The recent low ($82.91 on 8/15/18) defines the next important near term support to watch. New pivot point is cited based on its 7/24/18 high plus 10 cents. Subsequent volume-driven gains above the pivot point may trigger a technical buy signal, however, it faces some near-term resistance due to overhead supply up to the $98 level.
QLYS was last shown in this FSU section on 7/16/18 with annotated graphs under the headline, "Computer Software-Security Firm Hovering Near All-Time High". Currently it has a Timeliness Rating of A and Sponsorship Rating of B, and its Accumulation/Distribution rating is B while its Up/Down Volume ratio of 1.0 is an unbiased indication its shares have been neutral concerning accumulation/distribution over the past 50 days.
Recently it reported Jun '18 earnings +50% on +23% sales revenues, its 5th consecutive quarter above the +25% minimum earnings guideline (C criteria). Annual earnings history (A criteria) has been strong.
The number of top-rated funds owning its shares rose from 294 in Jun '17 to 383 in Jun '18, a reassuring sign concerning the I criteria. Its small supply of only 31.6 million shares (S criteria) in the public float can contribute to great volatility in the event of institutional buying or selling. The Computer Software - Security group has a 86 Group Relative Strength Rating, and leadership (L criteria) in the industry group is another favorable factor with respect to the fact-based investment system.
Cloud Security Firm Faces Some Near Term Resistance - Saturday, September 1, 2018
Qualys Inc (QLYS +$2.00 or +2.25% to $91.05)Y- Consolidating near its 50 DMA line ($89.25). The recent low ($82.91 on 8/15/18) defines the next important near term support to watch. New pivot point is cited based on its 7/24/18 high plus 10 cents. Subsequent volume-driven gains above the pivot point may trigger a technical buy signal, however, it faces some near-term resistance due to overhead supply up to the $98 level.
QLYS was last shown in this FSU section on 7/16/18 with annotated graphs under the headline, "Computer Software-Security Firm Hovering Near All-Time High". Currently it has a Timeliness Rating of A and Sponsorship Rating of B, and its Accumulation/Distribution rating is B while its Up/Down Volume ratio of 1.0 is an unbiased indication its shares have been neutral concerning accumulation/distribution over the past 50 days.
Recently it reported Jun '18 earnings +50% on +23% sales revenues, its 5th consecutive quarter above the +25% minimum earnings guideline (C criteria). Annual earnings history (A criteria) has been strong.
The number of top-rated funds owning its shares rose from 294 in Jun '17 to 383 in Jun '18, a reassuring sign concerning the I criteria. Its small supply of only 31.6 million shares (S criteria) in the public float can contribute to great volatility in the event of institutional buying or selling. The Computer Software - Security group has a 86 Group Relative Strength Rating, and leadership (L criteria) in the industry group is another favorable factor with respect to the fact-based investment system.
Computer Software-Security Firm Hovering Near All-Time High - Monday, July 16, 2018
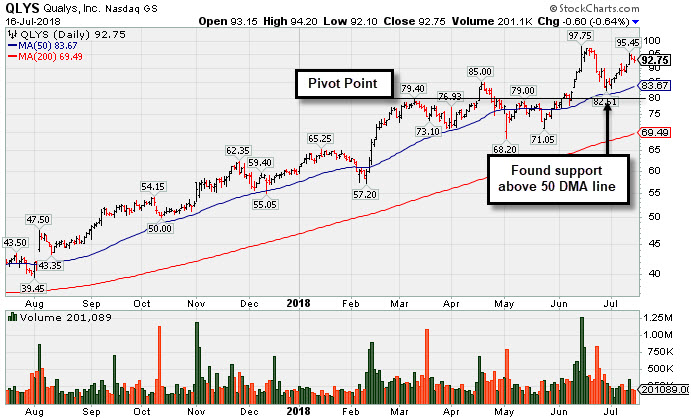
Qualys Inc (QLYS -$0.60 or -0.64% to $92.75) is hovering only -5.1% off its 52-week high. It found support during the recent consolidation near the prior high ($85.00 on 4/18/18) and above at its 50 DMA line ($83.67). QLYS was last shown in this FSU section on 5/29/18 with annotated graphs under the headline, "Rebounded Above 50-Day Average Yet Still Faces Overhead Supply".
Currently it has a Timeliness Rating of A and Sponsorship Rating of B, and its Accumulation/Distribution rating is B while its Up/Down Volume ratio of 1.6 is an unbiased indication its shares have been under accumulation over the past 50 days.
Recently it reported Mar '18 earnings +80% on +22% sales revenues, its 4th consecutive quarter above the +25% minimum earnings guideline (C criteria). Annual earnings history (A criteria) has been strong.
The number of top-rated funds owning its shares rose from 294 in Jun '17 to 375 in Jun '18, a reassuring sign concerning the I criteria. Its small supply of only 31.6 million shares (S criteria) in the public float can contribute to great volatility in the event of institutional buying or selling. The Computer Software - Security group has a 96 Group Relative Strength Rating, and leadership (L criteria) in the industry group is another favorable factor with respect to the fact-based investment system.
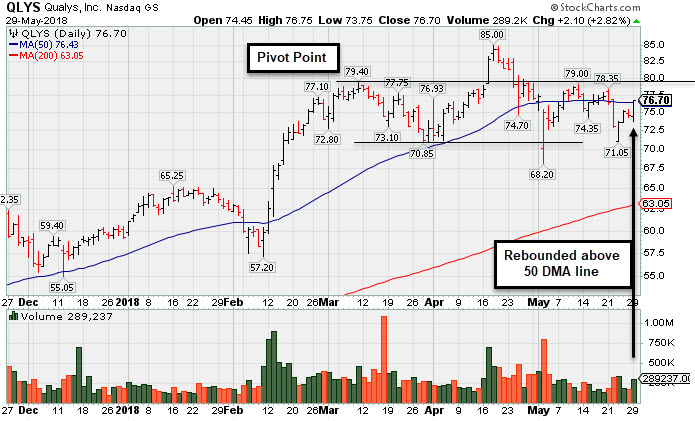
Rebounded Above 50-Day Average Yet Still Faces Overhead Supply - Tuesday, May 29, 2018
Qualys Inc (QLYS +$2.10 or +2.82% to $76.70) rebounded above its 50-day moving average (DMA) line ($76.43) with today's big gain backed by average volume helping its technical stance improve. It still faces resistance due to overhead supply up to the $85 level while it may be forming a new base pattern. Its intra-day slump on 5/02/18 undercut the low of the prior base, which resets the base count.
Currently it has a Timeliness Rating of A and Sponsorship Rating of C, but its Accumulation/Distribution rating is D- while its Up/Down Volume ratio of 0.9 is slightly bearish. QLYS was last shown in this FSU section on 4/18/18 with annotated graphs under the headline, "Quickly Rallied More Than 5% Above Prior High". It stalled after finishing strong when highlighted in yellow with pivot point cited based on its 3/09/18 high plus 10 cents in the 4/17/18 mid-day report (read here). It hit a new all-time high (N criteria) with a considerable gap up and gain backed by +108% above average volume, rising from a "late stage" base. Recently it reported Mar '18 earnings +80% on +22% sales revenues, its 4th consecutive quarter above the +25% minimum earnings guideline (C criteria). Annual earnings history (A criteria) has been strong. It went through a deep consolidation since dropped from the Featured Stocks list on 5/06/15.
The number of top-rated funds owning its shares rose from 294 in Jun '17 to 371 in Mar '18, a reassuring sign concerning the I criteria. Its small supply of only 31.6 million shares (S criteria) in the public float can contribute to great volatility in the event of institutional buying or selling. The Computer Software - Security group has a 93 Group Relative Strength Rating, and leadership (L criteria) in the industry group is another favorable factor with respect to the fact-based investment system.
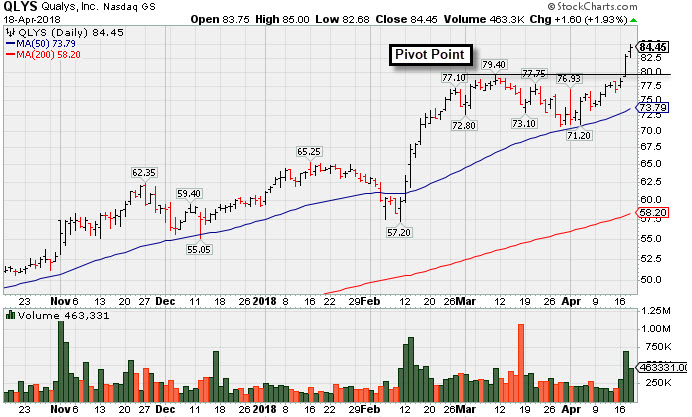
Quickly Rallied More Than 5% Above Prior High -
Qualys Inc (QLYS +$1.60 or +1.93% to $84.45) quickly rose above its "max buy" level, getting extended from the prior base, and its color code was changed to green. It finished strong after highlighted in yellow with pivot point cited based on its 3/09/18 high plus 10 cents in the 4/17/18 mid-day report (read here). It hit a new all-time high (N criteria) with a considerable gap up and gain backed by +108% above average volume, rising from a "late stage" base. It found support at its 50-day moving average (DMA) line as it formed a flat base pattern.
Recently it reported Dec '17 earnings +39% on +20% sales revenues, its 3rd consecutive quarter above the +25% minimum earnings guideline (C criteria). Annual earnings history (A criteria) has been strong. It went through a deep consolidation since dropped from the Featured Stocks list on 5/06/15. QLYS was last shown in this FSU section on 4/29/15 with annotated graphs under the headline, "Quiet Consolidation Within 5% of Prior Pivot Point".
The number of top-rated funds owning its shares rose from 294 in Jun '17 to 354 in Mar '18, a reassuring sign concerning the I criteria. Its small supply of only 30.5 million shares (S criteria) in the public float can contribute to great volatility in the event of institutional buying or selling. The Computer Software - Security group has a 95 Group Relative Strength Rating, and leadership (L criteria) in the industry group is another favorable factor with respect to the fact-based investment system.
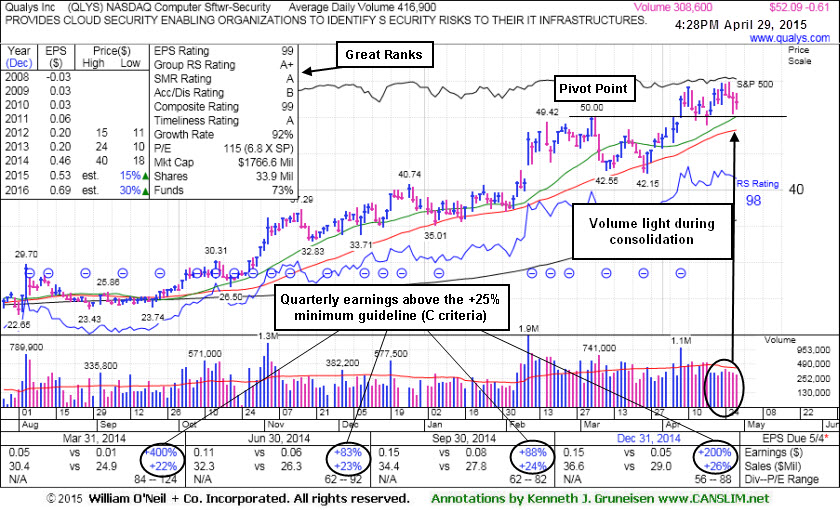
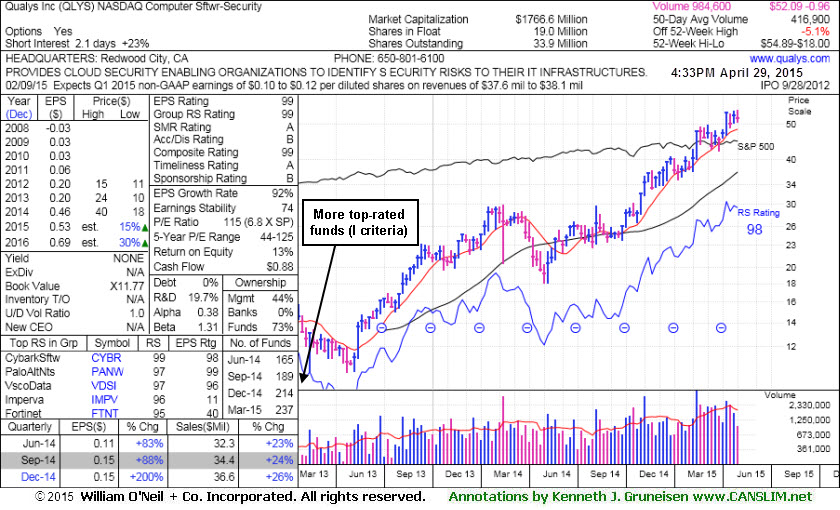
Quiet Consolidation Within 5% of Prior Pivot Point - Wednesday, April 29, 2015
Qualys Inc (QLYS -$0.61 or -1.16% to $52.09) has been quietly consolidating and its color code is changed to yellow after pulling back below its "max buy" level. It found support near prior highs in the $50 area and stayed well above its 50-day moving average (DMA) line ($48.22) during its recent consolidation. Subsequent damaging losses leading to violations would raise concerns and trigger technical sell signals.
QLYS made limited headway since last shown in this FSU section on 4/08/15 with annotated graphs under the headline, "Volume Driven Gain From Flat Base Triggered New Technical Buy Signal", hitting a new 52-week high (N criteria) with above average volume behind a considerable gap up and 5th consecutive gain.
It reported earnings +200% on +26% for the quarter ended December 31, 2014 versus the year ago period, marking its 4th consecutive quarterly comparison with earnings above the +25% minimum guideline (C criteria). The number of top-rated funds owning its shares rose from 152 in Mar '14 to 237 in Mar '15, a reassuring sign concerning the I criteria. Its small supply of only 19 million shares (S criteria) in the public float can contribute to great volatility in the event of institutional buying or selling. The Computer Software - Security group has a 99 Group Relative Strength Rating, and leadership (L criteria) in the industry group is another favorable factor with respect to the fact-based investment system.
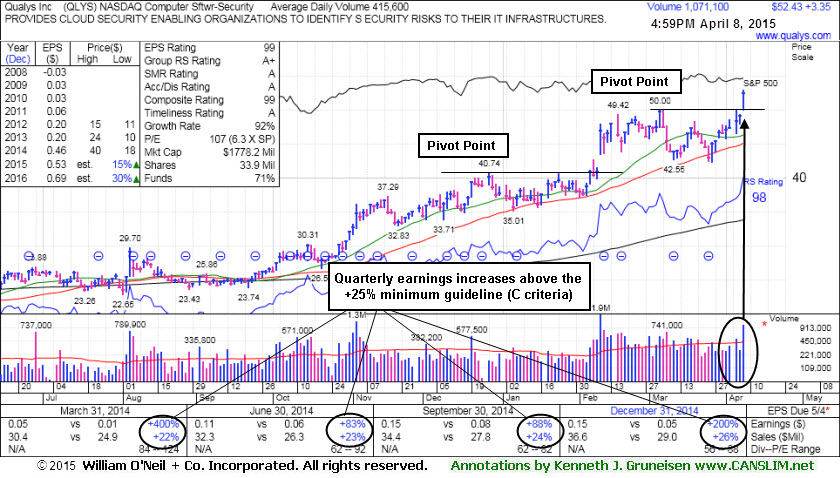
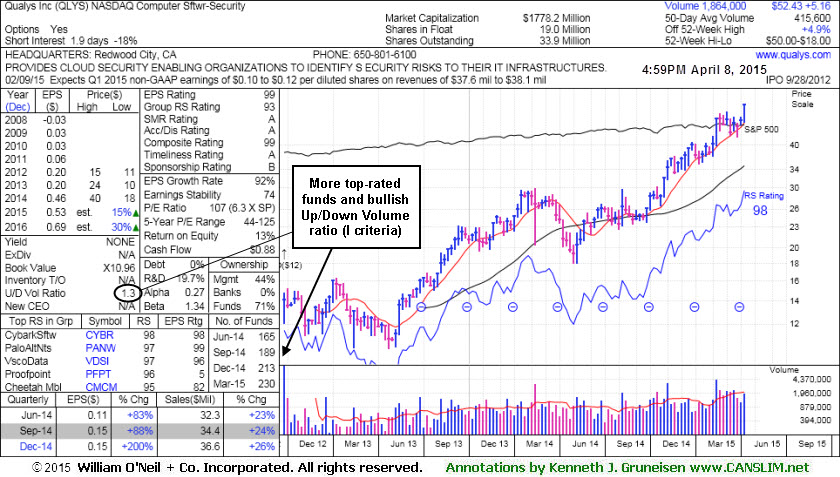
Volume Driven Gain From Flat Base Triggered New Technical Buy Signal - Wednesday, April 08, 2015
Qualys Inc (QLYS +$3.35 or +6.83% to $52.43) hit a new 52-week high (N criteria) with above average volume behind today's gap up and 5th consecutive gain triggering a new (or add-on) technical buy signal. Its color code was changed to yellow while rising from a new 5-week flat base with pivot point based on its 3/05/15 high plus 10 cents.
It was last shown in this FSU section on 3/20/15 with annotated graphs under the headline, "Consolidating Above Support at Prior Highs and 50-Day Moving Average", consolidating above prior highs in the $40-41 area and above its 50-day moving average (DMA) line which define important near-term support to watch.
It reported earnings +200% on +26% for the quarter ended December 31, 2014 versus the year ago period, marking its 4th consecutive quarterly comparison with earnings above the +25% minimum guideline (C criteria). The number of top-rated funds owning its shares rose from 152 in Mar '14 to 230 in Mar '15, a reassuring sign concerning the I criteria. Its Up/Down Volume Ratio of 1.3 is an unbiased indication its shares have been under accumulation over the past 50 days.
Its small supply of only 19 million shares (S criteria) in the public float can contribute to great volatility in the event of institutional buying or selling. The Computer Software - Security group has a 93 Group Relative Strength Rating, and leadership (L criteria) in the industry group is another favorable factor with respect to the fact-based investment system.
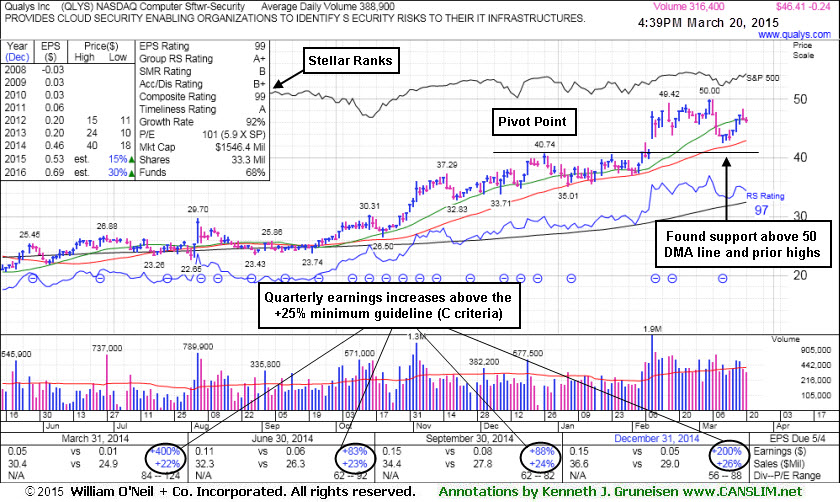
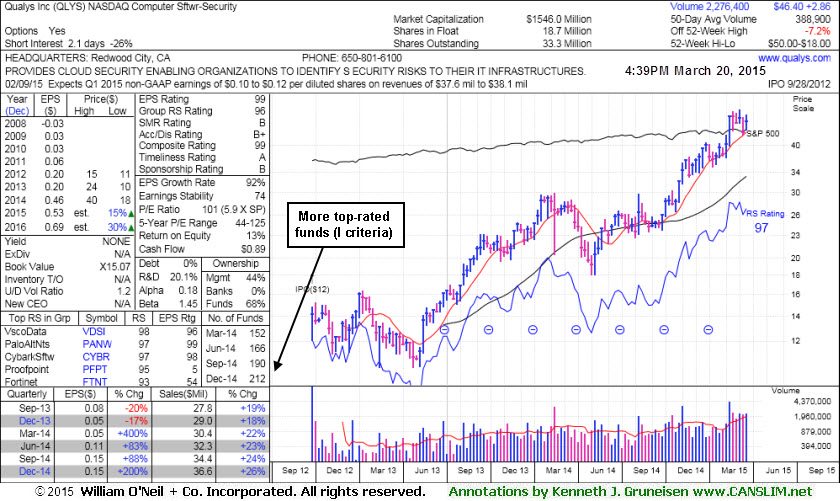
Consolidating Above Support at Prior Highs and 50-Day Moving Average - Friday, March 20, 2015
Qualys Inc (QLYS -$0.18 or -0.38% to $46.47) has been consolidating above prior highs in the $40-41 area and above its 50-day moving average (DMA) line which define important near-term support to watch. It was last shown in this FSU section on 3/02/15 with annotated graphs under the headline, "Near Highs and Tallying Another Big Volume-Driven Gain".
QLYS was highlighted in yellow with pivot point cited based on its 12/26/14 high plus 10 cents in the 2/06/15 mid-day report (read here). Technically, it had triggered a technical buy signal on the prior session. It soon blasted new 52-week high (N criteria) with a gap up and volume-driven gain into new high territory after reporting earnings +200% on +26% for the quarter ended December 31, 2014 versus the year ago period, beating expectations. Volume and volatility often increase near earnings news. That marked its 4th consecutive quarterly comparison with earnings above the +25% minimum guideline (C criteria).
The number of top-rated funds owning its shares rose from 152 in Mar '14 to 212 in Dec '14, a reassuring sign concerning the I criteria. Its Up/Down Volume Ratio of 1.2 is an unbiased indication its shares have been under accumulation over the past 50 days. Its small supply of only 18.7 million shares (S criteria) in the public float can contribute to great volatility in the event of institutional buying or selling. The Computer Software - Security group has a 96 Group Relative Strength Rating, and leadership (L criteria) in the industry group is another favorable factor with respect to the fact-based investment system.
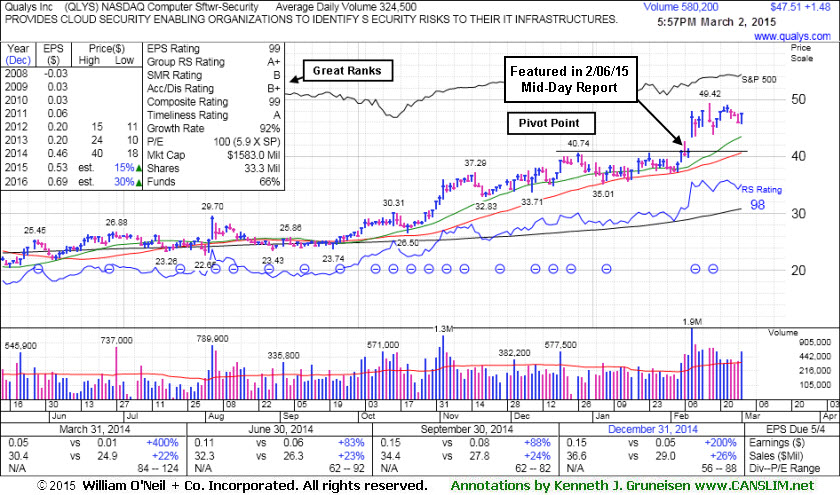
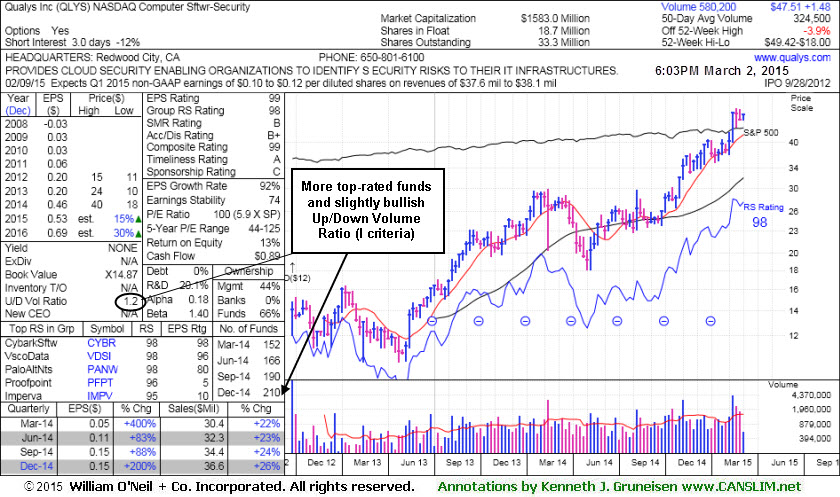
Near Highs and Tallying Another Big Volume-Driven Gain - Monday, March 02, 2015
Qualys Inc (QLYS +$1.48 or +3.22% to $47.51) has been holding its ground stubbornly after getting extended from its prior base. Prior highs in the $40-41 area and its 50-day moving average (DMA) line define the nearest chart support level. It was last shown in this FSU section on 2/09/15 with annotated graphs under the headline, "Strong Dec '14 Earnings Report While Perched Near All-Time High", as it posted a gain backed by +120% above average volume.
QLYS was highlighted in yellow with pivot point cited based on its 12/26/14 high plus 10 cents in the 2/06/15 mid-day report (read here). Technically, it had triggered a technical buy signal on the prior session. It soon blasted new 52-week high (N criteria) with a gap up and volume-driven gain into new high territory after reporting earnings +200% on +26% for the quarter ended December 31, 2014 versus the year ago period, beating expectations. Volume and volatility often increase near earnings news. That marked its 4th consecutive quarterly comparison with earnings above the +25% minimum guideline (C criteria).
The number of top-rated funds owning its shares rose from 152 in Mar '14 to 210 in Dec '14g, a reassuring sign concerning the I criteria. Its Up/Down Volume Ratio of 1.2 is an unbiased indication its shares have been under accumulation over the past 50 days. Its small supply of only 18.7 million shares (S criteria) in the public float can contribute to great volatility in the event of institutional buying or selling. The Computer Software - Security group has a 98 Group Relative Strength Rating, and leadership (L criteria) in the industry group is another favorable factor with respect to the fact-based investment system.
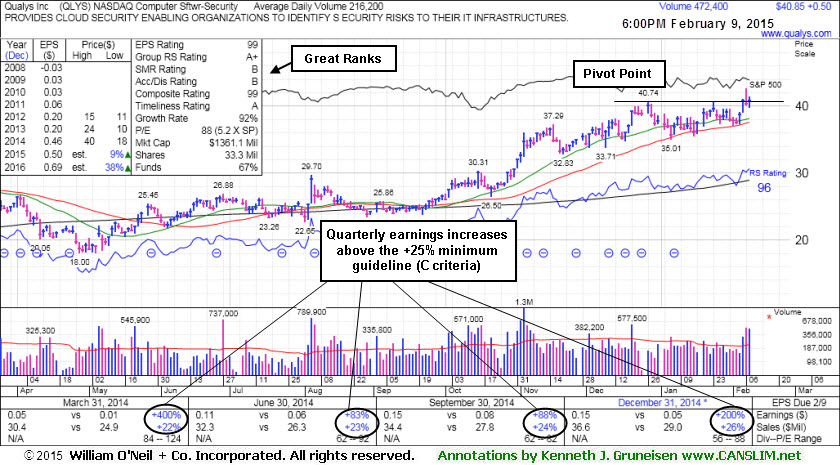
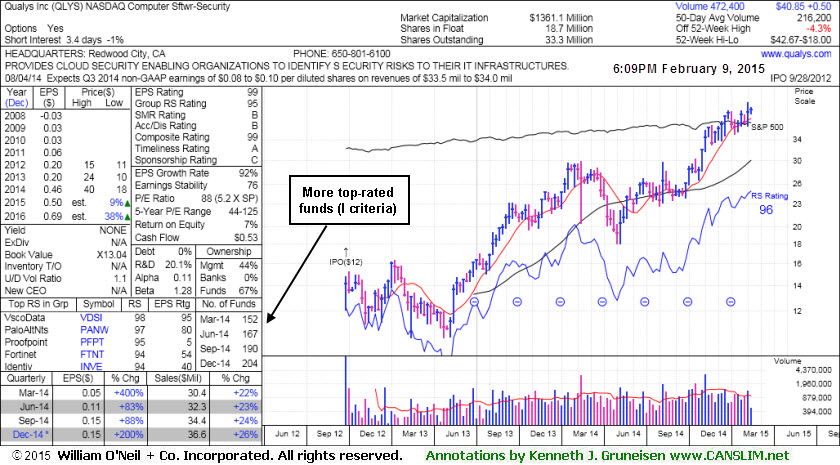
Strong Dec '14 Earnings Report While Perched Near All-Time High - Monday, February 09, 2015
Qualys Inc (QLYS +$0.50 or +1.24% to $40.85) posted a gain today backed by +120% above average volume and finished 4 cents off last Thursday's best-ever close. After the close it reported earnings +200% on +26% for the quarter ended December 31, 2014 versus the year ago period, beating expectations. Volume and volatility often increase near earnings news.
QLYS encountered distributional pressure after hitting a new 52-week high (N criteria) and there was a "negative reversal" for a volume-driven loss on Friday, closing below its pivot point. It was highlighted in yellow with pivot point cited based on its 12/26/14 high plus 10 cents in the 2/06/15 mid-day report (read here). Technically, it had triggered a technical buy signal on the prior session. It had last been noted in the 11/06/14 mid-day report with caution - "Reported earnings +88% on +24% sales revenues for the Sep '14 quarter, marking its 3rd consecutive quarterly comparison with earnings above the +25% minimum guideline (C criteria). Patient investors may watch for a new base or secondary buy point to develop and be noted in the weeks ahead."
The number of top-rated funds owning its shares rose from 152 in Mar '14 to 204 in Dec '14, a reassuring sign concerning the I criteria. Its small supply of only 18.7 million shares (S criteria) in the public float can contribute to great volatility in the event of institutional buying or selling. The Computer Software - Security group has a 95 Group Relative Strength Rating, and leadership (L criteria) in the industry group is another favorable factor with respect to the fact-based investment system.