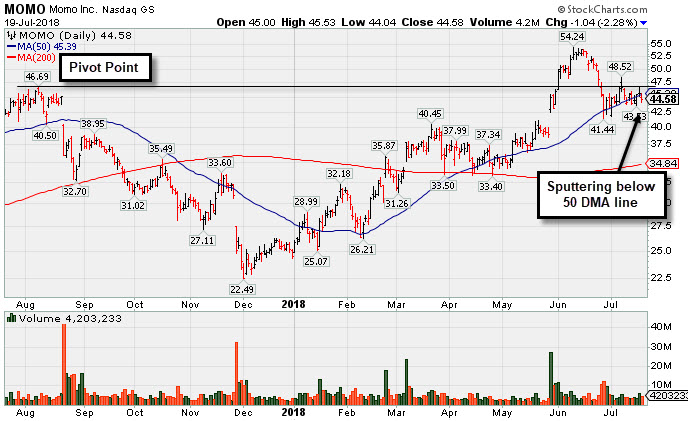
Chinese Internet Content Firm Below 50-Day Moving Average - Thursday, July 19, 2018
Momo Inc Ads (MOMO -$1.04 or -2.28% to $44.58) is consolidating just below its 50-day moving average (DMA) line ($45.39) after a slump below the old high ($46.69 on 8/08/17) into the prior base raised concerns. Subsequent losses below the recent low ($41.11 on 6/27/18) would raise serious concerns and trigger a worrisome technical sell signal.
It was last highlighted in this FSU section on 6/01/18 with an annotated graph under the headline Volume-Driven Gain for New All-Time High". It was highlighted in the 6/01/18 mid-day report (read here) with pivot point cited based on its 8/08/17 high plus 10 cents after a 9-month base.
It reported earnings +57% on +64% sales revenues for the Mar '18 quarter. The Dec '17 quarter showed earnings +20%, however, three of the past 4 quarterly comparisons were well above the +25% minimum earnings guideline (C criteria). It has a 96 Earnings Per Share Rating, putting it in the top 5% of all publicly traded companies based in its earnings growth history.This Chinese Internet - Content firm completed its $14 IPO in Dec '14.
The number of top-rated funds owning its shares rose from 46 in Jun '16 to 440 in Jun '18, a reassuring sign concerning the I criteria. Its current Up/Down Volume Ratio of 1.5 is an unbiased indication its shares have been under accumulation over the past 50 days. It has a small supply (S criteria) of only 44.2 million shares in the public float which can tribute to greater volatility in the event of institutional buying or selling.
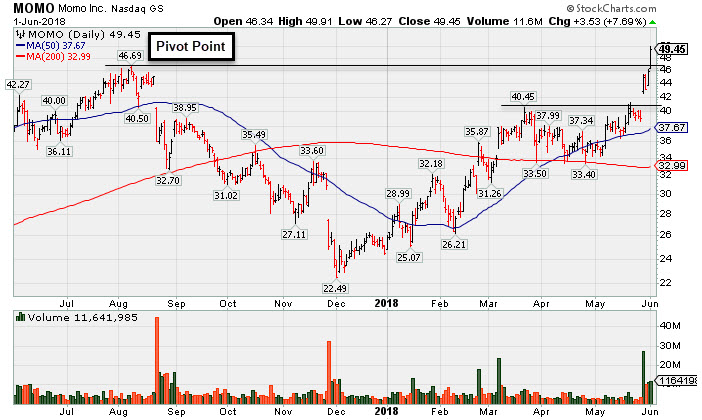
Volume-Driven Gain for New All-Time High - Friday, June 1, 2018
Momo Inc Ads (MOMO +$3.68 or +8.01% to $49.60) finished strong after highlighted in yellow in the earlier mid-day report (read here) with pivot point cited based on its 8/08/17 high plus 10 cents after a 9-month base. It gapped up today hitting a new all-time high with a 3rd volume-driven gain in the span of 4 sessions. The gain was backed by +172% above average volume as it hit a new high (N criteria) triggering a technical buy signal.
Bullish action this week came after it reported earnings +57% on +64% sales revenues for the Mar '18 quarter. The Dec '17 quarter showed earnings +20%, however, three of the past 4 quarterly comparisons were well above the +25% minimum earnings guideline (C criteria). It has a 96 Earnings Per Share Rating, putting it in the top 5% of all publicly traded companies based in its earnings growth history.
Since dropped from the Featured Stocks list on 8/25/17 it went through a deep consolidation below its 200 DMA then rebounded impressively. It was last shown in this FSU section on 8/24/17 with an annotated graph under the headline, "Gap Down Violation of 50-Day Average Triggered Technical Sell Signal". This Chinese Internet - Content firm completed its $14 IPO in Dec '14.
The number of top-rated funds owning its shares rose from 46 in Jun '16 to 401 in Mar '18, a reassuring sign concerning the I criteria. Its current Up/Down Volume Ratio of 1.2 is an unbiased indication its shares have been under accumulation over the past 50 days. It has a small supply (S criteria) of only 43.8 million shares in the public float which can tribute to greater volatility in the event of institutional buying or selling.
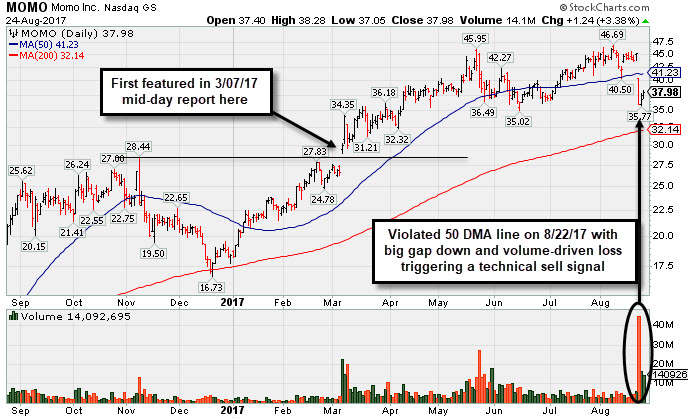
Gap Down Violation of 50-Day Average Triggered Technical Sell Signal - Thursday, August 24, 2017
Momo Inc Ads (MOMO +$1.24 or +3.38% to $37.98) posted a second consecutive small gain with above average volume. On 8/22/17 it violated its 50-day moving average (DMA) line triggering a technical sell signal with a damaging volume-driven loss and its color code was changed to green. It halted its slide near prior low ($35.02 on 6/15/17), however, more damaging losses would raise serious concerns and trigger a more worrisome technical sell signal. Only a prompt rebound above the 50 DMA line would help its outlook improve.
Recent weakness came after it reported earnings +192% on +215% sales revenues for the Jun '17 quarter versus the year ago period. Members were reminded - "Volume and volatility often increase near earnings news." MOMO was last shown in this FSU section on 7/25/17 with an annotated graph under the headline, "Perched Within Striking Distance of Prior High". It traded up as much as +57.15% since first highlighted in yellow in the 3/07/17 mid-day report (read here) with pivot point cited based on its 2/21/17 high after a cup-with-handle base.
Limited history remains of some concern for this Chinese Internet - Content firm that completed its $14 IPO in Dec '14. The number of top-rated funds owning its shares rose from 46 in Jun '16 to 259 in Jun '17, a reassuring sign concerning the I criteria. However, its current Up/Down Volume Ratio of 0.9 is an unbiased indication its shares have been under distributional pressure over the past 50 days. It has a small supply (S criteria) of only 43.4 million shares in the public float which can tribute to greater volatility in the event of institutional buying or selling.
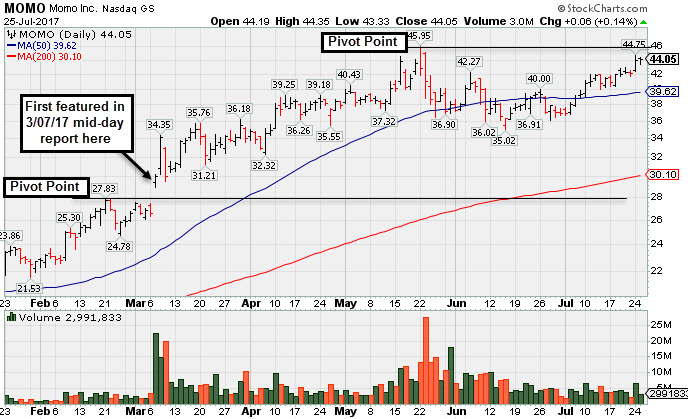
Perched Within Striking Distance of Prior High - Tuesday, July 25, 2017
Momo Inc Ads (MOMO +$0.06 or +0.14% to $44.05) has nearly challenged its prior high ($45.95 on 5/22/17) with its latest gains after gapping up on the prior session. It is consolidating above its 50-day moving average (DMA) line, building on a third-stage base. Its color code was changed to yellow with a new pivot point cited based on its 5/22/17 high plus 10 cents. Subsequent volume-driven gains for new highs may trigger a new (or add-on) technical buy signal. Below its 50 DMA line, the prior low ($35.02 on 6/15/17) defines the next important chart support level where a violation would raise more serious concerns.
The rebound above its 50 DMA line helped its outlook to improve since MOMO was last shown in this FSU section on 6/14/17 with an annotated graph under the headline, "Sputtering Below 50-Day Moving Average Line". It was first highlighted in yellow in the 3/07/17 mid-day report (read here) with pivot point cited based on its 2/21/17 high after a cup-with-handle base.
Greatly improved sales and earnings in the Mar '17 quarter marked its 4th consecutive comparison with very strong results versus the year ago periods. Limited history remains of some concern for this Chinese Internet - Content firm that completed its $14 IPO in Dec '14.
The number of top-rated funds owning its shares rose from 46 in Jun '16 to 214 in Jun '17, a reassuring sign concerning the I criteria. Its current Up/Down Volume Ratio of 1.1 is an unbiased indication its shares have been under only slight accumulation over the past 50 days. It has a small supply (S criteria) of only 43.4 million shares in the public float.
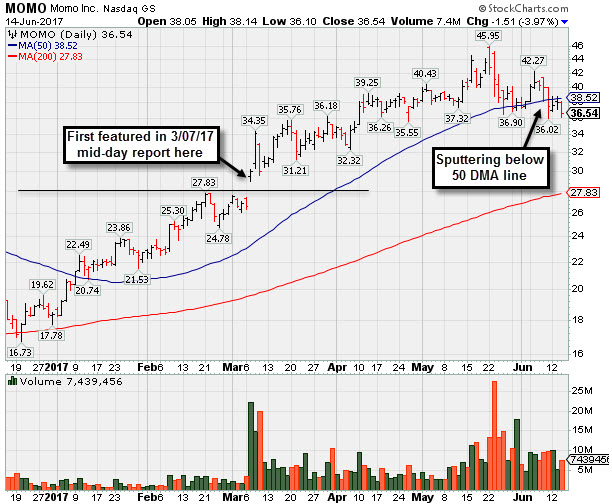
Sputtering Below 50-Day Moving Average Line - Wednesday, June 14, 2017
Momo Inc Ads (MOMO -$1.51 or -3.97% to $36.54) has been sputtering below its 50-day moving average (DMA) line ($38.52) with recent losses on higher volume raising concerns and triggering a technical sell signal. The prior low ($35.55 on 4/26/17) defines the next important chart support level where a violation would raise more serious concerns. A prompt rebound above its 50-day moving average DMA line is needed fro its outlook to improve.
MOMO was last shown in this FSU section on 5/09/17 with an annotated graph under the headline, "Hovering Near Record High, Extended From Prior Base". It was first highlighted in yellow in the 3/07/17 mid-day report (read here) with pivot point cited based on its 2/21/17 high after a cup-with-handle base.
Greatly improved sales and earnings in the Mar '17 quarter marked its 4th consecutive comparison with very strong results versus the year ago periods. Limited history remains of some concern for this Chinese Internet - Content firm that completed its $14 IPO in Dec '14.
The number of top-rated funds owning its shares rose from 46 in Jun '16 to 161 in Mar '17, a reassuring sign concerning the I criteria. Its current Up/Down Volume Ratio of 1.0 is an unbiased indication its shares have been neutral in terms of accumulation/distribution over the past 50 days. It has a small supply (S criteria) of only 42.8 million shares in the public float.
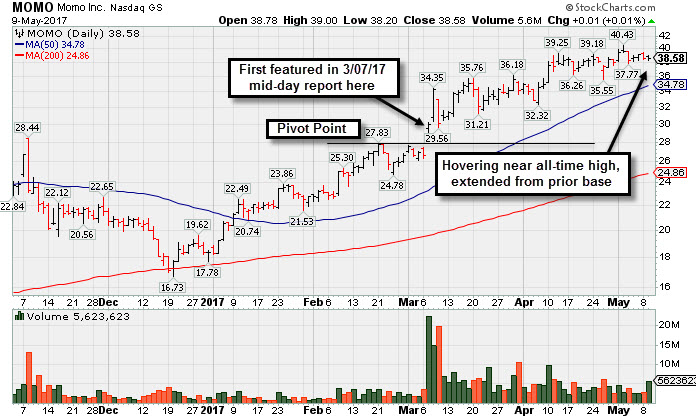
Hovering Near Record High, Extended From Prior Base - Tuesday, May 9, 2017
Momo Inc Ads (MOMO +$0.01 or +0.01% to $38.58) is hovering near its all-time high, stubbornly holding its ground. Its 50-day moving average DMA line ($34.78) defines important near-term support to watch. Disciplined investors avoid chasing stocks extended more than +5% from a sound base pattern.
MOMO was last shown in this FSU section on 4/06/17 with an annotated graph under the headline, "Extended From Prior Base and Perched Near High". It was first highlighted in yellow in the 3/07/17 mid-day report (read here) with pivot point cited based on its 2/21/17 high after a cup-with-handle base.
Greatly improved sales and earnings in the Dec '16 quarter marked its 3rd consecutive comparison with very strong results versus the year ago periods. Limited history remains of some concern for this Chinese Internet - Content firm that completed its $14 IPO in Dec '14.
Greatly improved sales and earnings in the Dec '16 quarter marked its 3rd consecutive comparison with very strong results versus the year ago periods. Limited history remains of some concern for this Chinese Internet - Content firm that completed its $14 IPO in Dec '14.
The number of top-rated funds owning its shares rose from 39 in Mar '16 to 114 in Mar '17, a reassuring sign concerning the I criteria. Its current Up/Down Volume Ratio of 2.0 is an unbiased indication its shares have been under accumulation over the past 50 days. It has a small supply (S criteria) of only 42.8 million shares in the public float.
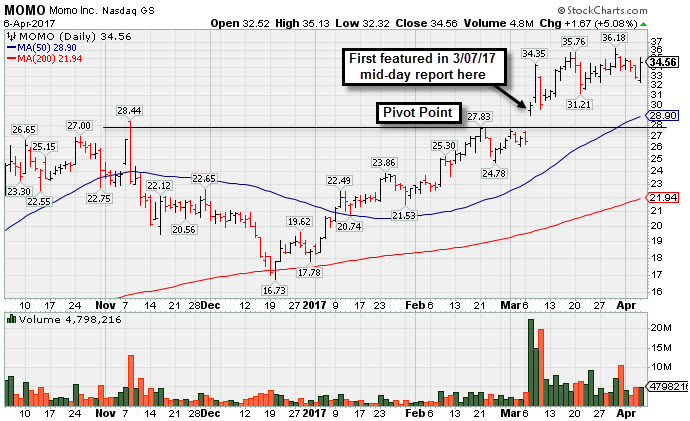
Extended From Prior Base and Perched Near High - Thursday, April 6, 2017
Momo Inc Ads (MOMO +$1.67 or +5.08% to $34.56) posted a solid gain with near average volume today. It is perched near its all-time high, but extended from the previously noted base. Prior highs in the $27-28 area and its 50-day moving average (DMA) line ($28.90) define important support to watch on pullbacks.
It was last shown in this FSU section on 3/07/17 with an annotated graph under the headline, "Breakaway Gap Followed Very Strong Earnings Report". It was highlighted in yellow in the earlier mid-day report (read here) with pivot point cited based on its 2/21/17 high after a cup-with-handle base. It hit new all-time highs with a big "breakaway gap" triggering a technical buy signal after reporting greatly improved sales and earnings in the Dec '16 quarterly, its 3rd consecutive comparison with very strong results versus the year ago periods. Limited history remains a concern for this Chinese Internet - Content firm that completed its $14 IPO in Dec '14.
A breakaway gap has been repeatedly noted as the one exception where the usual limit can be stretched to allow for disciplined investors to buy as much as +10% above the pivot point. Longtime readers know that the regular limit above the pivot point is +5%. Risk increases the further one chases a stock above its pivot point as it increases the likelihood that an ordinary pullback of -7-8% might prompt one to sell based on the fact-based system's strict selling rules.
The number of top-rated funds owning its shares rose from 39 in Mar '16 to 97 in Mar '17, a reassuring sign concerning the I criteria. Its current Up/Down Volume Ratio of 1.9 is an unbiased indication its shares have been under accumulation over the past 50 days. It has a small supply (S criteria) of only 42.7 million shares in the public float.
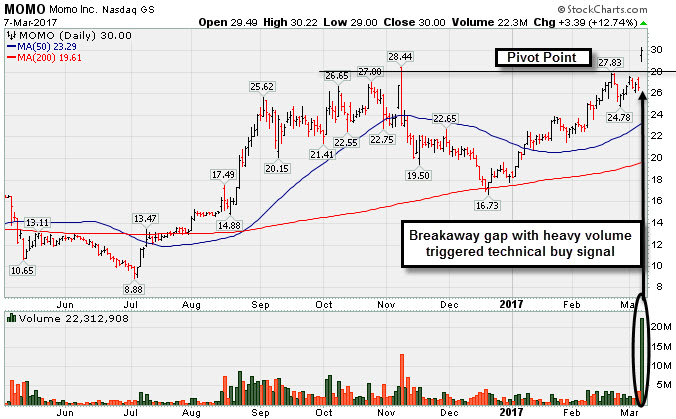
Breakaway Gap Followed Very Strong Earnings Report - Tuesday, March 7, 2017
Momo Inc Ads (MOMO +$3.39 or +12.74% to $30.00) was highlighted in yellow in the earlier mid-day report (read here) with pivot point cited based on its 2/21/17 high after a cup-with-handle base. It hit new all-time highs with a big "breakaway gap" triggering a technical buy signal after reporting greatly improved sales and earnings in the Dec '16 quarterly, its 3rd consecutive comparison with very strong results versus the year ago periods. Limited history remains a concern for this Chinese Internet - Content firm that completed its $14 IPO in Dec '14.
A breakaway gap has been repeatedly noted as the one exception where the usual limit can be stretched to allow for disciplined investors to buy as much as +10% above the pivot point. Longtime readers know that the regular limit above the pivot point is +5%. Risk increases the further one chases a stock above its pivot point as it increases the likelihood that an ordinary pullback of -7-8% might prompt one to sell based on the fact-based system's strict selling rules.
The number of top-rated funds owning its shares rose from 39 in Mar '16 to 82 in Dec '16, a reassuring sign concerning the I criteria. Its current Up/Down Volume Ratio of 1.7 is an unbiased indication its shares have been under accumulation over the past 50 days. It has a small supply (S criteria) of only 42.7 million shares in the public float.