Found Support at 200-Day Average But Faces Overhead Supply - Monday, November 26, 2018
Rebound Above 50-Day Average Helped Outlook Improve - Thursday, November 1, 2018
Below 50-Day Moving Average Which May Act as Resistance - Tuesday, October 16, 2018
Very Extended From Any Sound Base After Streak of Gains - Monday, September 10, 2018
Perched Near All-Time High After Testing Support at 50-Day Average - Wednesday, July 25, 2018
Pullback After Volume-Driven Gains For New Highs - Thursday, June 7, 2018
Perched Near All-Time High Building a Short New Base - Wednesday, April 25, 2018
Bullish Action Followed Latest Earnings Report - Thursday, March 22, 2018
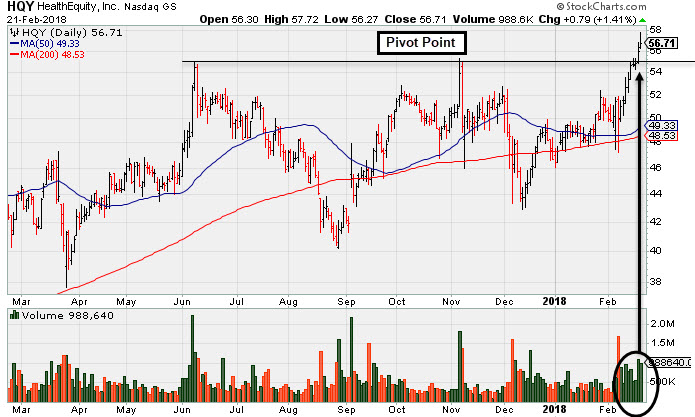
Fundamentals Remained Favorable and Strength Returned - Wednesday, February 21, 2018
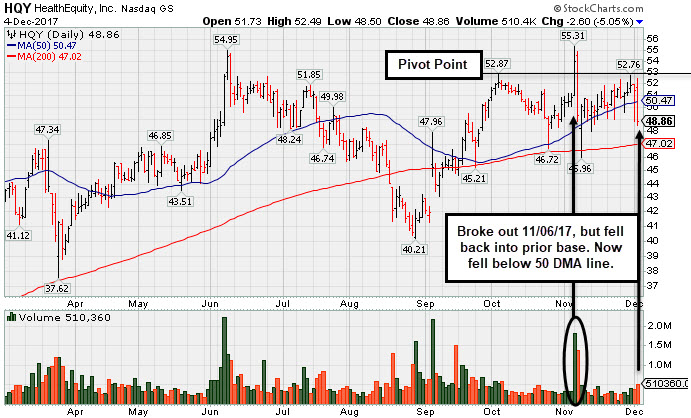
Sank Below 50-Day Moving Average With Loss on Higher Volume - Monday, December 4, 2017
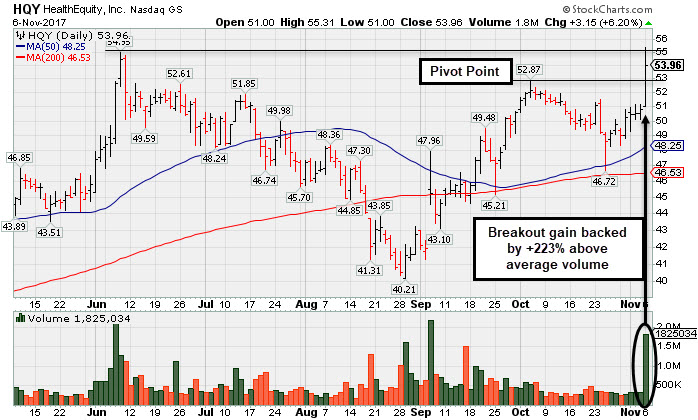
Hit New High With Big Volume-Driven Gain - Monday, November 6, 2017
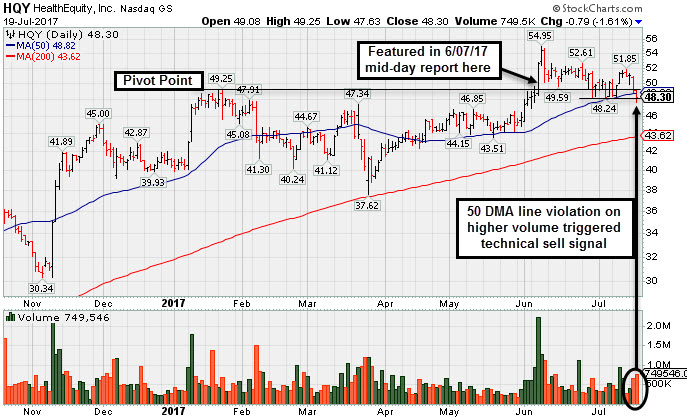
50-Day Moving Average Violation Triggers Technical Sell Signal - Wednesday, July 19, 2017
High Volume Breakout Quickly Getting Extended - Wednesday, June 7, 2017
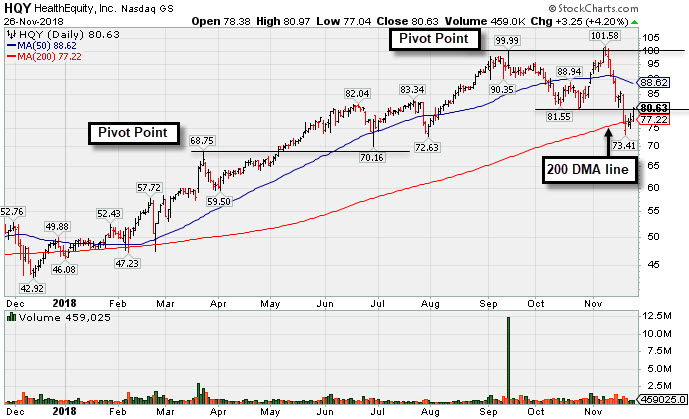
Found Support at 200-Day Average But Faces Overhead Supply - Monday, November 26, 2018
Healthequity Inc (HQY +$3.25 or +4.20% to $80.63) found support while recently sputtering near its 200-day moving average (DMA) line ($77.22) after damaging losses violated the prior low ($80.56 on 10/24/18) triggering a technical sell signal. A subsequent rebound above the 50 DMA line ($88.62) is needed for its outlook to improve. It now faces resistance due to overhead supply up to the $99 level.
HQY was last shown in this FSU section on 11/01/18 with an annotated graph under the headline, "Rebound Above 50-Day Average Helped Outlook Improve". It reported earnings +62% on +25% sales revenues for the Jul '18 quarter versus the year ago period, continuing its strong earnings track record. Fundamentals remain strong, as the past 7 quarterly comparisons were above the +25% minimum earnings guideline (C criteria) and underpinned by strong sales revenues increases.
It has managed a bumpy climb that may have shaken out many investors since triggering a technical buy signal with a gain above the new pivot point with +90% above average volume when highlighted in the 2/20/18 mid-day report (read here).
The number of top-rated funds owning its shares rose from 369 in Dec '16 to 547 in Sep '18, a reassuring sign concerning the I criteria. Its current Up/Down Volume Ratio of 1.4 is also an unbiased indication its shares have been under accumulation over the past 50 days. It has a fairly small supply of only 62.3 million shares (S criteria) outstanding, which can contribute to greater price volatility in the event of institutional buying or selling. It currently has a Timeliness Rating of B and a Sponsorship Rating of B.
The Commercial Services - Outsourcing industry group currently has a Group Relative Strength Rating of 49, however there are other strong leaders in the group, a reassuring sign concerning the L criteria. It completed its $14 IPO on 7/31/14 followed by an additional Public Offering on 5/05/15 and Secondary Offerings on both 10/20/16 and 9/23/15.
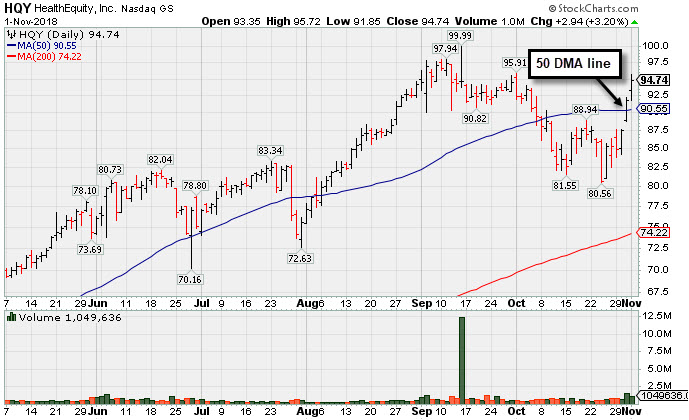
Rebound Above 50-Day Average Helped Outlook Improve - Thursday, November 1, 2018
Healthequity Inc (HQY +$2.82 or +3.07% to $94.62) gapped up on the prior session and posted another big gain today with above average volume, rebounding above the 50-day moving average (DMA) line ($90.55) and helping its outlook to improve. It faces some resistance due to overhead supply up to the $99 level. It found support near prior highs in the $82-83 area, but more damaging losses would raise serious concerns.
HQY was last shown in this FSU section on 10/16/18 with an annotated graph under the headline, "Below 50-Day Moving Average Which May Act as Resistance". It reported earnings +62% on +25% sales revenues for the Jul '18 quarter versus the year ago period, continuing its strong earnings track record. Fundamentals remain strong, as the past 7 quarterly comparisons were above the +25% minimum earnings guideline (C criteria) and underpinned by strong sales revenues increases.
It has managed a bumpy climb that may have shaken out many investors since triggering a technical buy signal with a gain above the new pivot point with +90% above average volume when highlighted in the 2/20/18 mid-day report (read here).
The number of top-rated funds owning its shares rose from 369 in Dec '16 to 528 in Sep '18, a reassuring sign concerning the I criteria. Its current Up/Down Volume Ratio of 1.8 is also an unbiased indication its shares have been under accumulation over the past 50 days. It has a fairly small supply of only 62.3 million shares (S criteria) outstanding, which can contribute to greater price volatility in the event of institutional buying or selling. It currently has a Timeliness Rating of A and a Sponsorship Rating of B.
The Commercial Services - Outsourcing industry group currently has a Group Relative Strength Rating of 63, however there are other strong leaders in the group hitting new highs, a reassuring sign concerning the L criteria. It completed its $14 IPO on 7/31/14 followed by an additional Public Offering on 5/05/15 and Secondary Offerings on both 10/20/16 and 9/23/15.
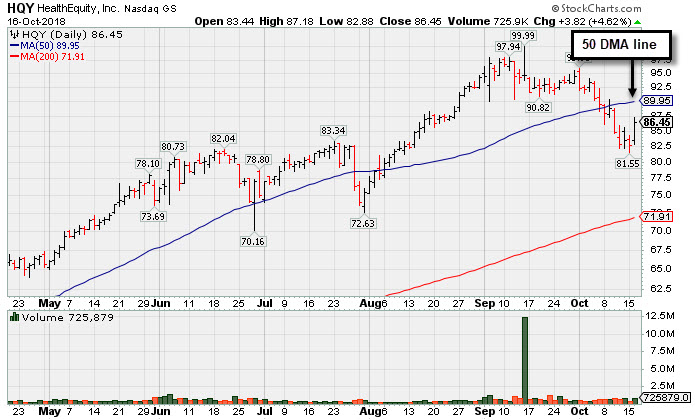
Below 50-Day Moving Average Which May Act as Resistance - Tuesday, October 16, 2018
Healthequity Inc (HQY +$3.82 or +4.62% to $86.45) posted a big gain today rebounding toward its 50 DMA line ($89.95). That important short-term average may act as resistance. It found support near prior highs in the $82-83 area, but more damaging losses would raise serious concerns.
It was last shown in this FSU section on 9/10/18 with an annotated graph under the headline, "Very Extended From Any Sound Base After Streak of Gains". It reported earnings +62% on +25% sales revenues for the Jul '18 quarter versus the year ago period, continuing its strong earnings track record. Fundamentals remain strong, as the past 7 quarterly comparisons were above the +25% minimum earnings guideline (C criteria) and underpinned by strong sales revenues increases.
It has managed a bumpy climb that may have shaken out many investors since triggering a technical buy signal with a gain above the new pivot point with +90% above average volume when highlighted in the 2/20/18 mid-day report (read here).
The number of top-rated funds owning its shares rose from 369 in Dec '16 to 511 in Jun '18, a reassuring sign concerning the I criteria. Its current Up/Down Volume Ratio of 2.1 is also an unbiased indication its shares have been under accumulation over the past 50 days. It has a fairly small supply of only 62.3 million shares (S criteria) outstanding, which can contribute to greater price volatility in the event of institutional buying or selling. It currently has a Timeliness Rating of A and a Sponsorship Rating of B.
The Commercial Services - Outsourcing industry group currently has a Group Relative Strength Rating of 70, however there are other strong leaders in the group hitting new highs, a reassuring sign concerning the L criteria. It completed its $14 IPO on 7/31/14 followed by an additional Public Offering on 5/05/15 and Secondary Offerings on both 10/20/16 and 9/23/15.
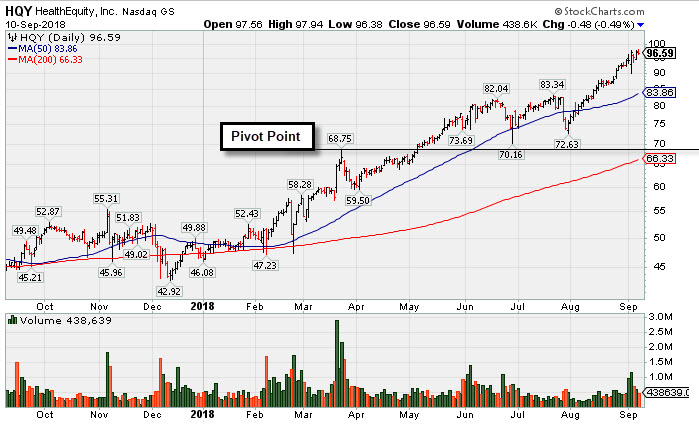
Very Extended From Any Sound Base After Streak of Gains - Monday, September 10, 2018
Healthequity Inc (HQY -$0.48 or -0.49% to $96.59) is perched near its all-time high following impressive volume-driven gains. It is very extended from any sound base. Prior highs in the $82-83 area define support along with its 50 DMA line ($83.86). It was last shown in this FSU section on 7/25/18 with an annotated graph under the headline, "Perched Near All-Time High After Testing Support at 50-Day Average".
It reported earnings +62% on +25% sales revenues for the Jul '18 quarter versus the year ago period, continuing its strong earnings track record. Fundamentals remain strong, as the past 7 quarterly comparisons were above the +25% minimum earnings guideline (C criteria) and underpinned by strong sales revenues increases.
It has managed a bumpy climb that may have shaken out many investors since triggering a technical buy signal with a gain above the new pivot point with +90% above average volume when highlighted in the 2/20/18 mid-day report (read here).
The number of top-rated funds owning its shares rose from 369 in Dec '16 to 485 in Jun '18, a reassuring sign concerning the I criteria. Its current Up/Down Volume Ratio of 3.0 is also an unbiased indication its shares have been under accumulation over the past 50 days. It has a fairly small supply of only 62 million shares (S criteria) outstanding, which can contribute to greater price volatility in the event of institutional buying or selling. It currently has a Timeliness Rating of A and a Sponsorship Rating of B.
The Commercial Services - Outsourcing industry group currently has a Group Relative Strength Rating of 83, and there are other strong leaders in the group hitting new highs, a reassuring sign concerning the L criteria. It completed its $14 IPO on 7/31/14 followed by an additional Public Offering on 5/05/15 and Secondary Offerings on both 10/20/16 and 9/23/15.
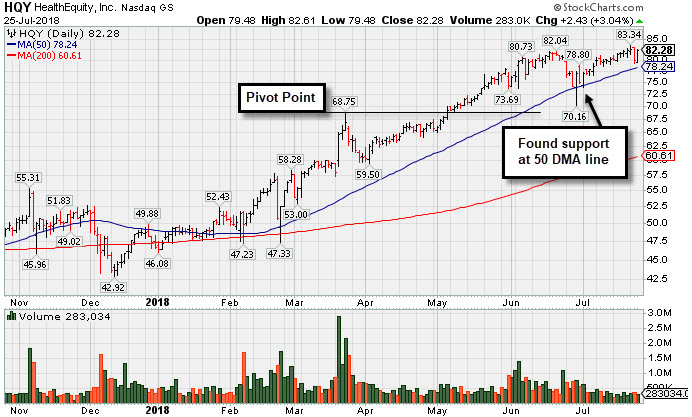
Perched Near All-Time High After Testing Support at 50-Day Average - Wednesday, July 25, 2018
Healthequity Inc (HQY +$2.43 or +3.04% to $82.28) posted a big gain today with light volume as it rebounded near its all-time high. It found encouraging support while recently consolidating above its 50-day moving average (DMA) line ($78.24), but it did not form a base pattern of sufficient length.
HQY was last shown in this FSU section on 6/07/18 with an annotated graph under the headline, "Pullback After Volume-Driven Gains For New Highs"
. It reported earnings +63% on +26% sales revenues for the Apr '18 quarter versus the year ago period, continuing its strong earnings track record. Fundamentals remain strong, as the past 6 quarterly comparisons were above the +25% minimum earnings guideline (C criteria) and underpinned by strong sales revenues increases.
Members were previously reminded - "Disciplined investors always limit losses by selling any stock that falls more than -7% from their purchase price, knowing they can always buy back any stock if strength returns." It has managed a bumpy climb that may have shaken out many investors since triggering a technical buy signal with a gain above the new pivot point with +90% above average volume when highlighted in the 2/20/18 mid-day report (read here).
The number of top-rated funds owning its shares rose from 369 in Dec '16 to 462 in Jun '18, a reassuring sign concerning the I criteria. Its current Up/Down Volume Ratio of 2.1 is also an unbiased indication its shares have been under accumulation over the past 50 days. It has a fairly small supply of only 62 million shares (S criteria) outstanding, which can contribute to greater price volatility in the event of institutional buying or selling. It currently has a Timeliness Rating of A and a Sponsorship Rating of B.
The Commercial Services - Outsourcing industry group currently has a Group Relative Strength Rating of 83, and there are other strong leaders in the group hitting new highs, a reassuring sign concerning the L criteria. It completed its $14 IPO on 7/31/14 followed by an additional Public Offering on 5/05/15 and Secondary Offerings on both 10/20/16 and 9/23/15.
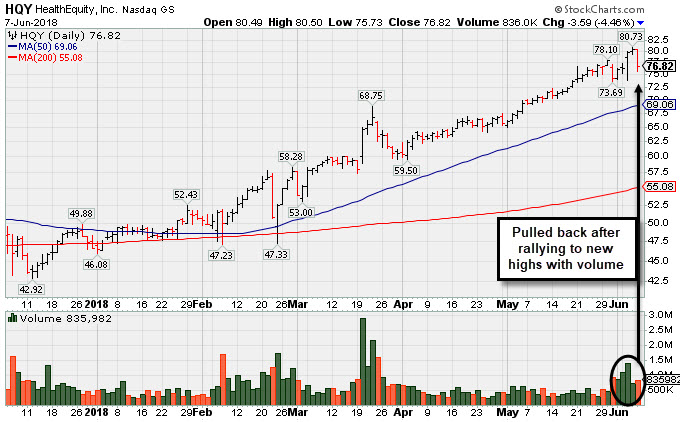
Pullback After Volume-Driven Gains For New Highs - Thursday, June 7, 2018
Healthequity Inc (HQY -$3.59 or -4.46% to $76.82) pulled back today following volume-driven gains for new all-time highs. It is very extended from any sound base. The prior high ($68.75 on 3/22/18) and its 50-day moving average (DMA) line ($69.06) define near term support to watch on pullbacks.
HQY was last shown in this FSU section on 4/25/18 with an annotated graph under the headline, " Perched Near All-Time High Building a Short New Base". It reported earnings +57% on +29% sales revenues for the Jan '18 quarter versus the year ago period, continuing its strong earnings track record. HQY's fundamentals remain strong, as the past 5 quarterly comparisons were above the +25% minimum earnings guideline (C criteria) and underpinned by strong sales revenues increases.
Members were previously reminded - "Disciplined investors always limit losses by selling any stock that falls more than -7% from their purchase price, knowing they can always buy back any stock if strength returns."It has managed a bumpy climb that may have shaken out many investors since triggering a technical buy signal with a gain above the new pivot point with +90% above average volume when highlighted in the 2/20/18 mid-day report (read here).
The number of top-rated funds owning its shares rose from 369 in Dec '16 to 438 in Mar '18, a reassuring sign concerning the I criteria. Its current Up/Down Volume Ratio of 2.5 is also an unbiased indication its shares have been under accumulation over the past 50 days. It has a fairly small supply of only 61.8 million shares (S criteria) outstanding, which can contribute to greater price volatility in the event of institutional buying or selling. It currently has a Timeliness Rating of A and a Sponsorship Rating of B.
The Commercial Services - Outsourcing industry group currently has a Group Relative Strength Rating of 79, and there are other strong leaders in the group hitting new highs, a reassuring sign concerning the L criteria. It completed its $14 IPO on 7/31/14 followed by an additional Public Offering on 5/05/15 and Secondary Offerings on both 10/20/16 and 9/23/15.
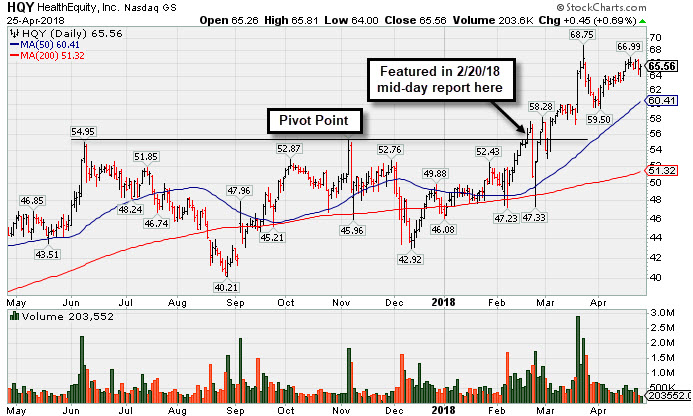
Perched Near All-Time High Building a Short New Base - Wednesday, April 25, 2018
Healthequity Inc (HQY +$0.45 or +0.69% to $65.56) has been hovering near its all-time high, and volume totals have cooled while building a short new base. Its 50-day moving average (DMA) line ($60.41) defines near term support above prior highs. HQY was last shown in this FSU section on 3/22/18 with an annotated graph under the headline, "Bullish Action Followed Latest Earnings Report".
It reported earnings +57% on +29% sales revenues for the Jan '18 quarter versus the year ago period, continuing its strong earnings track record. HQY's fundamentals remain strong, as the past 4 quarterly comparisons were above the +25% minimum earnings guideline (C criteria) and underpinned by strong sales revenues increases.
Members were previously reminded - "Disciplined investors always limit losses by selling any stock that falls more than -7% from their purchase price, knowing they can always buy back any stock if strength returns." It has managed a bumpy climb that may have shaken out many investors since triggering a technical buy signal with a gain above the new pivot point with +90% above average volume when highlighted in the 2/20/18 mid-day report (read here).
The number of top-rated funds owning its shares rose from 369 in Dec '16 to 421 in Mar '18, a reassuring sign concerning the I criteria. Its current Up/Down Volume Ratio of 2.9 is also an unbiased indication its shares have been under accumulation over the past 50 days. It has a fairly small supply of only 61 million shares (S criteria) outstanding, which can contribute to greater price volatility in the event of institutional buying or selling. It currently has a Timeliness Rating of A and a Sponsorship Rating of B.
The Commercial Services - Outsourcing industry group currently has a Group Relative Strength Rating of 70, however there are other strong leaders in the group hitting new highs, a reassuring sign concerning the L criteria. It completed its $14 IPO on 7/31/14 followed by an additional Public Offering on 5/05/15 and Secondary Offerings on both 10/20/16 and 9/23/15.
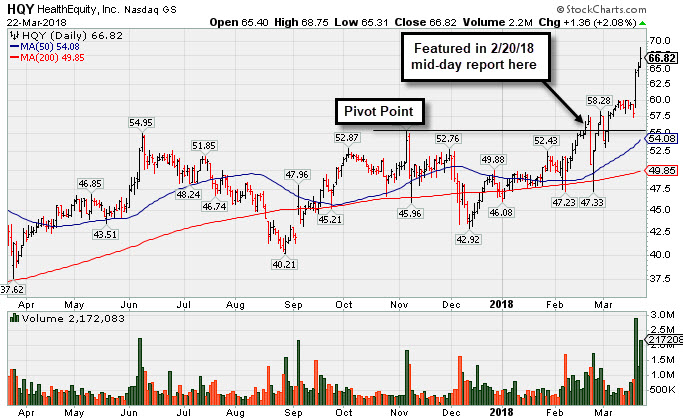
Bullish Action Followed Latest Earnings Report - Thursday, March 22, 2018
Healthequity Inc (HQY +$1.36 or +2.08% to $66.82) tallied a 3rd consecutive volume-driven gain hitting new all-time highs, getting very extended from any sound base. Prior highs in the $55 area define initial support along with its 50-day moving average (DMA) line.
Bullish action came after it reported earnings +57% on +29% sales revenues for the Jan '18 quarter versus the year ago period, continuing its strong earnings track record. HQY's fundamentals remain strong, as the past 4 quarterly comparisons were above the +25% minimum earnings guideline (C criteria) and underpinned by strong sales revenues increases.
Members were previously reminded - "Disciplined investors always limit losses by selling any stock that falls more than -7% from their purchase price, knowing they can always buy back any stock if strength returns." HQY was last shown in this FSU section on 2/21/18 with an annotated graph under the headline, "Fundamentals Remained Favorable and Strength Returned", as it hit a new high with a 9th consecutive gain. It triggered a technical buy signal with a gain above the new pivot point cited backed by +90% above average volume on the prior session when highlighted in the 2/20/18 mid-day report (read here).
The number of top-rated funds owning its shares rose from 369 in Dec '16 to 436 in Dec '17, a reassuring sign concerning the I criteria. Its current Up/Down Volume Ratio of 2.6 is also an unbiased indication its shares have been under accumulation over the past 50 days. It has a fairly small supply of only 60.7 million shares (S criteria) outstanding, which can contribute to greater price volatility in the event of institutional buying or selling. It currently has a Timeliness Rating of A and a Sponsorship Rating of C.
The Commercial Services - Outsourcing industry group currently has a Group Relative Strength Rating of 71, however there are other strong leaders in the group hitting new highs, a reassuring sign concerning the L criteria. It completed its $14 IPO on 7/31/14 followed by an additional Public Offering on 5/05/15 and Secondary Offerings on both 10/20/16 and 9/23/15.
Fundamentals Remained Favorable and Strength Returned - Wednesday, February 21, 2018
Healthequity Inc (HQY +$0.79 or +1.41% to $56.71) hit yet another new high with today's 9th consecutive gain. It triggered a technical buy signal with a gain above the new pivot point cited backed by +90% above average volume on the prior session when highlighted in the 2/20/18 mid-day report (read here). Disciplined investors always limit losses by selling any stock that falls more than -7% from their purchase price, knowing they can always buy back any stock if strength returns.
HQY's fundamentals remain strong, with earnings +70% on +31% sales revenues for the Oct '17 quarter. so the past 3 quarterly comparisons were above the +25% minimum earnings guideline (C criteria) and underpinned by strong sales revenues increases.
The number of top-rated funds owning its shares rose from 369 in Dec '16 to 441 in Dec '17, a reassuring sign concerning the I criteria. Its current Up/Down Volume Ratio of 2.5 is also an unbiased indication its shares have been under slight accumulation over the past 50 days. It has a fairly small supply of only 60.7 million shares (S criteria) outstanding, which can contribute to greater price volatility in the event of institutional buying or selling. It currently has a Timeliness Rating of A and a Sponsorship Rating of C.
The Commercial Services - Outsourcing industry group currently has a Group Relative Strength Rating of 52, however there are other strong leaders in the group hitting new highs, a reassuring sign concerning the L criteria. It completed its $14 IPO on 7/31/14 followed by an additional Public Offering on 5/05/15 and Secondary Offerings on both 10/20/16 and 9/23/15.
Sank Below 50-Day Moving Average With Loss on Higher Volume - Monday, December 4, 2017
Healthequity Inc (HQY -$2.60 or -5.05% to $48.86) slumped below its 50-day moving average (DMA) line ($50.47) with today's big loss on higher volume. An abrupt retreat back into the prior base raised concerns after a recent breakout. Disciplined investors always limit losses by selling any stock that falls more than -7% from their purchase price.
HQY was shown in this FSU section on 11/06/17 with an annotated graph under the headline, "Hit New High With Big Volume-Driven Gain". It was highlighted in yellow with new pivot point cited based on its 10/04/17 high in the 11/06/17 mid-day report (read here). It hit a new high with a considerable volume-driven gain triggering a technical buy signal.
Fundamentals remain strong as three of the past 4 quarterly comparisons through Jul '17 were above the +25% minimum earnings guideline (C criteria) and underpinned by strong sales revenues increases.
The number of top-rated funds owning its shares rose from 369 in Dec '16 to 442 in Sep '17, a reassuring sign concerning the I criteria. Its current Up/Down Volume Ratio of 1.2 is also an unbiased indication its shares have been under slight accumulation over the past 50 days. It has a fairly small supply of only 48.6 million shares (S criteria) outstanding, which can contribute to greater price volatility in the event of institutional buying or selling. It currently has a Timeliness Rating of B and a Sponsorship Rating of B.
The Commercial Services - Outsourcing industry group currently has a Group Relative Strength Rating of 69, however there are other strong leaders in the group hitting new highs, a reassuring sign concerning the L criteria. It completed its $14 IPO on 7/31/14 followed by an additional Public Offering on 5/05/15 and Secondary Offerings on both 10/20/16 and 9/23/15.
Hit New High With Big Volume-Driven Gain - Monday, November 6, 2017
Healthequity Inc (HQY +$3.15 or +6.20% to $53.96) was highlighted in yellow with new pivot point cited based on its 10/04/17 high in the earlier mid-day report (read here). It hit a new high with today's considerable volume-driven gain triggering a technical buy signal, and it faces no resistance due to overhead supply. Fundamentals remain strong as three of the past 4 quarterly comparisons through Jul '17 were above the +25% minimum earnings guideline (C criteria) and underpinned by strong sales revenues increases.
It tested and found support after rebounding above its 50-day moving average (DMA) line ($48.27) since last noted and dropped from the Featured Stocks list on 8/17/17. HQY was shown in this FSU section on 7/19/17 with an annotated graph under the headline, "50-Day Moving Average Violation Triggers Technical Sell Signal".
The number of top-rated funds owning its shares rose from 369 in Dec '16 to 426 in Sep '17, a reassuring sign concerning the I criteria. Its current Up/Down Volume Ratio of 1.5 is also an unbiased indication its shares have been under accumulation over the past 50 days. It has a fairly small supply of only 48.6 million shares (S criteria) outstanding, which can contribute to greater price volatility in the event of institutional buying or selling. It currently has a Timeliness Rating of B and a Sponsorship Rating of C.
The Commercial Services - Outsourcing industry group currently has a Group Relative Strength Rating of 73, however there are other strong leaders in the group hitting new highs, a reassuring sign concerning the L criteria. It completed its $14 IPO on 7/31/14 followed by an additional Public Offering on 5/05/15 and Secondary Offerings on both 10/20/16 and 9/23/15.
50-Day Moving Average Violation Triggers Technical Sell Signal - Wednesday, July 19, 2017
Healthequity Inc (HQY -$0.79 or -1.61% to $48.30) undercut prior highs in the $49 area and violated its 50-day moving average (DMA) line ($48.82) trigger technical sell signals with a loss on higher volume indicative of distributional pressure. Only a prompt rebound above the 50 DMA line would help its outlook improve.
HQY was last shown in this FSU section on 6/07/17 with an annotated graph under the headline, "High Volume Breakout Quickly Getting Extended". It was highlighted with a pivot point cited based on its 1/24/17 high plus 10 cents in the 6/07/17 mid-day report (read here). It reported earnings +27% on +26% sales revenues for the Apr '17 quarter, and 3 of the past 4 quarterly comparisons had earnings increases above the +25% minimum guideline (C criteria). It completed yet another Secondary Offering on 10/20/16. Completed its $14 IPO on 7/31/14 followed by an additional Public Offering on 5/05/15 and a Secondary Offering on 9/23/15.
The number of top-rated funds owning its shares rose from 337 in Sep '16 to 404 in Jun '17, a reassuring sign concerning the I criteria. Its current Up/Down Volume Ratio of 1.6 is also an unbiased indication its shares have been under accumulation over the past 50 days. It has a fairly small supply of only 48.6 million shares (S criteria) outstanding, which can contribute to greater price volatility in the event of institutional buying or selling. It currently has a Timeliness Rating of B and a Sponsorship Rating of B. The Commercial Services - Outsourcing industry group currently has a mediocre Group Relative Strength Rating of 58, however there are other strong leaders in the group hitting new highs, a reassuring sign concerning the L criteria.
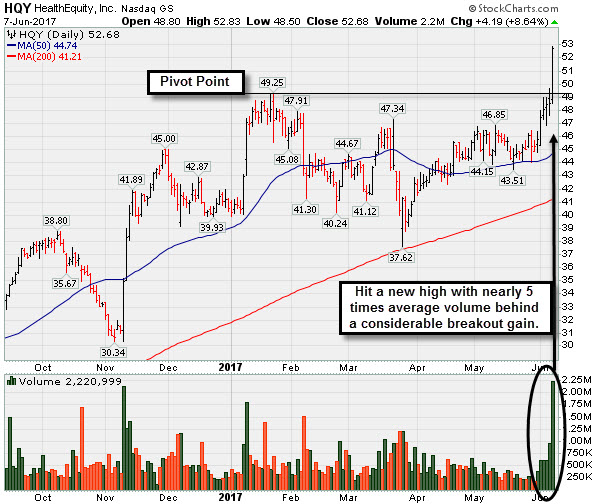
High Volume Breakout Quickly Getting Extended - Wednesday, June 7, 2017
Healthequity Inc (HQY +$4.19 or +8.64% to $52.68) finished strong after highlighted in yellow with a pivot point cited based on its 1/24/17 high plus 10 cents in the earlier mid-day report (read here). It hit a new high with today's 6th consecutive gain on ever-increasing volume. The strong close above the pivot point clinched a technical buy signal, however it is quickly getting extended from the proper buy range.
HQY found support recently at its 50-day moving average (DMA) line ($44.68). Reported earnings +27% on +26% sales revenues for the Apr '17 quarter, and 3 of the past 4 quarterly comparisons had earnings increases above the +25% minimum guideline (C criteria). Completed yet another Secondary Offering on 10/20/16. Completed its $14 IPO on 7/31/14 followed by an additional Public Offering on 5/05/15 and a Secondary Offering on 9/23/15.
The number of top-rated funds owning its shares has been on the rise, a reassuring sign concerning the I criteria. It has a fairly small supply of only 48.95 million shares (S criteria) outstanding, which can contribute to greater price volatility in the event of institutional buying or selling.