You are not logged in.
This means you
CAN ONLY VIEW reports that were published prior to Friday, April 18, 2025.
You
MUST UPGRADE YOUR MEMBERSHIP if you want to see any current reports.
AFTER MARKET UPDATE - THURSDAY, NOVEMBER 1ST, 2018
Previous After Market Report Next After Market Report >>>
|
|
|
|
DOW |
+264.98 |
25,380.74 |
+1.06% |
|
Volume |
1,033,447,430 |
-20% |
|
Volume |
2,661,057,080 |
-8% |
|
NASDAQ |
+128.16 |
7,434.06 |
+1.75% |
|
Advancers |
2,262 |
75% |
|
Advancers |
2,407 |
78% |
|
S&P 500 |
+28.63 |
2,740.37 |
+1.06% |
|
Decliners |
750 |
25% |
|
Decliners |
691 |
22% |
|
Russell 2000 |
+33.57 |
1,544.98 |
+2.22% |
|
52 Wk Highs |
28 |
|
|
52 Wk Highs |
40 |
|
|
S&P 600 |
+18.92 |
968.88 |
+1.99% |
|
52 Wk Lows |
75 |
|
|
52 Wk Lows |
80 |
|
|
 |
Major Indices Rose With Lighter Volume and
Kenneth J. Gruneisen - Passed the CAN SLIM® Master's Exam
Stocks finished higher Thursday. The Dow added 264 points to 25380 while the S&P 500 climbed 28 points to 2740. The Nasdaq Composite gained 128 points to 7434. The volume totals reported were lighter on the NYSE and on the Nasdaq exchange versus the prior session. Advancers led decliners by a 3-1 margin on the NYSE and by more than 3-1 on the Nasdaq exchange. There were 12 high-ranked companies from the Leaders List that made new 52-week highs and were listed on the BreakOuts Page, versus 13 on the prior session, as market leadership remained thin. New 52-week lows totals easily outnumbered new 52-week highs on the NYSE and Nasdaq exchange. Recent reports have noted that the major indices (M criteria) have shown action indicative of a market correction. The Featured Stocks Page provides the most timely analysis on high-ranked leaders. Charts used courtesy of www.stockcharts.com
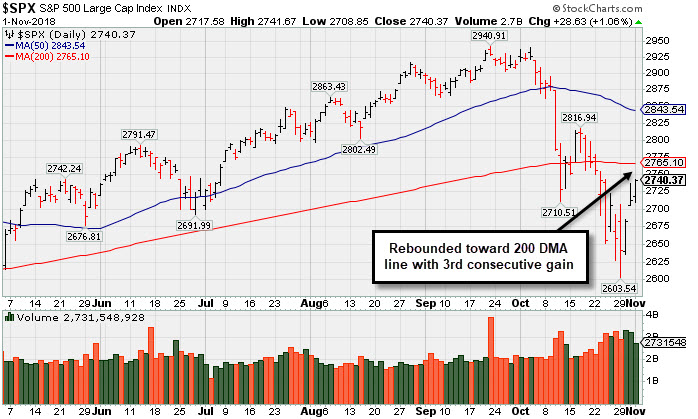
PICTURED: The S&P 500 Index and other major indices rose on Thursday, marking Day 3 of a new rally attempt. Technically, the market remains in a "correction" under the fact-based investment system. Members have been reminded repeatedly that new buying efforts are against the rules until a convincing follow-through day occurs. Between Day 4 and Day 7 investors should watch for a "follow-through day" of solid gains (at least +1%) from one or more of the major indices, backed by higher volume, and coupled with a leadership expansion (increase in new 52-week highs). All of the above are necessary elements required to confirm a new rally. Until then, patience and discipline are paramount.
The major averages advanced for the third consecutive session as investors digest a promising update on trade and a deluge of corporate earnings. In geopolitics, President Trump announced that he had encouraging discussions on trade with Chinese President Xi ahead of their meeting at the G-20 summit later this month. On the data front, an update from the Institute for Supply Management (ISM) showed manufacturing activity eased to a six-month low in October.
Materials paced gains as DowDuPont (DWDP +8.07%) rose after the chemical-maker topped earnings estimates and announced a $3 billion stock buyback program. Healthcare shares also outperformed as Teva Pharmaceuticals (TEVA +15.12%) rose after the drug maker topped Wall Street profit and sales forecasts. In other earnings news, AIG (AIG +4.43%) rose despite suffering significant catastrophe losses that led to a surprise quarterly loss. Amazon (AMZN +4.23%) rose. In other earnings, Allstate (ALL -6.01%) fell after the insurer fell short of earnings projections amid weaker than expect sales from its homeowner’s business unit.
Treasuries were little changed as the yield on the 10-year note slipped one basis point to 3.14%. In commodities, WTI crude declined 2.7% to $63.52/barrel, extending losses from October’s dismal performance, which saw oil prices fall 10.9%. COMEX gold added 1.7% to $1235.10/ounce amid a weaker dollar. |
 Kenneth J. Gruneisen started out as a licensed stockbroker in August 1987, a couple of months prior to the historic stock market crash that took the Dow Jones Industrial Average down -22.6% in a single day. He has published daily fact-based fundamental and technical analysis on high-ranked stocks online for two decades. Through FACTBASEDINVESTING.COM, Kenneth provides educational articles, news, market commentary, and other information regarding proven investment systems that work in good times and bad.
Comments contained in the body of this report are technical opinions only and are not necessarily those of Gruneisen Growth Corp. The material herein has been obtained from sources believed to be reliable and accurate, however, its accuracy and completeness cannot be guaranteed. Our firm, employees, and customers may effect transactions, including transactions contrary to any recommendation herein, or have positions in the securities mentioned herein or options with respect thereto. Any recommendation contained in this report may not be suitable for all investors and it is not to be deemed an offer or solicitation on our part with respect to the purchase or sale of any securities. |
|
 |
Tech, Retail; and Gold & Silver Indexes Posted Big Gains
Kenneth J. Gruneisen - Passed the CAN SLIM® Master's Exam
The tech sector clearly had a positive bias as the Biotech Index ($BTK +5.02%) and Semiconductor Index ($SOX +4.64%) outpaced the Networking Index ($NWX +2.39%). The Retail Index ($RLX +2.73%) outpaced the Broker/Dealer Index ($XBD +1.19%) and the Bank Index ($BKX +0.53%). Commodity-linked groups also rose as the Gold & Silver Index ($XAU +4.52%) outpaced the Integrated Oil Index ($XOI +0.56%) and the Oil Services Index ($OSX +0.94%).
Charts courtesy of www.stockcharts.com
 PICTURED: The Biotech Index ($BTK +5.02%) rebounded toward its 200-day moving average (DMA) line.
| Oil Services |
$OSX |
120.69 |
+1.13 |
+0.95% |
-19.30% |
| Integrated Oil |
$XOI |
1,367.18 |
+7.56 |
+0.56% |
+2.37% |
| Semiconductor |
$SOX |
1,258.08 |
+55.78 |
+4.64% |
+0.40% |
| Networking |
$NWX |
526.28 |
+12.27 |
+2.39% |
+7.29% |
| Broker/Dealer |
$XBD |
261.01 |
+3.07 |
+1.19% |
-1.59% |
| Retail |
$RLX |
2,148.03 |
+57.01 |
+2.73% |
+23.89% |
| Gold & Silver |
$XAU |
67.19 |
+2.91 |
+4.53% |
-21.20% |
| Bank |
$BKX |
99.42 |
+0.53 |
+0.54% |
-6.83% |
| Biotech |
$BTK |
4,771.11 |
+227.92 |
+5.02% |
+13.00% |
|
|
|
 |
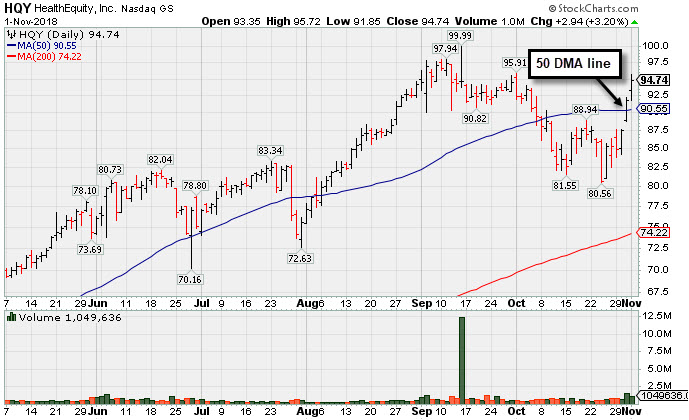
Rebound Above 50-Day Average Helped Outlook Improve
Kenneth J. Gruneisen - Passed the CAN SLIM® Master's Exam
Healthequity Inc (HQY +$2.82 or +3.07% to $94.62) gapped up on the prior session and posted another big gain today with above average volume, rebounding above the 50-day moving average (DMA) line ($90.55) and helping its outlook to improve. It faces some resistance due to overhead supply up to the $99 level. It found support near prior highs in the $82-83 area, but more damaging losses would raise serious concerns.
HQY was last shown in this FSU section on 10/16/18 with an annotated graph under the headline, "Below 50-Day Moving Average Which May Act as Resistance". It reported earnings +62% on +25% sales revenues for the Jul '18 quarter versus the year ago period, continuing its strong earnings track record. Fundamentals remain strong, as the past 7 quarterly comparisons were above the +25% minimum earnings guideline (C criteria) and underpinned by strong sales revenues increases.
It has managed a bumpy climb that may have shaken out many investors since triggering a technical buy signal with a gain above the new pivot point with +90% above average volume when highlighted in the 2/20/18 mid-day report (read here).
The number of top-rated funds owning its shares rose from 369 in Dec '16 to 528 in Sep '18, a reassuring sign concerning the I criteria. Its current Up/Down Volume Ratio of 1.8 is also an unbiased indication its shares have been under accumulation over the past 50 days. It has a fairly small supply of only 62.3 million shares (S criteria) outstanding, which can contribute to greater price volatility in the event of institutional buying or selling. It currently has a Timeliness Rating of A and a Sponsorship Rating of B.
The Commercial Services - Outsourcing industry group currently has a Group Relative Strength Rating of 63, however there are other strong leaders in the group hitting new highs, a reassuring sign concerning the L criteria. It completed its $14 IPO on 7/31/14 followed by an additional Public Offering on 5/05/15 and Secondary Offerings on both 10/20/16 and 9/23/15. |
|
|
Color Codes Explained :
Y - Better candidates highlighted by our
staff of experts.
G - Previously featured
in past reports as yellow but may no longer be buyable under the
guidelines.
***Last / Change / Volume data in this table is the closing quote data***
Symbol/Exchange
Company Name
Industry Group |
PRICE |
CHANGE
(%Change) |
Day High |
Volume
(% DAV)
(% 50 day avg vol) |
52 Wk Hi
% From Hi |
Featured
Date |
Price
Featured |
Pivot Featured |
|
Max Buy |
MPX
-
NYSE
Marine Products Corp
AUTOMOTIVE - Recreational Vehicles
|
$20.67
|
+0.30
1.47% |
$20.94
|
34,321
88.00% of 50 DAV
50 DAV is 39,000
|
$24.82
-16.72%
|
10/24/2018
|
$23.00
|
PP = $24.92
|
|
MB = $26.17
|
Most Recent Note - 10/31/2018 5:25:18 PM
G - Still sputtering below its 50 DMA line ($21.60). A rebound above the 50 DMA line is needed for its outlook to improve. Finished weak after highlighted in yellow with pivot point cited based on its 9/12/18 high plus 10 cents in the 10/24/18 mid-day report.
>>> FEATURED STOCK ARTICLE : Weak Finish Amid Widely Negative Market Environment - 10/24/2018 |
View all notes |
Set NEW NOTE alert |
Company Profile |
SEC
News |
Chart |
Request a new note
C
A
S
I |
GMED
-
NYSE
Globus Medical Inc Cl A
CHEMICALS - Specialty Chemicals
|
$54.12
|
+1.27
2.40% |
$54.28
|
594,439
90.48% of 50 DAV
50 DAV is 657,000
|
$57.55
-5.96%
|
9/26/2018
|
$56.11
|
PP = $57.65
|
|
MB = $60.53
|
 Most Recent Note - 11/1/2018 10:19:33 AM
G - Consolidating near its 50 DMA line ($52.98). Subsequent gains above the pivot point backed by more than +40% above average volume are needed to trigger a proper technical buy signal.
>>> FEATURED STOCK ARTICLE : Consolidating After Rally at 200-Day Moving Average Line - 10/22/2018 |
View all notes |
Set NEW NOTE alert |
Company Profile |
SEC
News |
Chart |
Request a new note
C
A
S
I |
ZBRA
-
NASDAQ
Zebra Tech Corp Cl A
COMPUTER HARDWARE - Computer Peripherals
|
$169.00
|
+2.70
1.62% |
$169.84
|
521,166
135.02% of 50 DAV
50 DAV is 386,000
|
$179.47
-5.83%
|
8/7/2018
|
$164.26
|
PP = $161.82
|
|
MB = $169.91
|
Most Recent Note - 10/30/2018 5:12:03 PM
G - Rebounded toward its 50 DMA line ($168). Overhead supply remains up to the $179 level. Found support in recent weeks after a pullback near its 200 DMA line.
>>> FEATURED STOCK ARTICLE : Zebra Tech Sputtering Near 50-Day Moving Average - 10/23/2018 |
View all notes |
Set NEW NOTE alert |
Company Profile |
SEC
News |
Chart |
Request a new note
C
A
S
I |
CME
-
NASDAQ
C M E Group Inc
DIVERSIFIED SERVICES - Business/Management Services
|
$183.75
|
+0.51
0.28% |
$186.59
|
3,363,971
218.72% of 50 DAV
50 DAV is 1,538,000
|
$185.11
-0.73%
|
10/4/2018
|
$179.29
|
PP = $177.45
|
|
MB = $186.32
|
Most Recent Note - 11/1/2018 5:07:27 PM
Y - Touched another new all-time high with today's 5th consecutive small gain. Found support above its 50 DMA line ($175) after recently reporting earnings +22% on +2% sales revenues for the Sep '18 quarter, below the +25% minimum earnings guideline (C criteria), raising fundamental concerns. Broad market weakness (M criteria) is also a serious concern. The 50 DMA line and prior low ($170.04 on 9/28/18) define important near-term support.
>>> FEATURED STOCK ARTICLE : Perched Near High After Latest Earnings Report Below +25% Minimum - 10/26/2018 |
View all notes |
Set NEW NOTE alert |
Company Profile |
SEC
News |
Chart |
Request a new note
C
A
S
I |
DPZ
-
NYSE
Dominos Pizza Inc
Retail-Restaurants
|
$266.05
|
-2.74
-1.02% |
$269.84
|
505,977
87.54% of 50 DAV
50 DAV is 578,000
|
$305.34
-12.87%
|
8/13/2018
|
$288.60
|
PP = $293.91
|
|
MB = $308.61
|
Most Recent Note - 10/31/2018 5:21:22 PM
G - Posted a 2nd consecutive gain after finding support at its 200 DMA line. A subsequent rebound above the 50 DMA line is needed for its outlook to improve. The prior low ($253.63 on 7/31/18) and 200 DMA line define important near-term support to watch. Reported earnings +54% on +22% sales revenues for the Sep '18 quarter, continuing its strong earnings track record. See the latest FSU analysis for more details and a new annotated graph.
>>> FEATURED STOCK ARTICLE : Found Support at 200-Day Moving Average Line - 10/31/2018 |
View all notes |
Set NEW NOTE alert |
Company Profile |
SEC
News |
Chart |
Request a new note
C
A
S
I |
Symbol/Exchange
Company Name
Industry Group |
PRICE |
CHANGE
(%Change) |
Day High |
Volume
(% DAV)
(% 50 day avg vol) |
52 Wk Hi
% From Hi |
Featured
Date |
Price
Featured |
Pivot Featured |
|
Max Buy |
FIVE
-
NASDAQ
Five Below Inc
Retail-DiscountandVariety
|
$120.31
|
+6.49
5.70% |
$121.83
|
1,190,135
122.95% of 50 DAV
50 DAV is 968,000
|
$136.13
-11.62%
|
7/6/2018
|
$98.90
|
PP = $104.09
|
|
MB = $109.29
|
Most Recent Note - 11/1/2018 10:17:14 AM
G - Halted its slide near the prior high ($109.09 on 7/19/18), however a rebound above the 50 DMA line ($120) still is needed for its outlook to improve. More damaging losses would raise greater concerns.
>>> FEATURED STOCK ARTICLE : Sputtering Below 50-Day Moving Average Near Prior High - 10/25/2018 |
View all notes |
Set NEW NOTE alert |
Company Profile |
SEC
News |
Chart |
Request a new note
C
A
S
I |
HQY
-
NASDAQ
Healthequity Inc
COMPUTER SOFTWARE and SERVICES - Healthcare Information Service
|
$94.74
|
+2.94
3.20% |
$95.72
|
1,054,211
122.44% of 50 DAV
50 DAV is 861,000
|
$99.99
-5.25%
|
8/13/2018
|
$82.39
|
PP = $83.44
|
|
MB = $87.61
|
Most Recent Note - 11/1/2018 5:06:09 PM
G - Posted another big gain with above average volume, rebounding further above the 50 DMA line ($90.55) and helping its outlook to improve. Faces some resistance due to overhead supply up to the $99 level. See the latest FSU analysis for more details and a new annotated graph.
>>> FEATURED STOCK ARTICLE : Rebound Above 50-Day Average Helped Outlook Improve - 11/1/2018 |
View all notes |
Set NEW NOTE alert |
Company Profile |
SEC
News |
Chart |
Request a new note
C
A
S
I |
OLLI
-
NASDAQ
Ollie's Bargain Outlet
Retail-DiscountandVariety
|
$92.19
|
-0.71
-0.76% |
$93.94
|
567,899
84.38% of 50 DAV
50 DAV is 673,000
|
$97.61
-5.55%
|
7/12/2018
|
$74.43
|
PP = $77.60
|
|
MB = $81.48
|
Most Recent Note - 10/30/2018 5:14:09 PM
G - Found support near the 50 DMA line ($89.28). The recent low ($84.66 on 10/11/18) defines the next important support to watch. Fundamentals remain strong. See the latest FSU analysis for more details and a new annotated graph.
>>> FEATURED STOCK ARTICLE : Finding Support Near its 50-Day Moving Average - 10/30/2018 |
View all notes |
Set NEW NOTE alert |
Company Profile |
SEC
News |
Chart |
Request a new note
C
A
S
I |
|
|
|
THESE ARE NOT BUY RECOMMENDATIONS!
Comments contained in the body of this report are technical
opinions only. The material herein has been obtained
from sources believed to be reliable and accurate, however,
its accuracy and completeness cannot be guaranteed.
This site is not an investment advisor, hence it does
not endorse or recommend any securities or other investments.
Any recommendation contained in this report may not
be suitable for all investors and it is not to be deemed
an offer or solicitation on our part with respect to
the purchase or sale of any securities. All trademarks,
service marks and trade names appearing in this report
are the property of their respective owners, and are
likewise used for identification purposes only.
This report is a service available
only to active Paid Premium Members.
You may opt-out of receiving report notifications
at any time. Questions or comments may be submitted
by writing to Premium Membership Services 665 S.E. 10 Street, Suite 201 Deerfield Beach, FL 33441-5634 or by calling 1-800-965-8307
or 954-785-1121.
|
|
|