Sputtering Below 50-Day Moving Average Line Again - Monday, March 6, 2023
Commercial Metals Co (CMC -$2.13 or -3.92% to $52.16) pulled back today after 3 consecutive volume-driven gains, slumping back below its 50-day moving average (DMA) line ($53.23) and hurting its outlook again. The recent low ($50.90 on 2/24/23) defines the next important near-term support where any more damaging losses would raise greater concerns.
Fundamentals remain strong. CMC has a highest possible 99 Earnings Per Share Rating. It reported Nov '22 quarterly earnings +38% on +12% sales revenues versus the year ago period and prior quarterly comparisons were well above the +25% minimum earnings guideline (C criteria) of the fact-based investment system. Annual earnings growth has been strong. It hails from the Metal Proc & Fabrication group which is currently ranked 23rd on the 197 Industry Groups list (L criteria).
CMC was highlighted in yellow with pivot point cited based on its 8/11/22 high plus 10 cents in the 10/14/22 mid-day report (read here). It was last shown in this FSU section on 2/06/23 with an annotated graph under the headline, "Metals Firm Extended From Base and Perched Near High".
The company has 117.1 million shares outstanding (S criteria). The number of top-rated funds owning its shares rose from 586 in Dec '21 to 670 in Dec '22, a reassuring sign concerning the I criteria. Its current Up/Down Volume Ratio of 1.2 is an unbiased indication its shares have been under accumulation over the past 50 days. It has a Timeliness Rating of A and a Sponsorship Rating of A.

Metals Firm Extended From Base and Perched Near High - Monday, February 6, 2023
Commercial Metals Co (CMC -$0.63 or -1.11% to $55.94) pulled back today following 4 consecutive gains. It is extended from any sound base. Its 50-day moving average (DMA) line ($50.91) defines important near-term support to watch on pullbacks.
Fundamentals remain strong. CMC has a highest possible 99 Earnings Per Share Rating. It reported Nov '22 quarterly earnings +38% on +12% sales revenues versus the year ago period and prior quarterly comparisons were well above the +25% minimum earnings guideline (C criteria) of the fact-based investment system. Annual earnings growth has been strong. It hails from the Metal Proc & Fabrication group which is currently ranked 51st on the 197 Industry Groups list (L criteria).
Fundamentals remain strong. CMC has a highest possible 99 Earnings Per Share Rating. It reported Nov '22 quarterly earnings +38% on +12% sales revenues versus the year ago period and prior quarterly comparisons were well above the +25% minimum earnings guideline (C criteria) of the fact-based investment system. Annual earnings growth has been strong. It hails from the Metal Proc & Fabrication group which is currently ranked 51st on the 197 Industry Groups list (L criteria).
CMC was highlighted in yellow with pivot point cited based on its 8/11/22 high plus 10 cents in the 10/14/22 mid-day report (read here). It was last shown in this FSU section on 1/18/23 with an annotated graph under the headline, "Pulling Back After Rallying From 50-Day Moving Average Line".
The company has 117.1 million shares outstanding (S criteria). The number of top-rated funds owning its shares rose from 586 in Dec '21 to 655 in Dec '22. Its current Up/Down Volume Ratio of 1.4 is an unbiased indication its shares have been under accumulation over the past 50 days. It has a Timeliness Rating of A and a Sponsorship Rating of A.

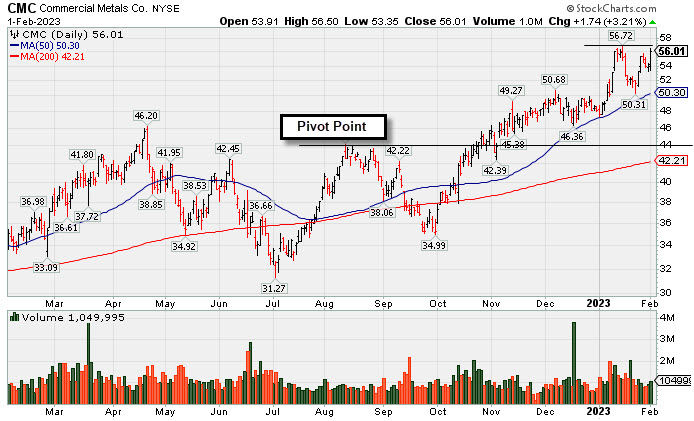
Extended From Any Sound Base and Perched Near High - Wednesday, February 1, 2023
Commercial Metals Co (CMC +$1.74 or +3.21% to $56.01) posted a gain with average volume and closed 16 cents off its best ever close. It is extended from an sound base. It has been consolidating above its 50-day moving average (DMA) line ($50.41) which defines important near-term support to watch on pullbacks. Fundamentals remain strong.
CMC has a highest possible 99 Earnings Per Share Rating. It reported Nov '22 quarterly earnings +38% on +12% sales revenues versus the year ago period and prior quarterly comparisons were well above the +25% minimum earnings guideline (C criteria) of the fact-based investment system. Annual earnings growth has been strong. It hails from the Metal Proc & Fabrication group which is currently ranked 53rd on the 197 Industry Groups list (L criteria).
CMC was highlighted in yellow with pivot point cited based on its 8/11/22 high plus 10 cents in the 10/14/22 mid-day report (read here). It was last shown in this FSU section on 1/18/23 with an annotated graph under the headline, "Pulling Back After Rallying From 50-Day Moving Average Line".
The company has 117.1 million shares outstanding (S criteria). The number of top-rated funds owning its shares rose from 586 in Dec '21 to 650 in Dec '22. Its current Up/Down Volume Ratio of 1.2 is an unbiased indication its shares have been under accumulation over the past 50 days. It has a Timeliness Rating of A and a Sponsorship Rating of B.
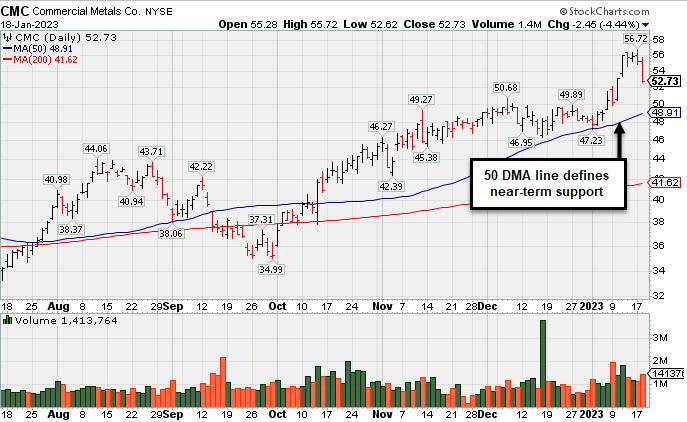
Pulling Back After Rallying From 50-Day Moving Average Line - Wednesday, January 18, 2023
Commercial Metals Co (CMC -$2.45 or -4.44% to $52.73) pulled back today with higher volume following a "negative reversal" on the prior session after hitting a new 52-week high. Its 50-day moving average (DMA) line ($49.05) defines important near-term support to watch on pullbacks. Fundamentals remain strong.
CMC has a highest possible 99 Earnings Per Share Rating. It reported Nov '22 quarterly earnings +38% on +12% sales revenues versus the year ago period and prior quarterly comparisons were well above the +25% minimum earnings guideline (C criteria) of the fact-based investment system. Annual earnings growth has been strong. It hails from the Metal Proc & Fabrication group which is currently ranked 26th on the 197 Industry Groups list (L criteria).
CMC was highlighted in yellow with pivot point cited based on its 8/11/22 high plus 10 cents in the 10/14/22 mid-day report (read here). It was last shown in this FSU section on 1/03/23 with an annotated graph under the headline, "Consolidating Above 50-Day Moving Average Line and Prior High".
The company has 117.3 million shares outstanding (S criteria). The number of top-rated funds owning its shares rose from 586 in Dec '21 to 650 in Dec '22. Its current Up/Down Volume Ratio of 1.5 is an unbiased indication its shares have been under accumulation over the past 50 days. It has a Timeliness Rating of A and a Sponsorship Rating of B.
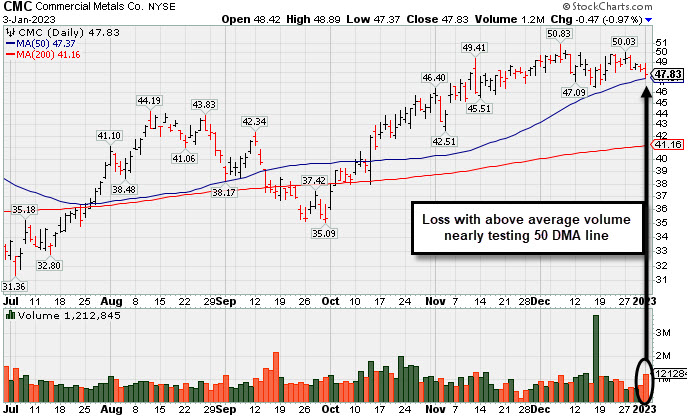
Consolidating Above 50-Day Moving Average Line and Prior High - Tuesday, January 3, 2023
Commercial Metals Co (CMC-$0.47 or -0.97% to $47.83) suffered a loss today while volume was +23% above average. It pulled back to just above its 50-day moving average (DMA) line ($47.38) and prior highs in the $46 area defining important near-term support to watch. Fundamentals remain strong.
CMC has a highest possible 99 Earnings Per Share Rating. It reported Aug '22 quarterly earnings +94% on +19% sales revenues versus the year ago period and prior quarterly comparisons were well above the +25% minimum earnings guideline (C criteria) of the fact-based investment system. Annual earnings growth has been strong. It hails from the Metal Proc & Fabrication group which is currently ranked 25th on the 197 Industry Groups list (L criteria).
CMC was highlighted in yellow with pivot point cited based on its 8/11/22 high plus 10 cents in the 10/14/22 mid-day report (read here). It was last shown in this FSU section on 12/02/22 with an annotated graph under the headline, "Wedging Higher With Recent Gains Lacking Great Volume".
The company has 117.3 million shares outstanding (S criteria). The number of top-rated funds owning its shares rose from 586 in Dec '21 to 631 in Sep '22. Its current Up/Down Volume Ratio of 2.1 is an unbiased indication its shares have been under accumulation over the past 50 days. It has a Timeliness Rating of A and a Sponsorship Rating of B.
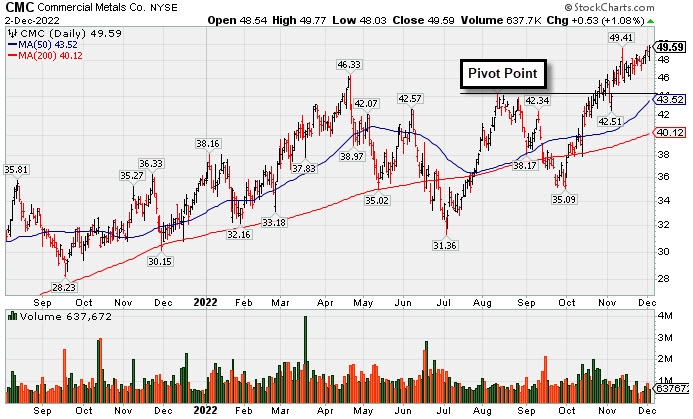
Wedging Higher With Recent Gains Lacking Great Volume - Friday, December 2, 2022
Commercial Metals Co (CMC +$0.53 or +1.08% to $49.59) quietly wedged to another new high today with below average volume. Fundamentals remain strong. Prior highs in the $46-44 area define initial support to watch above its 50-day moving average (DMA) line ($43.59). Recent gains have lacked the volume necessary to provide a very reassuring sign of fresh institutional buying demand. However, it has posted 9 consecutive weekly gains, which suggests it has been attracting persistent buying interest.
Recently CMC reported Aug '22 quarterly earnings +94% on +19% sales revenues versus the year ago period and prior quarterly comparisons were well above the +25% minimum earnings guideline (C criteria) of the fact-based investment system. Annual earnings growth has been strong. It hails from the Metal Proc & Fabrication group which is currently ranked 32nd on the 197 Industry Groups list (L criteria).
CMC was highlighted in yellow with pivot point cited based on its 8/11/22 high plus 10 cents in the 10/14/22 mid-day report (read here). It was last shown in this FSU section on 10/14/22 with an annotated graph under the headline, "Steel/Metal Products Firm Quietly Perched Near All Time High".
The company has 117.3 million shares outstanding (S criteria). The number of top-rated funds owning its shares rose from 586 in Dec '21 to 630 in Sep '22. Its current Up/Down Volume Ratio of 1.7 is an unbiased indication its shares have been under accumulation over the past 50 days. It has a Timeliness Rating of A and a Sponsorship Rating of B.
Steel/Metal Products Firm Quietly Perched Near All Time High - Monday, November 7, 2022
Commercial Metals Co (CMC -$0.14 or -0.31% to $45.70) ended with a small loss on light volume today. On the prior session with lighter than average volume it just touched a new 52-week high. Recent gains have lacked volume as it has been wedging upward. Additional volume-driven gains would be a reassuring sign of fresh institutional buying demand lurking.
Recently CMC reported Aug '22 quarterly earnings +94% on +19% sales revenues versus the year ago period and prior quarterly comparisons were well above the +25% minimum earnings guideline (C criteria) of the fact-based investment system. Annual earnings growth has been strong. It hails from the Metal Proc & Fabrication group which is currently ranked 24th on the 197 Industry Groups list (L criteria).
Recently CMC reported Aug '22 quarterly earnings +94% on +19% sales revenues versus the year ago period and prior quarterly comparisons were well above the +25% minimum earnings guideline (C criteria) of the fact-based investment system. Annual earnings growth has been strong. It hails from the Metal Proc & Fabrication group which is currently ranked 24th on the 197 Industry Groups list (L criteria).
CMC was highlighted in yellow with pivot point cited based on its 8/11/22 high plus 10 cents in the earlier mid-day report (read here). It was last shown in this FSU section on 10/14/22 with an annotated graph under the headline, "Little Resistance Remains for Strong Steel/Metal Products Firm".
The company has 117.3 million shares outstanding (S criteria). The number of top-rated funds owning its shares rose from 586 in Dec '21 to 628 in Sep '22. Its current Up/Down Volume Ratio of 1.1 is an unbiased indication its shares have been under slight accumulation over the past 50 days. It has a Timeliness Rating of A and a Sponsorship Rating of B.

Little Resistance Remains for Strong Steel/Metal Products Firm - Friday, October 14, 2022
Commercial Metals Co (CMC -$0.83 or -1.97% to $41.22) finished the day lower after highlighted in yellow with pivot point cited based on its 8/11/22 high plus 10 cents in the earlier mid-day report (read here). Subsequent gains above the pivot point backed by at least +40% above average volume may trigger a technical buy signal. It rebounded above its 50 and 200 DMA lines with recent volume-driven gains and faces little resistance due to overhead supply up to the $46 level. However, members are again reminded - The market is in a correction (M criteria) and disciplined investors know to avoid new buying efforts until a new rally confirmed with a follow-through day.
CMC reported Aug '22 quarterly earnings +94% on +19% sales revenues versus the year ago period and prior quarterly comparisons were well above the +25% minimum earnings guideline (C criteria) of the fact-based investment system. Annual earnings growth has been strong. It hails from the Metal Proc & Fabrication group which is currently ranked 24th on the 197 Industry Groups list (L criteria).
The company has 120.5 million shares outstanding (S criteria). The number of top-rated funds owning its shares rose from 586 in Dec '21 to 626 in Sep '22. However, its current Up/Down Volume Ratio of 0.8 is an unbiased indication its shares have been under some distributional pressure over the past 50 days. It has a Timeliness Rating of A and a Sponsorship Rating of B.
