Violation of 50-Day Moving Average Triggered Technical Sell Signal - Wednesday, January 5, 2022
AMD Pulling Back After Considerable Rally - Wednesday, December 1, 2021
Encountered Distributional Pressure After Reaching New High - Wednesday, October 27, 2021
Close Above 50-Day Moving Average But Relative Strength a Concern - Wednesday, February 10, 2021
Distributional Pressure Brings Pullback Below "Max Buy" Level - Wednesday, January 13, 2021
Pulling Back From its Record High Hit Last Week - Monday, December 21, 2020
Volume Heavy Behind AMD's Breakout from Double Bottom Base - Monday, November 30, 2020
Weak Action Raised Concern While Testing Recent Low - Tuesday, November 3, 2020
Consolidating Just Above 50-Day Moving Average - Wednesday, October 14, 2020
Rebound Above 50-Day Average With Light Volume Helped Stance - Monday, September 28, 2020
Found Support Above 50 DMA Line After Negating Recent Breakout - Tuesday, September 15, 2020
Perched at All-Time High After Another Bullish Breakout - Wednesday, September 2, 2020
AMD Rose +46% Since First Featured on June 9th - Friday, August 14, 2020
Pullback After Breakout Gain Backed by +152% Above Average Volume - Thursday, July 23, 2020
Slump Below 50-Day Average Toward Prior Low Raises Concerns - Friday, June 26, 2020
Big Chip Firm Showing Strong Sales Revenues and Earnings Increases - Tuesday, June 9, 2020
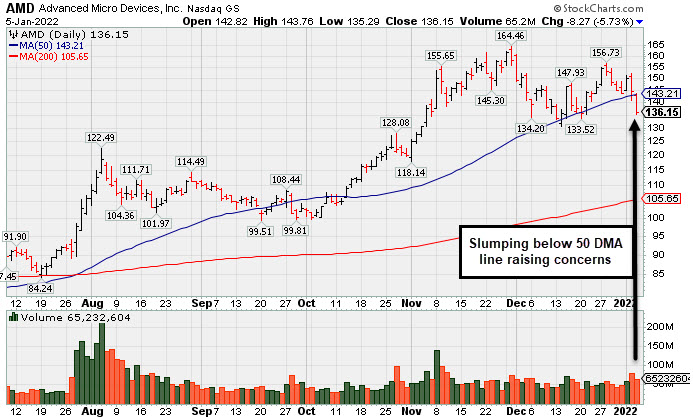
Violation of 50-Day Moving Average Triggered Technical Sell Signal - Wednesday, January 5, 2022
Advanced Micro Devices (AMD -$8.27 or -5.73% to $136.15) suffered a 2nd consecutive big loss today while slumping below its 50-day moving average (DMA) line ($143.21) which recently acted as support. The damaging violation triggered a technical sell signal. Only a prompt rebound above the 50 DMA line would help its outlook improve. The prior low ($130.60 on 12/14/21) defines the next important chart support level to watch. Its current Relative Strength rating of 97 is still well above the 80+ minimum guideline for buy candidates.
Fundamentals remain strong after it reported Sep '21 quarterly earnings +78% on +54% sales revenues versus the year ago period, extending its impressive streak of quarterly comparisons with very strong earnings increases well above the +25% minimum guideline (C criteria) with strong underlying sales revenues growth. Annual earnings growth (A criteria) has been very strong after losses in FY '15 and '16. it has a 99 Earnings Per Share Rating.
AMD was highlighted in yellow with pivot point cited based on its 8/04/21 high plus 10 cents in the 10/27/21 mid-day report (read here). It was last shown in this FSU section on 12/01/21 with an annotated graph under the headline, "AMD Pulling Back After Considerable Rally". AMD traded up +196.8% since highlighted in yellow in the 6/09/20 mid-day report (read here).
AMD hails from the Electronics - Semiconductor Fabless industry which has a Group Relative Strength Rating of 99 (L criteria). It has a large supply of 1.21 billion shares outstanding (S criteria), which makes it less likely to be a quick sprinter. However, the number of top-rated funds owning its shares rose from 1,669 in Jun '19 to 2,920 in Sep '21, a reassuring sign concerning the I criteria. Its current Up/Down Volume Ratio of 0.9 is an unbiased indication its shares have been under slight distributional pressure over the past 50 days. It has a Timeliness Rating of A, a Sponsorship Rating of B, and an Accumulation/Distribution rating of C+.
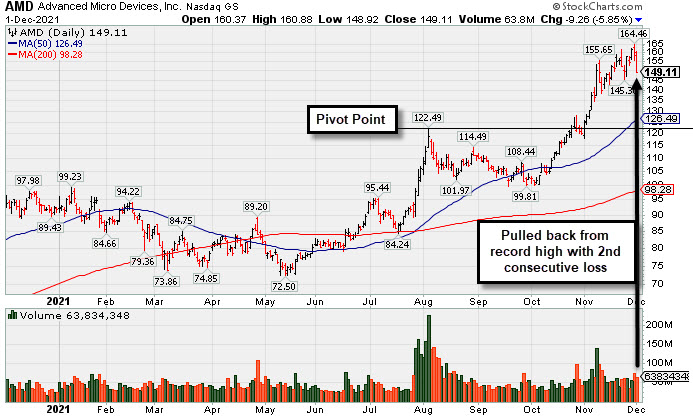
AMD Pulling Back After Considerable Rally - Wednesday, December 1, 2021
Advanced Micro Devices (AMD -$9.26 or -5.85% to $149.11) suffered a 2nd big volume-driven loss today, abruptly retreating from record high territory. It is very extended from the previously noted base. Its 50-day moving average (DMA) line ($126.49) and prior high in the $122 area define important support to watch. Its current Relative Strength rating of 97 is above the 80+ minimum guideline for buy candidates.
Fundamentals remain strong after it reported Sep '21 quarterly earnings +78% on +54% sales revenues versus the year ago period, extending its impressive streak of quarterly comparisons with very strong earnings increases well above the +25% minimum guideline (C criteria) with strong underlying sales revenues growth. Annual earnings growth (A criteria) has been very strong after losses in FY '15 and '16. it has a 99 Earnings Per Share Rating.
AMD was highlighted in yellow with pivot point cited based on its 8/04/21 high plus 10 cents in the 10/27/21 mid-day report (read here) and shown in this FSU section that evening with an annotated graph under the headline, "Encountered Distributional Pressure After Reaching New High". AMD traded up +196.8% since highlighted in yellow in the 6/09/20 mid-day report (read here).
AMD hails from the Electronics - Semiconductor Fabless industry which has a Group Relative Strength Rating of 99 (L criteria). It has a large supply of 1.21 billion shares outstanding (S criteria), which makes it less likely to be a quick sprinter. However, the number of top-rated funds owning its shares rose from 1,669 in Jun '19 to 2,772 in Sep '21, a reassuring sign concerning the I criteria. Its current Up/Down Volume Ratio of 1.4 is an unbiased indication its shares have been under accumulation over the past 50 days. It has a Timeliness Rating of A, a Sponsorship Rating of B, and an Accumulation/Distribution rating of B.
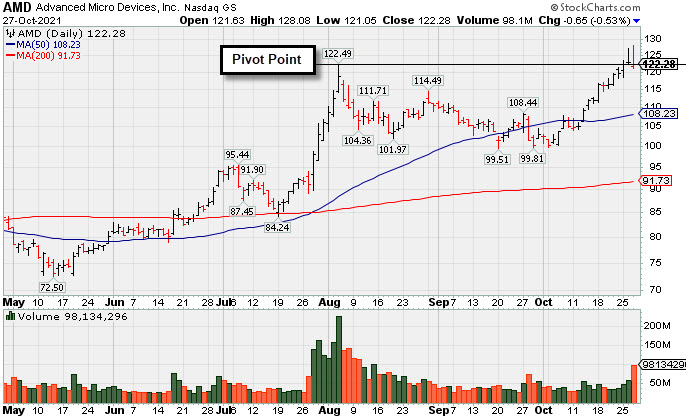
Encountered Distributional Pressure After Reaching New High - Wednesday, October 27, 2021
Advanced Micro Devices (AMD -$0.65 or -0.53% to $122.28) had a "negative reversal" and ended lower today after it was highlighted in yellow with pivot point cited based on its 8/04/21 high plus 10 cents in the earlier mid-day report (read here) . It rallied to new all-time highs with prior gains triggering a technical buy signal. AMD found support near prior highs in the $99 area during its consolidation since last noted in the 8/24/21 mid-day report. Its current Relative Strength rating of 90 is above the 80+ minimum guideline for buy candidates.
Fundamentals remain strong after it reported Sep '21 quarterly earnings +78% on +54% sales revenues versus the year ago period, extending its impressive streak of quarterly comparisons with very strong earnings increases well above the +25% minimum guideline (C criteria) with strong underlying sales revenues growth. Annual earnings growth (A criteria) has been very strong after losses in FY '15 and '16. it has a 98 Earnings Per Share Rating.
AMD hails from the Electronics - Semiconductor Fabless industry which has a Group Relative Strength Rating of 98 (L criteria). It has a large supply of 1.21 billion shares outstanding (S criteria), which makes it less likely to be a quick sprinter. However, the number of top-rated funds owning its shares rose from 1,669 in Jun '19 to 2,715 in Sep '21, a reassuring sign concerning the I criteria. Its current Up/Down Volume Ratio of 1.2 is an unbiased indication its shares have been under accumulation over the past 50 days. It has a Timeliness Rating of A, a Sponsorship Rating of B, and an Accumulation/Distribution rating of B+.
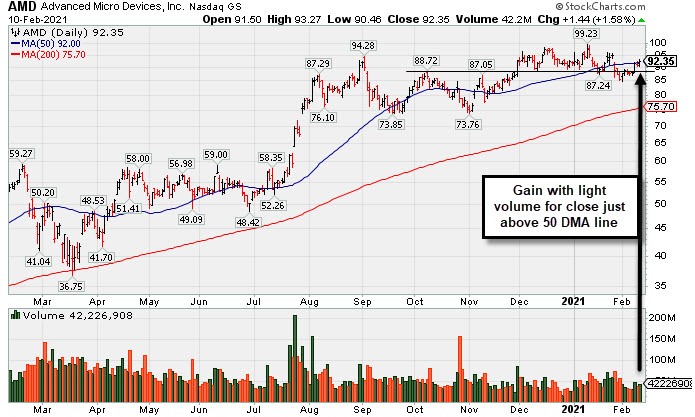
Close Above 50-Day Moving Average But Relative Strength a Concern - Wednesday, February 10, 2021
Advanced Micro Devices (AMD +$1.44 or +1.58% to $92.35) posted a small gain today with lighter than average volume. It closed above its 50-day moving average (DMA) line ($92.00) which has recently been acting as resistance. Its current Relative Strength rating of 66 is still below the 80+ minimum guideline for buy candidates. Fundamentals remain strong after it reported Dec '20 quarterly earnings +63% on +53% sales revenues versus the year ago period.
Earnings rose +63% on +53% sales revenues for the Dec '20 quarter versus the year ago period, extending its impressive streak of quarterly comparisons with very strong earnings increases well above the +25% minimum guideline (C criteria) with strong underlying sales revenues growth. Annual earnings growth (A criteria) has been very strong after losses in FY '15 and '16. it has a 98 Earnings Per Share Rating.
AMD hails from the Electronics - Semiconductor Fabless industry which has a Group Relative Strength Rating of 49 (L criteria). It has a large supply of 1.21 billion shares outstanding (S criteria), which makes it less likely to be a quick sprinter. However, the number of top-rated funds owning its shares rose from 1,669 in Jun '19 to 2,456 in Dec '20, a reassuring sign concerning the I criteria. Its current Up/Down Volume Ratio of 0.9 is an unbiased indication its shares have been under slight distributional pressure over the past 50 days. It has a Timeliness Rating of B, a Sponsorship Rating of B, and an Accumulation/Distribution rating of C+.
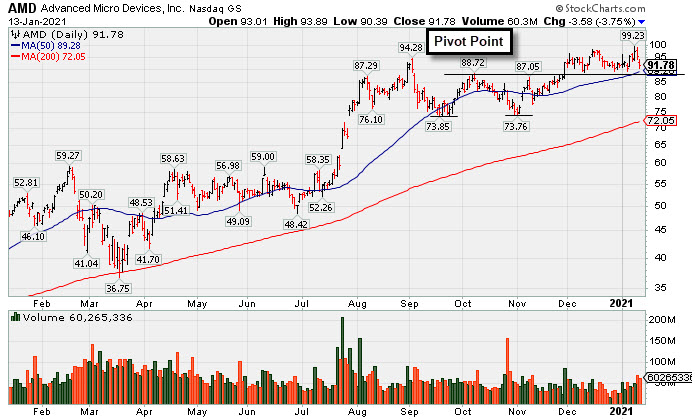
Distributional Pressure Brings Pullback Below "Max Buy" Level - Wednesday, January 13, 2021
Advanced Micro Devices (AMD -$3.58 or -3.75% to $91.78) encountered distributional pressure with today's 2nd consecutive volume-driven loss after wedging to touch a new all-time high with unimpressive volume behind gains. Its color code was changed to yellow after pulling back below its "max buy" level. Recent lows in the $89 area and its 50-day moving average (DMA) line ($89.28) coincide defining important near term support to watch.
It reported earnings +128% on +56% sales revenues for the Sep '20 quarter versus the year ago period and announced plans to acquire Xilinx Inc (XLNX). The 5 latest quarterly comparisons through Sep '20 showed very strong earnings increases w ell above the +25% minimum guideline (C criteria) with strong underlying sales revenues growth versus the year ago periods. Annual earnings growth (A criteria) has been very strong after losses in FY '15 and '16. it has a highest possible 99 Earnings Per Share Rating.
AMD hails from the Electronics - Semiconductor Fabless industry which has a Group Relative Strength Rating of 59 (L criteria). It has a large supply of 1.20 billion shares outstanding (S criteria), which makes it less likely to be a quick sprinter. However, the number of top-rated funds owning its shares rose from 1,669 in Jun '19 to 2,382 in Sep '20, a reassuring sign concerning the I criteria. Its current Up/Down Volume Ratio of 1.0 is an unbiased indication its shares have been neutral concerning accumulation/distribution over the past 50 days. It has a Timeliness Rating of B, a Sponsorship Rating of A, and an Accumulation/Distribution rating of B-.
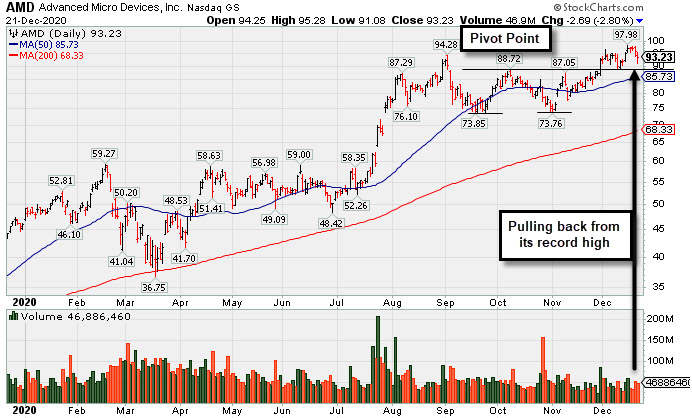
Pulling Back From its Record High Hit Last Week - Monday, December 21, 2020
Advanced Micro Devices (AMD -$2.69 or -2.80% to $93.23) pulled back from its all-time high with 4th consecutive loss, slumping near its "max buy" level. Recently it rose from the previously noted "double bottom" base. Its 50-day moving average (DMA) line ($85.73) defines important near term support to watch.
It reported earnings +128% on +56% sales revenues for the Sep '20 quarter versus the year ago period and announced plans to acquire Xilinx Inc (XLNX). The 5 latest quarterly comparisons through Sep '20 showed very strong earnings increases w ell above the +25% minimum guideline (C criteria) with strong underlying sales revenues growth versus the year ago periods. Annual earnings growth (A criteria) has been very strong after losses in FY '15 and '16. it has a highest possible 99 Earnings Per Share Rating.
AMD hails from the Electronics - Semiconductor Fabless industry which has a Group Relative Strength Rating of 77 (L criteria). It has a large supply of 1.20 billion shares outstanding (S criteria), which makes it less likely to be a quick sprinter. However, the number of top-rated funds owning its shares rose from 1,669 in Jun '19 to 2,364 in Sep '20, a reassuring sign concerning the I criteria. Its current Up/Down Volume Ratio of 1.0 is an unbiased indication its shares have been neutral concerning accumulation/distribution over the past 50 days. It has a Timeliness Rating of B, a Sponsorship Rating of B, and an Accumulation/Distribution rating of B.
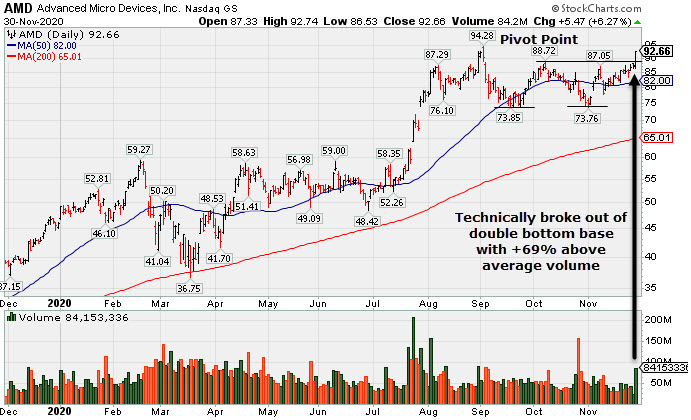
Volume Heavy Behind AMD's Breakout from Double Bottom Base - Monday, November 30, 2020
Advanced Micro Devices (AMD +$5.47 or +6.27% to $92.66) rallied above the previously cited pivot point ofa "double bottom" base with today's big gain backed by +69% above average volume triggering a technical buy signal. Its 50-day moving average (DMA) line ($82) defines important near term support. In recent weeks it was noted - "Subsequent gains above the pivot point backed by at least +40% above average volume are needed to trigger trigger a technical buy signal."
It reported earnings +128% on +56% sales revenues for the Sep '20 quarter versus the year ago period and announced plans to acquire Xilinx Inc (XLNX). The 5 latest quarterly comparisons through Sep '20 showed very strong earnings increases w ell above the +25% minimum guideline (C criteria) with strong underlying sales revenues growth versus the year ago periods. Annual earnings growth (A criteria) has been very strong after losses in FY '15 and '16. it has a highest possible 99 Earnings Per Share Rating.
AMD hails from the Electronics - Semiconductor Fabless industry which has a Group Relative Strength Rating of 85 (L criteria). It has a large supply of 1.20 billion shares outstanding (S criteria), which makes it less likely to be a quick sprinter. However, the number of top-rated funds owning its shares rose from 1,669 in Jun '19 to 2,329 in Sep '20, a reassuring sign concerning the I criteria. Its current Up/Down Volume Ratio of 1.1 is an unbiased indication its shares have been under slight acumulation over the past 50 days. It has a Timeliness Rating of A, a Sponsorship Rating of B, and an Accumulation/Distribution rating of C+.
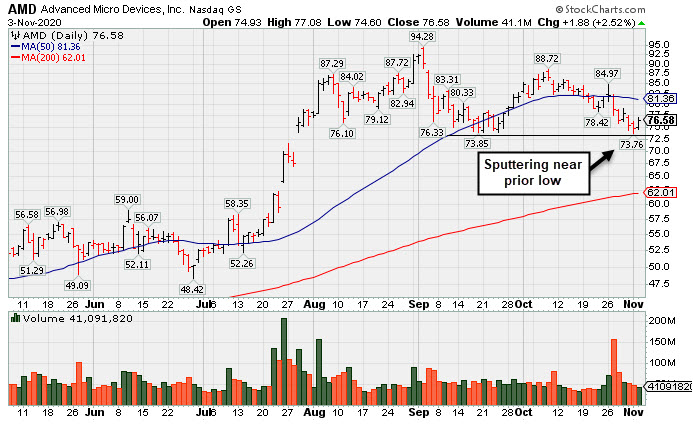
Weak Action Raised Concern While Testing Recent Low - Tuesday, November 3, 2020
Advanced Micro Devices (AMD $76.58 +$1.88 +2.52%) posted a gain today with light volume. Losses with heavy volume raised concerns recently while slumping and testing the prior low ($73.85 on 9/18/20). Weak action came after it reported earnings +128% on +56% sales revenues for the Sep '20 quarter versus the year ago period and announced plans to acquire Xilinx Inc (XLNX). Any more damaging losses would raise greater concerns and trigger a more worrisome technical sell signal. Meanwhile, it faces near-term resistance due to overhead supply up to the $94 level.
The 5 latest quarterly comparisons through Sep '20 showed very strong earnings increases well above the +25% minimum guideline (C criteria) with strong underlying sales revenues growth versus the year ago periods. Annual earnings growth (A criteria) has been very strong after losses in FY '15 and '16. it has a highest possible 99 Earnings Per Share Rating.
AMD traded up more than +70% since highlighted in yellow in the 6/09/20 mid-day report (read here). A new pivot point had been cited in late August after an advanced "3-weeks tight" base pattern, but the rally above it was short lived. It was last shown in this FSU section on 10/14/20 with an annotated graph under the headline, "Consolidating Just Above 50-Day Moving Average".
AMD hails from the Electronics - Semiconductor Fabless industry which has a Group Relative Strength Rating of 90 (L criteria). It has a large supply of 1.20 billion shares outstanding (S criteria), which makes it less likely to be a quick sprinter. However, the number of top-rated funds owning its shares rose from 1,669 in Jun '19 to 2,242 in Sep '20, a reassuring sign concerning the I criteria. Its current Up/Down Volume Ratio of 0.8 is an unbiased indication its shares have been under slight distributional pressure over the past 50 days. It has a Timeliness Rating of B, a Sponsorship Rating of B, and an Accumulation/Distribution rating of C-.
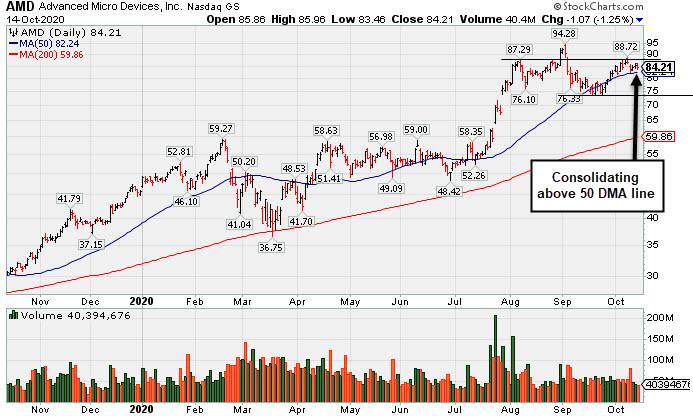
Consolidating Just Above 50-Day Moving Average - Wednesday, October 14, 2020
Advanced Micro Devices (AMD -$1.07 or -1.25% to $84.21) pulled back today with lighter volume. The company reportedly is considering buying Xilinx Inc (XLNX). Recently it found support near its 50-day moving average (DMA) line ($82.24). Any deterioration below the 50 DMA line and the recent low ($73.85 on 9/18/20) would raise greater concerns and may trigger more worrisome technical sell signals. It has not formed an orderly base and still faces some near-term resistance due to overhead supply up to the $94 level.
Fundamentals remain strong. It reported earnings +125% on +26% sales revenues for the Jun '20 quarter versus the year ago period. The 4 latest quarterly comparisons through Jun '20 showed very strong earnings increases well above the +25% minimum guideline (C criteria) with strong underlying sales revenues growth versus the year ago periods. Annual earnings growth (A criteria) has been very strong after losses in FY '15 and '16. it has a highest possible 99 Earnings Per Share Rating.
AMD traded up more than +70% since highlighted in yellow in the 6/09/20 mid-day report (read here). A new pivot point had been cited in late August after an advanced "3-weeks tight" base pattern, but the rally above it was short lived. It was last shown in this FSU section on 9/28/20 with an annotated graph under the headline, "Rebound Above 50-Day Average With Light Volume Helped Stance".
AMD hails from the Electronics - Semiconductor Fabless industry which has a Group Relative Strength Rating of 85 (L criteria). It has a large supply of 1.17 billion shares outstanding (S criteria), which makes it less likely to be a quick sprinter. However, the number of top-rated funds owning its shares rose from 1,669 in Jun '19 to 2,209 in Jun '20, a reassuring sign concerning the I criteria. Its current Up/Down Volume Ratio of 1.0 is an unbiased indication its shares have been under slight accumulation over the past 50 days. It has a Timeliness Rating of A, a Sponsorship Rating of B, and an Accumulation/Distribution rating of B-.
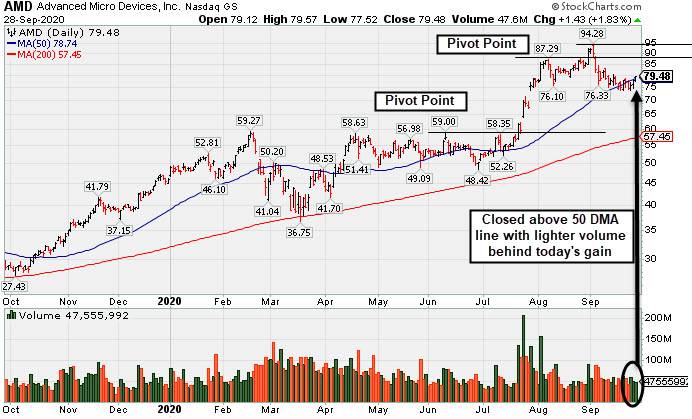
Rebound Above 50-Day Average With Light Volume Helped Stance - Monday, September 28, 2020
Advanced Micro Devices (AMD +$1.43 or +1.83% to $79.48) posted a gain today with below average volume as it rebounded above its 50-day moving average (DMA) line ($78.74). The improvement helped its technical stance, but it still faces near-term resistance due to overhead supply up to the $94 level. More damaging losses below the 50 DMA line and below the recent low ($73.85 on 9/18/20) would raise greater concerns and trigger more worrisome technical sell signals.
Fundamentals remain strong. It reported earnings +125% on +26% sales revenues for the Jun '20 quarter versus the year ago period. The 4 latest quarterly comparisons through Jun '20 showed very strong earnings increases well above the +25% minimum guideline (C criteria) with strong underlying sales revenues growth versus the year ago periods. Annual earnings growth (A criteria) has been very strong after losses in FY '15 and '16. it has a highest possible 99 Earnings Per Share Rating.
AMD traded up more than +70% since highlighted in yellow in the 6/09/20 mid-day report (read here). A new pivot point had been cited in late August after an advanced "3-weeks tight" base pattern, but the rally above it was short lived. It was last shown in this FSU section on 9/15/20 with an annotated graph under the headline, "Found Support Above 50 DMA Line After Negating Recent Breakout".
AMD hails from the Electronics - Semiconductor Fabless industry which has a Group Relative Strength Rating of 88 (L criteria). It has a large supply of 1.17 billion shares outstanding (S criteria), which makes it less likely to be a quick sprinter. However, the number of top-rated funds owning its shares rose from 1,669 in Jun '19 to 2,151 in Jun '20, a reassuring sign concerning the I criteria. Its current Up/Down Volume Ratio of 1.1 is an unbiased indication its shares have been under slight accumulation over the past 50 days. It has a Timeliness Rating of A, a Sponsorship Rating of B, and an Accumulation/Distribution rating of A-.
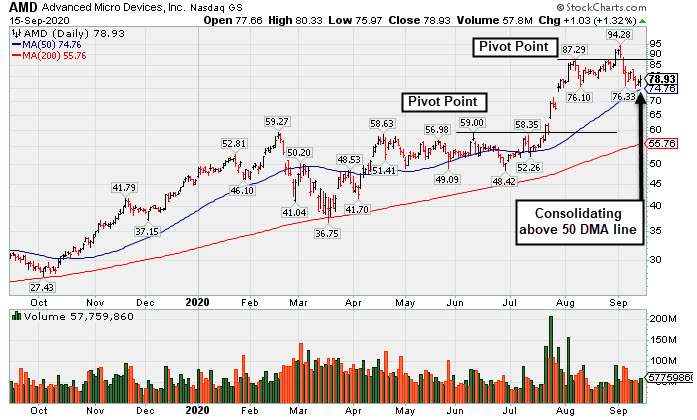
Found Support Above 50 DMA Line After Negating Recent Breakout - Tuesday, September 15, 2020
Advanced Micro Devices (AMD +$1.03 or +1.32% to $78.93) posted a 2nd consecutive gain today with lighter than average volume, consolidating above its 50-day moving average (DMA) line ($74.76). It negated the latest breakout from an advanced "3-weeks tight" base and undercut recent lows in the $76 area last week raising concerns while slumping toward its 50-day moving average (DMA) line. More damaging losses leading to a 50 DMA line violation may trigger a worrisome technical sell signal. Subsequent gains back above the pivot point may help its outlook improve.
Fundamentals remain strong. Bullish action came after it reported earnings +125% on +26% sales revenues for the Jun '20 quarter versus the year ago period. The 4 latest quarterly comparisons through Jun '20 showed very strong earnings increases well above the +25% minimum guideline (C criteria) with strong underlying sales revenues growth versus the year ago periods. Annual earnings growth (A criteria) has been very strong after losses in FY '15 and '16. it has a highest possible 99 Earnings Per Share Rating.
AMD hails from the Electronics - Semiconductor Fabless industry which has a Group Relative Strength Rating of 87 (L criteria). It has a large supply of 1.17 billion shares outstanding (S criteria), which makes it less likely to be a quick sprinter. However, the number of top-rated funds owning its shares rose from 1,669 in Jun '19 to 2,152 in Jun '20, a reassuring sign concerning the I criteria. Its current Up/Down Volume Ratio of 1.2 is an unbiased indication its shares have been under accumulation over the past 50 days. It has a Timeliness Rating of A, a Sponsorship Rating of B, and an Accumulation/Distribution rating of B+.
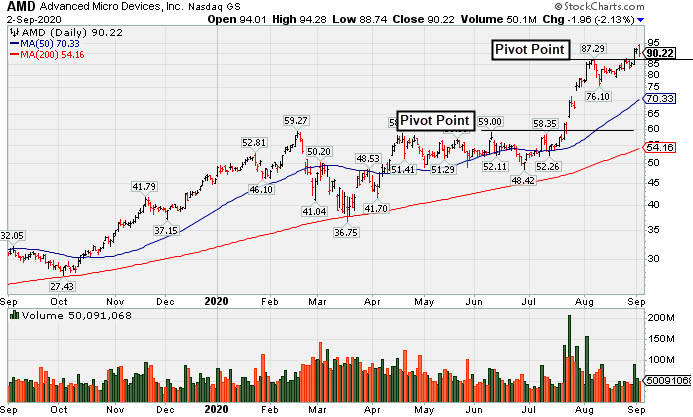
Perched at All-Time High After Another Bullish Breakout - Wednesday, September 2, 2020
Advanced Micro Devices (AMD -$1.96 or -2.13% to $90.22) hit a new all-time high and traded above its "max buy" level today but reversed and ended the session slightly lower. Its color code was recently changed to yellow with new pivot point cited based on its 8/07/20 high after an advanced "3-weeks tight" base. The gain above its pivot point on 8/31/20 was backed by +44% above average volume triggering a new (or add-on) technical buy signal. On pullbacks, the recent low ($76.10 on 8/11/20) defines near-term support to watch above its 50-day moving average (DMA) line ($70.33).
Fundamentals remain strong. Bullish action came after it reported earnings +125% on +26% sales revenues for the Jun '20 quarter versus the year ago period. The 4 latest quarterly comparisons through Jun '20 showed very strong earnings increases well above the +25% minimum guideline (C criteria) with strong underlying sales revenues growth versus the year ago periods. Annual earnings growth (A criteria) has been very strong after losses in FY '15 and '16. it has a highest possible 99 Earnings Per Share Rating.
AMD hails from the Electronics - Semiconductor Fabless industry which has a Group Relative Strength Rating of 92 (L criteria). It has a large supply of 1.17 billion shares outstanding (S criteria), which makes it less likely to be a quick sprinter. However, the number of top-rated funds owning its shares rose from 1,669 in Jun '19 to 2,140 in Jun '20, a reassuring sign concerning the I criteria. Its current Up/Down Volume Ratio of 1.2 is an unbiased indication its shares have been under accumulation over the past 50 days. It has a Timeliness Rating of A, a Sponsorship Rating of B, and an Accumulation/Distribution rating of A-.
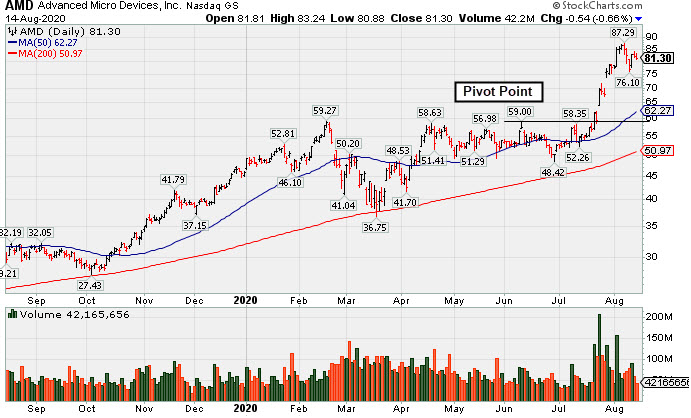
AMD Rose +46% Since First Featured on June 9th - Friday, August 14, 2020
Advanced Micro Devices (AMD -$0.54 or -0.66% to $81.30) is consolidating near its all-time high, still very extended from the previously noted base. Its 50-day moving average (DMA) line ($62.27) and prior highs in the $59 area define important support to watch on pullbacks.
Bullish action came after it reported earnings +125% on +26% sales revenues for the Jun '20 quarter versus the year ago period. Volume and volatility often increase near earnings news. The 4 latest quarterly comparisons through Jun '20 showed very strong earnings increases well above the +25% minimum guideline (C criteria) with strong underlying sales revenues growth versus the year ago periods. Annual earnings growth (A criteria) has been very strong after losses in FY '15 and '16. it has a highest possible 99 Earnings Per Share Rating.
AMD hails from the Electronics - Semiconductor Fabless industry which has a Group Relative Strength Rating of 95 (L criteria). It has a large supply of 1.17 billion shares outstanding (S criteria), which makes it less likely to be a quick sprinter. However, the number of top-rated funds owning its shares rose from 1,669 in Jun '19 to 2,109 in Jun '20, a reassuring sign concerning the I criteria. Its current Up/Down Volume Ratio of 1.3 is an unbiased indication its shares have been under accumulation over the past 50 days. It has a Timeliness Rating of A, a Sponsorship Rating of B, and an Accumulation/Distribution rating of B+.
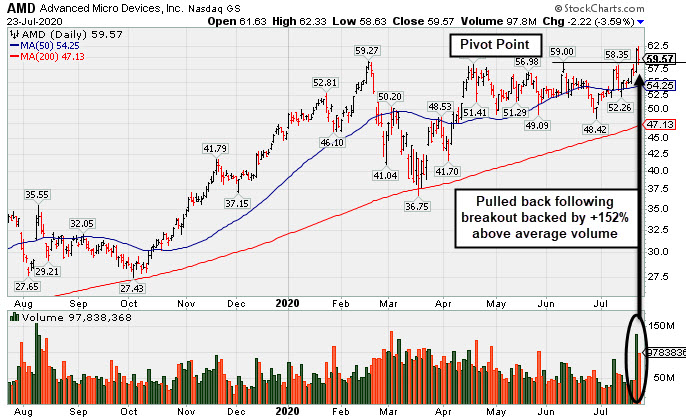
Pullback After Breakout Gain Backed by +152% Above Average Volume - Thursday, July 23, 2020
Advanced Micro Devices (AMD -$2.22 or -3.59% to $59.57) pulled back today retreating toward its pivot point with above average volume behind a big loss. The breakout gain on the prior session was backed by +152% above average volume triggering a technical buy signal. A new pivot point was cited based on its 6/10/20 high plus 10 cents. Now the prior highs in the $59 area define initial support to watch above its 50-day moving average (DMA) line ($54.25).
Keep in mind it is due to report Jun '20 quarterly results on Tuesday, 7/28/20. Volume and volatility often increase near earnings news. AMD was highlighted in yellow in the 6/09/20 mid-day report (read here). It undercut the prior lows but managed a "positive reversal" on the session after it was last shown in this FSU section on 6/26/20 with an annotated graph under the headline, "Slump Below 50-Day Average Toward Prior Low Raises Concerns".
The 3 latest quarterly comparisons through Mar '20 showed very strong earnings increases well above the +25% minimum guideline (C criteria) with greatly improved sales revenues growth +50% and +40% in the Dec '19 and Mar '20 comparisons, respectively, versus the year ago periods. Annual earnings growth (A criteria) has been very strong after losses in FY '15 and '16. it has a highest possible 99 Earnings Per Share Rating.
AMD hails from the Electronics - Semiconductor Fabless industry which has a Group Relative Strength Rating of 89 (L criteria). It has a large supply of 1.17 billion shares outstanding (S criteria), which makes it less likely to be a quick sprinter. However, the number of top-rated funds owning its shares rose from 1,669 in Jun '19 to 2,069 in Jun '20, a reassuring sign concerning the I criteria. It has a Timeliness Rating of A, a Sponsorship Rating of B, and an Accumulation/Distribution rating of B.
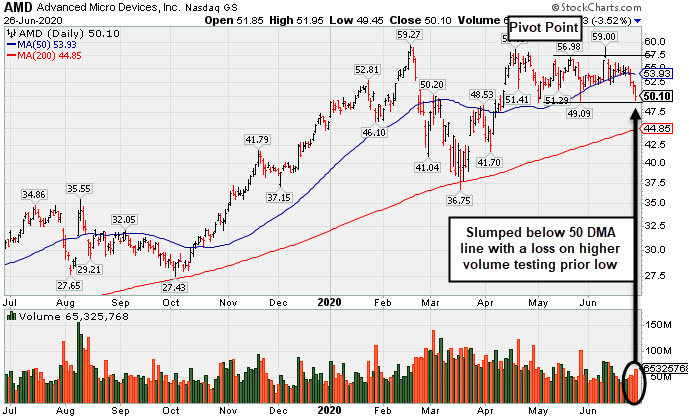
Slump Below 50-Day Average Toward Prior Low Raises Concerns - Friday, June 26, 2020
Advanced Micro Devices (AMD -$1.83 or -3.52% to $50.10) slumped even further below its 50-day moving average (DMA) line ($53.93) with higher (near average) volume behind today's 4th consecutive loss. A prompt rebound above the 50 DMA line is needed for its outlook to improve. The prior low ($49.09 on 5/27/20) defines the next important support to watch. AMD met stubborn resistance in the $57-59 area. A rebound and subsequent gains into new high territory are needed to trigger a technical buy signal which may mark the beginning of a substantial leg higher.
AMD was highlighted in yellow in the 6/09/20 mid-day report (read here) with pivot point cited based on its 5/20/20 high while building on an orderly double-bottom base. It was shown in this FSU section on 6/09/20 with an annotated graph under the headline, "Big Chip Firm Showing Strong Sales Revenues and Earnings Increases". Fundamentals remain strong. The 3 latest quarterly comparisons through Mar '20 showed very strong earnings increases well above the +25% minimum guideline (C criteria) with greatly improved sales revenues growth +50% and +40% in the Dec '19 and Mar '20 comparisons, respectively, versus the year ago periods. Annual earnings growth (A criteria) has been very strong after losses in FY '15 and '16. it has a highest possible 99 Earnings Per Share Rating.
AMD hails from the Electronics - Semiconductor Fabless industry which has a Group Relative Strength Rating of 89 (L criteria). It has a large supply of 1.17 billion shares outstanding (S criteria), which makes it less likely to be a quick sprinter. However, the number of top-rated funds owning its shares rose from 1,669 in Jun '19 to 2,003 in Mar '20, a reassuring sign concerning the I criteria. It has a Timeliness Rating of A and Sponsorship Rating of B. Its Accumulation/Distribution rating is B-.
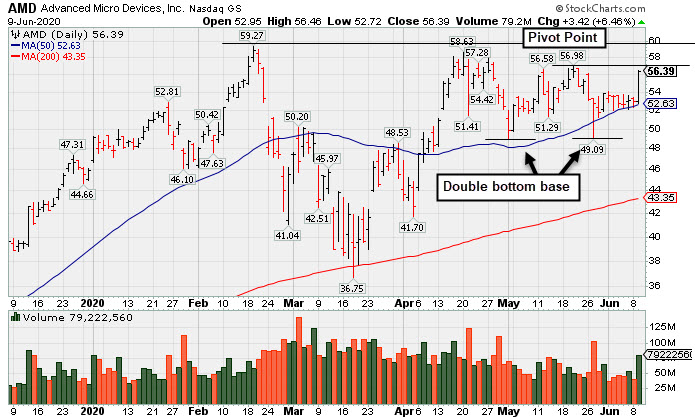
Big Chip Firm Showing Strong Sales Revenues and Earnings Increases - Tuesday, June 9, 2020
Advanced Micro Devices (AMD +$3.42 or +6.46% to $56.39) was highlighted in yellow in the earlier mid-day report (read here) with pivot point cited based on its 5/20/20 high while building on an orderly double-bottom base above its 50-day moving average which has acted as support. Subsequent gains above the pivot point backed by at least +40% above average volume may trigger a convincing technical buy signal. Today's gain also has it approaching previously stubborn resistance in the $57-59 area. Subsequent gains into new high territory may mark the beginning of a new substantial leg higher.
The 3 latest quarterly comparisons through Mar '20 showed very strong earnings increases well above the +25% minimum guideline (C criteria) with greatly improved sales revenues growth +50% and +40% in the Dec '19 and Mar '20 comparisons, respectively, versus the year ago periods. Annual earnings growth (A criteria) has been very strong after losses in FY '15 and '16. it has a highest possible 99 Earnings Per Share Rating.
AMD hails from the Electronics - Semiconductor Fabless industry which has a Group Relative Strength Rating of 95 (L criteria). It has a large supply of 1.17 billion shares outstanding (S criteria), which makes it less likely to be a quick sprinter. However, the number of top-rated funds owning its shares rose from 1,669 in Jun '19 to 1,985 in Mar '20, a reassuring sign concerning the I criteria. It has a Timeliness Rating of A and Sponsorship Rating of B. Its Accumulation/Distribution rating is B-.