You are not logged in.
This means you
CAN ONLY VIEW reports that were published prior to Saturday, April 5, 2025.
You
MUST UPGRADE YOUR MEMBERSHIP if you want to see any current reports.
AFTER MARKET UPDATE - MONDAY, SEPTEMBER 28TH, 2020
Previous After Market Report Next After Market Report >>>
|
|
|
|
DOW |
+410.10 |
27,584.06 |
+1.51% |
|
Volume |
854,520,382 |
+7% |
|
Volume |
3,526,868,200 |
-6% |
|
NASDAQ |
+198.24 |
11,111.81 |
+1.82% |
|
Advancers |
2,546 |
84% |
|
Advancers |
2,518 |
76% |
|
S&P 500 |
+53.14 |
3,351.60 |
+1.61% |
|
Decliners |
467 |
15% |
|
Decliners |
814 |
24% |
|
Russell 2000 |
+35.44 |
1,510.34 |
+2.40% |
|
52 Wk Highs |
49 |
|
|
52 Wk Highs |
62 |
|
|
S&P 600 |
+23.14 |
858.07 |
+2.77% |
|
52 Wk Lows |
10 |
|
|
52 Wk Lows |
33 |
|
|
 |
Breadth Positive and Leadership Improved Behind Indices' Gains
Kenneth J. Gruneisen - Passed the CAN SLIM® Master's Exam
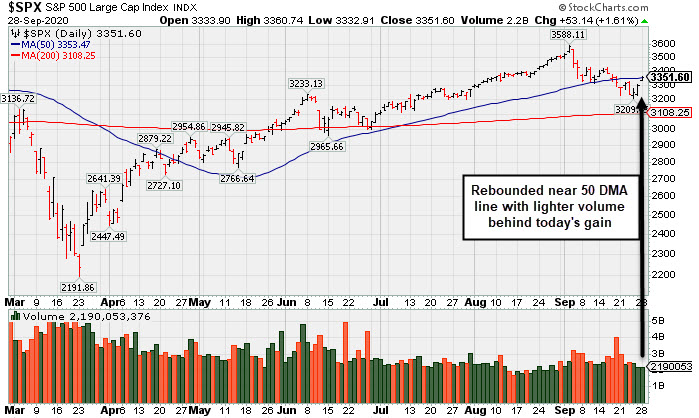
The Dow climbed 410 points, while the S&P 500 gained 1.6%, its best day in two weeks. The Nasdaq Composite was up 1.9%. The small-cap Russell 2000 advanced 2.6%, outperforming its large-cap peers. The reported volume totals were mixed, higher than the prior session total on the NYSE and lighter on the Nasdaq exchange. Breadth was positive as advancers led decliners by more than a 5-1 margin on the NYSE and more than 3-1 on the Nasdaq exchange. Leadership improved as 16 high-ranked companies from the Leaders List that hit new 52-week highs and were listed on the BreakOuts Page, versus the total of 1 on the prior session. New 52-week highs outnumbered new 52-week lows totals on the NYSE and on the Nasdaq exchange. The major indices have been showing action indicative of a market correction (M criteria). In weak markets it is considered critical to reduce exposure and sell faltering stocks on a case-by-case basis.
PICTURED: The S&P 500 Index posted a gain with lighter volume, rebounding near its 50-day moving average (DMA) line.
Stocks finished broadly higher on Monday, with Wall Street paring September’s sell-off. The major averages are on track for their first monthly loss since March, with the S&P 500 coming off a fourth consecutive weekly decline, its longest such streak in over a year. Hopes of further fiscal stimulus remained in focus, with House Speaker Nancy Pelosi indicating another coronavirus relief bill is still within reach.
All 11 S&P 500 sectors closed in positive territory with gains broad-based. Financials outperformed, with banks among the standouts. HSBC (HSBC +10.22%) rose following news that one of its largest shareholders increased its stake in the London-based firm. Boeing (BA +6.44%) rose after the FAA said key evaluation flights would be conducted on the 737-MAX jet this week. In M&A news, Devon Energy (DVN +11.11%) and WPX Energy (WPX +16.44%) each posted double-digit gains after announcing plans to move forward with a merger of equals.
On the data front, an update from the Dallas Fed showed manufacturing activity in the region improved more than anticipated in September. Overseas, Chinese industrial profits advanced for the fourth consecutive month in August. Treasuries were little changed, with the yield on the 10-year note up one basis point to 0.66%. In commodities, WTI crude added 0.8% to $40.58/barrel. In FOREX trading, a gauge of the U.S. dollar drifted lower on the heels of its best week since April. |
 Kenneth J. Gruneisen started out as a licensed stockbroker in August 1987, a couple of months prior to the historic stock market crash that took the Dow Jones Industrial Average down -22.6% in a single day. He has published daily fact-based fundamental and technical analysis on high-ranked stocks online for two decades. Through FACTBASEDINVESTING.COM, Kenneth provides educational articles, news, market commentary, and other information regarding proven investment systems that work in good times and bad.
Comments contained in the body of this report are technical opinions only and are not necessarily those of Gruneisen Growth Corp. The material herein has been obtained from sources believed to be reliable and accurate, however, its accuracy and completeness cannot be guaranteed. Our firm, employees, and customers may effect transactions, including transactions contrary to any recommendation herein, or have positions in the securities mentioned herein or options with respect thereto. Any recommendation contained in this report may not be suitable for all investors and it is not to be deemed an offer or solicitation on our part with respect to the purchase or sale of any securities. |
|
 |
Financial, Retail, Tech, and Commodity-Linked Groups Rose
Kenneth J. Gruneisen - Passed the CAN SLIM® Master's Exam
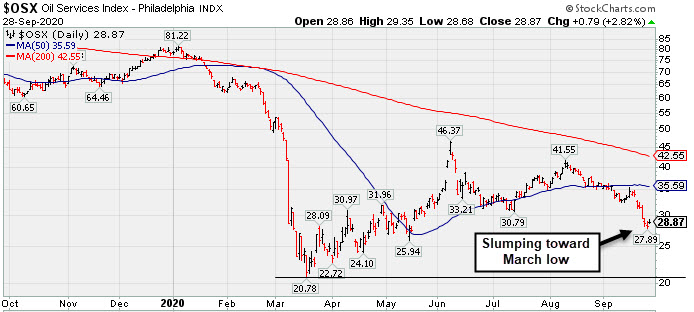
The Bank Index ($BKX +3.01%), Broker/Dealer Index ($XBD +2.88%), and Retail Index ($RLX +2.37%) each posted influential gains that underpinned the major indices. The Semiconductor Index ($SOX +2.65%), Networking Index ($NWX +2.25%), and Biotech Index ($BTK +0.86%) posted unanimous gains. The Gold & Silver Index ($XAU +1.14%) and Integrated Oil Index ($XOI +1.89%) also rose. PICTURED: The Oil Services Index ($OSX +2.75%) recently slumped below its 50-day moving average (DMA) line toward the March low.
| Oil Services |
$OSX |
28.85 |
+0.77 |
+2.75% |
-63.15% |
| Integrated Oil |
$XOI |
624.64 |
+11.59 |
+1.89% |
-50.84% |
| Semiconductor |
$SOX |
2,235.62 |
+57.79 |
+2.65% |
+20.87% |
| Networking |
$NWX |
532.31 |
+11.71 |
+2.25% |
-8.76% |
| Broker/Dealer |
$XBD |
279.60 |
+7.83 |
+2.88% |
-3.71% |
| Retail |
$RLX |
3,407.89 |
+78.85 |
+2.37% |
+39.14% |
| Gold & Silver |
$XAU |
141.56 |
+1.60 |
+1.14% |
+32.40% |
| Bank |
$BKX |
73.22 |
+2.14 |
+3.01% |
-35.41% |
| Biotech |
$BTK |
5,339.12 |
+45.61 |
+0.86% |
+5.36% |
|
|
|
 |
Rebound Above 50-Day Average With Light Volume Helped Stance
Kenneth J. Gruneisen - Passed the CAN SLIM® Master's Exam
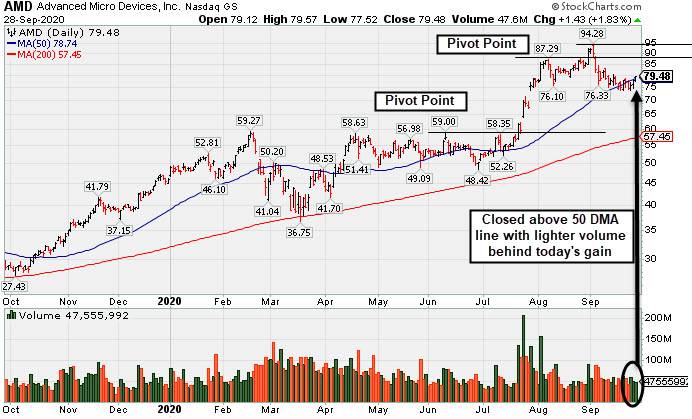
Advanced Micro Devices (AMD +$1.43 or +1.83% to $79.48) posted a gain today with below average volume as it rebounded above its 50-day moving average (DMA) line ($78.74). The improvement helped its technical stance, but it still faces near-term resistance due to overhead supply up to the $94 level. More damaging losses below the 50 DMA line and below the recent low ($73.85 on 9/18/20) would raise greater concerns and trigger more worrisome technical sell signals.
Fundamentals remain strong. It reported earnings +125% on +26% sales revenues for the Jun '20 quarter versus the year ago period. The 4 latest quarterly comparisons through Jun '20 showed very strong earnings increases well above the +25% minimum guideline (C criteria) with strong underlying sales revenues growth versus the year ago periods. Annual earnings growth (A criteria) has been very strong after losses in FY '15 and '16. it has a highest possible 99 Earnings Per Share Rating.
AMD traded up more than +70% since highlighted in yellow in the 6/09/20 mid-day report (read here). A new pivot point had been cited in late August after an advanced "3-weeks tight" base pattern, but the rally above it was short lived. It was last shown in this FSU section on 9/15/20 with an annotated graph under the headline, "Found Support Above 50 DMA Line After Negating Recent Breakout".
AMD hails from the Electronics - Semiconductor Fabless industry which has a Group Relative Strength Rating of 88 (L criteria). It has a large supply of 1.17 billion shares outstanding (S criteria), which makes it less likely to be a quick sprinter. However, the number of top-rated funds owning its shares rose from 1,669 in Jun '19 to 2,151 in Jun '20, a reassuring sign concerning the I criteria. Its current Up/Down Volume Ratio of 1.1 is an unbiased indication its shares have been under slight accumulation over the past 50 days. It has a Timeliness Rating of A, a Sponsorship Rating of B, and an Accumulation/Distribution rating of A-.
|
|
|
Color Codes Explained :
Y - Better candidates highlighted by our
staff of experts.
G - Previously featured
in past reports as yellow but may no longer be buyable under the
guidelines.
***Last / Change / Volume data in this table is the closing quote data***
Symbol/Exchange
Company Name
Industry Group |
PRICE |
CHANGE
(%Change) |
Day High |
Volume
(% DAV)
(% 50 day avg vol) |
52 Wk Hi
% From Hi |
Featured
Date |
Price
Featured |
Pivot Featured |
|
Max Buy |
 ADBE
-
NASDAQ
ADBE
-
NASDAQ
Adobe Inc
COMPUTER SOFTWARE and SERVICES - Application Software
|
$488.51
|
+8.73
1.82% |
$489.39
|
2,804,450
91.83% of 50 DAV
50 DAV is 3,054,000
|
$536.88
-9.01%
|
9/10/2020
|
$488.46
|
PP = $536.88
|
|
MB = $563.72
|
 Most Recent Note - 9/28/2020 5:27:33 PM
G - Found prompt support near its 50 DMA line ($469). faces near-term resistance due to overhead supply up to the $536 level. Disciplined investors always limit losses by selling any stock that falls more than 7-8% from their purchase price. Reported Aug '20 quarterly earnings +25% on +14% sales revenues versus the year ago period.
>>> FEATURED STOCK ARTICLE : Light Volume Loss Falling Near 50-Day Moving Average Line Again - 9/23/2020 |
View all notes |
Set NEW NOTE alert |
Company Profile |
SEC
News |
Chart |
Request a new note
C
A
S
I |
CRL
-
NYSE
Charles River Labs Intl
DRUGS - Biotechnology
|
$223.42
|
+6.65
3.07% |
$224.30
|
228,807
71.28% of 50 DAV
50 DAV is 321,000
|
$228.86
-2.38%
|
7/15/2020
|
$192.66
|
PP = $189.95
|
|
MB = $199.45
|
Most Recent Note - 9/28/2020 5:31:11 PM
G - Posted a gain with light volume today for its 2nd best ever close. Showed resilience and found prompt support at its 50 DMA line ($212). More damaging losses would raise greater concerns and trigger a technical sell signal. Raised fundamental concerns when it recently reported Jun '20 quarterly earnings -3% on +4% sales revenues, below the +25% minimum guideline (C criteria).
>>> FEATURED STOCK ARTICLE : Showed Resilience When Testing 50-Day Moving Average Line Again - 9/24/2020 |
View all notes |
Set NEW NOTE alert |
Company Profile |
SEC
News |
Chart |
Request a new note
C
A
S
I |
AMD
-
NASDAQ
Advanced Micro Devices
ELECTRONICS - Semiconductor - Broad Line
|
$79.48
|
+1.43
1.83% |
$79.57
|
47,543,669
72.32% of 50 DAV
50 DAV is 65,738,000
|
$94.28
-15.70%
|
8/31/2020
|
$90.42
|
PP = $87.39
|
|
MB = $91.76
|
Most Recent Note - 9/28/2020 5:29:19 PM
G - Rebounded above its 50 DMA line ($78.74) with today's 3rd consecutive gain on lighter than average volume. More damaging losses below the 50 DMA line and below the recent low ($73.85 on 9/18/20) would raise greater concerns and trigger more worrisome technical sell signals. Faces near-term resistance due to overhead supply up to the $94 level. Fundamentals remain strong. See the latest FSU analysis for more details and a new annotated graph.
>>> FEATURED STOCK ARTICLE : Rebound Above 50-Day Average With Light Volume Helped Stance - 9/28/2020 |
View all notes |
Set NEW NOTE alert |
Company Profile |
SEC
News |
Chart |
Request a new note
C
A
S
I |
TREX
-
NYSE
Trex Company Inc
MATERIALS and CONSTRUCTION - General Building Materials
|
$71.06
|
+2.56
3.74% |
$71.52
|
449,985
44.16% of 50 DAV
50 DAV is 1,019,000
|
$78.32
-9.27%
|
6/26/2020
|
$54.53
|
PP = $66.47
|
|
MB = $69.79
|
Most Recent Note - 9/28/2020 5:38:17 PM
G - Rebounded above its 50 DMA line ($70.34) helping its outlook to improve, but light volume was behind today's 3rd consecutive gain. More damaging losses below the recent low ($63.32 on 9/21/20) would raise serious concerns. Do not be confused by the 2:1 share split effective 9/15/20 (Featured Price, Pivot Point, and Max Buy prices have been adjusted accordingly). Fundamentals remain strong.
>>> FEATURED STOCK ARTICLE : Slumped Below 50-Day Average With Loss on Light Volume - 9/17/2020 |
View all notes |
Set NEW NOTE alert |
Company Profile |
SEC
News |
Chart |
Request a new note
C
A
S
I |
NFLX
-
NASDAQ
Netflix Inc
SPECIALTY RETAIL - Music and Video Stores
|
$490.65
|
+7.77
1.61% |
$492.00
|
4,747,812
73.36% of 50 DAV
50 DAV is 6,472,000
|
$575.37
-14.72%
|
9/1/2020
|
$547.45
|
PP = $575.47
|
|
MB = $604.24
|
Most Recent Note - 9/28/2020 5:33:34 PM
G - Posted a 3rd consecutive gain today with light volume, rebounding toward its 50 DMA line ($495) which is now downward sloping. That short-term average has acted as resistance. Subsequent gains back above the 50 DMA line are needed for its outlook to improve. The recent low ($458.60 on 9/18/20) defines important near term support where any further deterioration would raise more serious concerns.
>>> FEATURED STOCK ARTICLE : Met Resistance at 50 DMA Line and Reversed Today - 9/16/2020 |
View all notes |
Set NEW NOTE alert |
Company Profile |
SEC
News |
Chart |
Request a new note
C
A
S
I |
Symbol/Exchange
Company Name
Industry Group |
PRICE |
CHANGE
(%Change) |
Day High |
Volume
(% DAV)
(% 50 day avg vol) |
52 Wk Hi
% From Hi |
Featured
Date |
Price
Featured |
Pivot Featured |
|
Max Buy |
LGIH
-
NASDAQ
L G I Homes Inc
Bldg-Resident/Comml
|
$115.70
|
+7.81
7.24% |
$116.25
|
286,499
96.14% of 50 DAV
50 DAV is 298,000
|
$123.94
-6.65%
|
7/7/2020
|
$99.19
|
PP = $95.82
|
|
MB = $100.61
|
Most Recent Note - 9/28/2020 5:25:10 PM
G - Rebounded above its 50 DMA line ($112.96) with today's considerable gain backed by higher (near average) volume helping its outlook to improve. Faces near-term resistance due to overhead supply up to the $123 level. More damaging losses below the latest low ($101.30 on 9/21/20) would raise greater concerns and trigger a worrisome technical sell signal. Reported Jun '20 quarterly earnings +21% on +4% sales revenues, breaking a streak of 4 comparisons above the +25% minimum guideline (C criteria).
>>> FEATURED STOCK ARTICLE : Violation of 50-Day Average on Volume Triggered Technical Sell Signal - 9/18/2020 |
View all notes |
Set NEW NOTE alert |
Company Profile |
SEC
News |
Chart |
Request a new note
C
A
S
I |
NOW
-
NYSE
Servicenow Inc
Computer Sftwr-Enterprse
|
$484.21
|
+4.24
0.88% |
$488.40
|
1,245,638
76.19% of 50 DAV
50 DAV is 1,635,000
|
$501.82
-3.51%
|
8/20/2020
|
$453.34
|
PP = $454.79
|
|
MB = $477.53
|
Most Recent Note - 9/28/2020 5:35:27 PM
G - Consolidating above its "max buy" level near its all-time high, it found support at its 50 DMA line ($452). Fundamentals remain strong. More damaging losses below the 50 DMA line and prior low ($432.85 on 9/08/20) may raise concerns and trigger a technical sell signal. See the latest FSU analysis for more details and an annotated graph.
>>> FEATURED STOCK ARTICLE : Gain Back Above "Max Buy" Level for ServiceNow - 9/25/2020 |
View all notes |
Set NEW NOTE alert |
Company Profile |
SEC
News |
Chart |
Request a new note
C
A
S
I |
|
|
|
THESE ARE NOT BUY RECOMMENDATIONS!
Comments contained in the body of this report are technical
opinions only. The material herein has been obtained
from sources believed to be reliable and accurate, however,
its accuracy and completeness cannot be guaranteed.
This site is not an investment advisor, hence it does
not endorse or recommend any securities or other investments.
Any recommendation contained in this report may not
be suitable for all investors and it is not to be deemed
an offer or solicitation on our part with respect to
the purchase or sale of any securities. All trademarks,
service marks and trade names appearing in this report
are the property of their respective owners, and are
likewise used for identification purposes only.
This report is a service available
only to active Paid Premium Members.
You may opt-out of receiving report notifications
at any time. Questions or comments may be submitted
by writing to Premium Membership Services 665 S.E. 10 Street, Suite 201 Deerfield Beach, FL 33441-5634 or by calling 1-800-965-8307
or 954-785-1121.
|
|
|