You are not logged in.
This means you
CAN ONLY VIEW reports that were published prior to Monday, February 26, 2024.
You
MUST UPGRADE YOUR MEMBERSHIP if you want to see any current reports.
AFTER MARKET UPDATE - THURSDAY, AUGUST 8TH, 2019
Previous After Market Report Next After Market Report >>>
|
|
|
|
DOW |
+371.12 |
26,378.19 |
+1.43% |
|
Volume |
1,027,527,070 |
+2% |
|
Volume |
2,441,177,520 |
-1% |
|
NASDAQ |
+176.33 |
8,039.16 |
+2.24% |
|
Advancers |
2,362 |
82% |
|
Advancers |
2,218 |
72% |
|
S&P 500 |
+54.11 |
2,938.09 |
+1.88% |
|
Decliners |
502 |
18% |
|
Decliners |
871 |
28% |
|
Russell 2000 |
+31.45 |
1,532.13 |
+2.10% |
|
52 Wk Highs |
168 |
|
|
52 Wk Highs |
93 |
|
|
S&P 600 |
+19.67 |
942.35 |
+2.13% |
|
52 Wk Lows |
54 |
|
|
52 Wk Lows |
95 |
|
|
 |
Major Indices Rose With Postive Breadth and Improved Leadership
Kenneth J. Gruneisen - Passed the CAN SLIM® Master's Exam
The Dow added 371 points. The S&P 500 gained 1.9% and the Nasdaq Composite jumped 2.2%, putting both benchmarks in positive territory for the week. Volume totals reported were mixed, slightly higher than the prior session total on the NYSE and lower on the Nasdaq exchange. Breadth was positive as advancers led decliners by more than 4-1 on the NYSE and by nearly 3-1 on the Nasdaq exchange. There were 58 high-ranked companies from the Leaders List hit new 52-week highs and were listed on the BreakOuts Page, versus the total of 33 on the prior session. New 52-week highs outnumbered new 52-week lows on the NYSE however new lows slightly outnumbered new highs and on the Nasdaq exchange. Disciplined investors will watch for a follow-through between Day 4-7 which could signal a new uptrend for the major indices (M criteria) as early as Friday's session. The Featured Stocks Page provides the most timely analysis on high-ranked leaders.Charts used courtesy of www.stockcharts.com
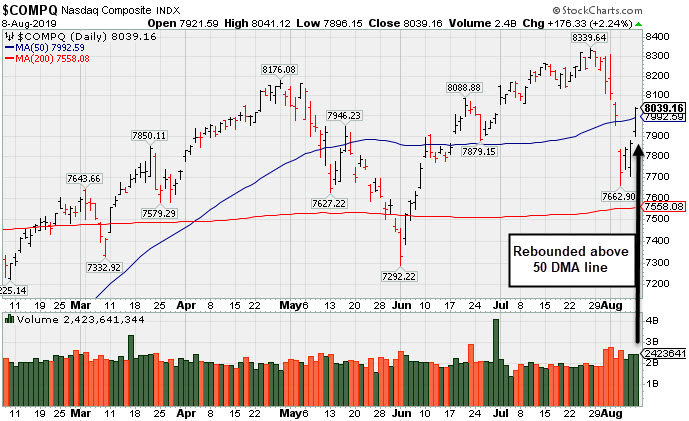
PICTURED: The Nasdaq Composite Index rebounded above its 50-day moving average (DMA) line.
Stocks finished higher on Thursday, as investors assessed China’s willingness to stabilize the Yuan. Officials in Beijing set the currency’s rate at a stronger figure than most analysts had expected, which seemingly eased concerns that trade tensions between the U.S. and China would escalate.
Investor sentiment was further boosted after a report showed Chinese exports unexpectedly rebounded in July. Meanwhile, perceived “safe-haven” assets stabilized. The yield on the benchmark 10-year note yield was down just one basis point to 1.71%, after trading as low as 1.59% on Wednesday. COMEX gold dipped 0.3% to $1,503.50/ounce, coming off its six-year high reached yesterday. On the data front, initial jobless claims fell to 209,000 in the most recent week from an upwardly revised 217,000 in the prior period.
All 11 S&P 500 sectors added more than 1% in the session. Energy stocks paced the gains, as WTI crude rebounded 3.3% to $52.76/barrel. Technology shares also outperformed, with Advanced Micro Devices (AMD +16.20%) soaring after positive commentary around the release of its second generation processor chip. In earnings, shares of American International Group (AIG +4.43%) rose after the insurer topped Wall Street earnings projections. Kraft Heinz (KHC -8.58% fell after revealing steep declines in sales for the first half of the year. In M&A news, Symantec Corp (SYMC +12.30%) rose amid reports Broadcom (AVGO +0.34%) is in the final stages of acquiring the cyber-security firm’s enterprise business.
|
 Kenneth J. Gruneisen started out as a licensed stockbroker in August 1987, a couple of months prior to the historic stock market crash that took the Dow Jones Industrial Average down -22.6% in a single day. He has published daily fact-based fundamental and technical analysis on high-ranked stocks online for two decades. Through FACTBASEDINVESTING.COM, Kenneth provides educational articles, news, market commentary, and other information regarding proven investment systems that work in good times and bad.
Comments contained in the body of this report are technical opinions only and are not necessarily those of Gruneisen Growth Corp. The material herein has been obtained from sources believed to be reliable and accurate, however, its accuracy and completeness cannot be guaranteed. Our firm, employees, and customers may effect transactions, including transactions contrary to any recommendation herein, or have positions in the securities mentioned herein or options with respect thereto. Any recommendation contained in this report may not be suitable for all investors and it is not to be deemed an offer or solicitation on our part with respect to the purchase or sale of any securities. |
|
 |
Retail, Financial, Tech, and Commodity-Linked Groups Rose
Kenneth J. Gruneisen - Passed the CAN SLIM® Master's Exam
The Retail Index ($RLX +2.28%) and Bank Index ($BKX +1.59%) both posted solid gains and outpaced the Broker/Dealer Index ($XBD +0.14%). The tech sector was strong as the Semiconductor Index ($SOX +2.69%), Biotech Index ($BTK +2.29%), and the Networking Index ($NWX +1.75%) posted unanimous gains. The Gold & Silver Index ($XAU +0.91%) and Integrated Oil Index ($XOI +2.70%) both outpaced the Oil Services Index ($OSX +0.37%).
Charts courtesy of www.stockcharts.com
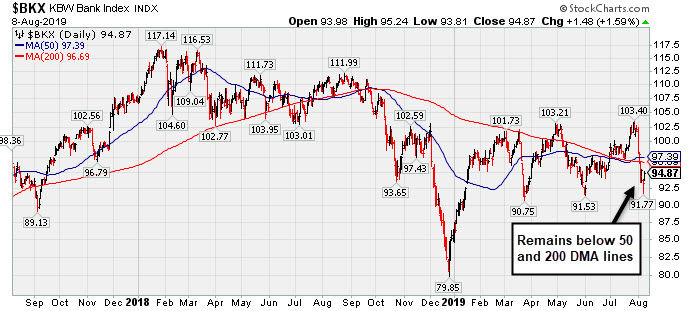
PICTURED: The Bank Index ($BKX +1.59%) remains below its 50-day and 200-day moving average (DMA) lines. To be in "healthy" shape an index should at least be trading above the long-term 200-day moving average, so it is very important for more improvement in the weeks ahead.
| Oil Services |
$OSX |
67.53 |
+0.25 |
+0.37% |
-16.22% |
| Integrated Oil |
$XOI |
1,198.66 |
+31.54 |
+2.70% |
+3.41% |
| Semiconductor |
$SOX |
1,491.26 |
+39.14 |
+2.70% |
+29.09% |
| Networking |
$NWX |
572.97 |
+9.88 |
+1.75% |
+17.25% |
| Broker/Dealer |
$XBD |
255.62 |
+0.35 |
+0.14% |
+7.70% |
| Retail |
$RLX |
2,330.65 |
+51.89 |
+2.28% |
+19.43% |
| Gold & Silver |
$XAU |
96.92 |
+0.87 |
+0.91% |
+37.16% |
| Bank |
$BKX |
94.87 |
+1.49 |
+1.60% |
+10.58% |
| Biotech |
$BTK |
4,669.89 |
+104.54 |
+2.29% |
+10.64% |
|
|
|
 |
Found Support at 50-Day Average
Kenneth J. Gruneisen - Passed the CAN SLIM® Master's Exam
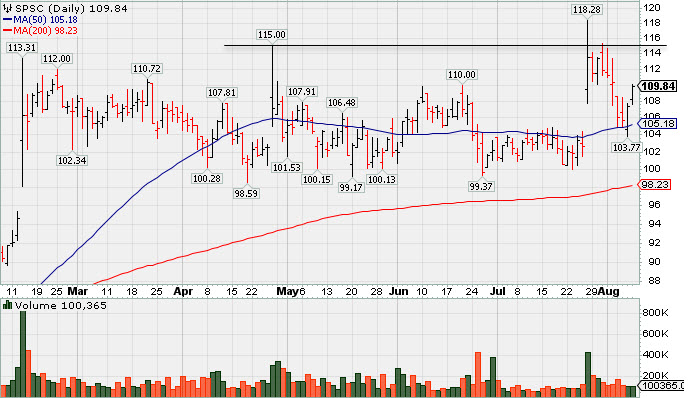
S P S Commerce Inc (SPSC +$2.50 or +2.33% to $109.84) found support at its 50-day moving average (DMA) line ($105.19). It stalled after a gap up and big volume-driven gain noted on 7/26/19. Subsequent gains and a strong close above the pivot point may help clinch a convincing new (or add-on) technical buy signal. However, it reported earnings +22% on +12% sales revenues for the Jun '19 quarter, slightly under the +25% minimum earnings guideline (C criteria), raising fundamental concerns. A small downturn in FY '16 earnings was previously noted as a flaw in its annual earnings (A criteria) history.
It was last shown in this FSU section on 7/09/19 with an annotated graph under the headline, "Recently Sputtering Below 50-Day Moving Average". The high-ranked Computer Software firm's current Up/Down Volume Ratio of 0.9 is an unbiased indication its shares have been under slight distributional pressure over the past 50 days.
It completed new Public Offerings on 11/20/13 and 9/06/12. The number of top-rated funds owning its shares rose from 238 in Mar '18 to 464 in Jun '19, a reassuring sign concerning the I criteria. It has a Timeliness Rating of B and Sponsorship Rating of C. The small supply of 17.4 million shares outstanding (S criteria) can contribute to greater price volatility in the even of institutional buying or selling.
Charts courtesy of www.stockcharts.com
|
|
|
Color Codes Explained :
Y - Better candidates highlighted by our
staff of experts.
G - Previously featured
in past reports as yellow but may no longer be buyable under the
guidelines.
***Last / Change / Volume data in this table is the closing quote data***
Symbol/Exchange
Company Name
Industry Group |
PRICE |
CHANGE
(%Change) |
Day High |
Volume
(% DAV)
(% 50 day avg vol) |
52 Wk Hi
% From Hi |
Featured
Date |
Price
Featured |
Pivot Featured |
|
Max Buy |
 SPSC
-
NASDAQ
SPSC
-
NASDAQ
S P S Commerce Inc
COMPUTER SOFTWARE and SERVICES - Application Software
|
$109.84
|
+2.50
2.33% |
$110.09
|
100,847
75.26% of 50 DAV
50 DAV is 134,000
|
$118.28
-7.14%
|
6/7/2019
|
$107.72
|
PP = $115.10
|
|
MB = $120.86
|
 Most Recent Note - 8/8/2019 8:32:11 PM
Y - Found support at its 50 DMA line. Stalled after a gap up and big volume-driven gain noted on 7/26/19. Subsequent gains and a strong close above the pivot point may clinch a convincing new (or add-on) technical buy signal. Reported earnings +22% on +12% sales revenues for the Jun '19 quarter, slightly under the +25% minimum earnings guideline (C criteria), raising fundamental concerns. See the latest FSU analysis for more details and a new annotated graph.
>>> FEATURED STOCK ARTICLE : Found Support at 50-Day Average - 8/8/2019 |
View all notes |
Set NEW NOTE alert |
Company Profile |
SEC
News |
Chart |
Request a new note
C
A
S
I |
EPAM
-
NYSE
Epam Systems Inc
COMPUTER SOFTWARE and SERVICES - Information Technology Service
|
$189.98
|
+10.28
5.72% |
$190.82
|
1,234,443
279.29% of 50 DAV
50 DAV is 442,000
|
$201.00
-5.48%
|
5/9/2019
|
$169.25
|
PP = $180.55
|
|
MB = $189.58
|
Most Recent Note - 8/8/2019 12:32:37 PM
Y - Color code was changed to yellow after reporting earnings +27% on +24% sales revenues and rebounding above its 50 DMA line ($182.46) helping its outlook to improve.
>>> FEATURED STOCK ARTICLE : Winning Streak Leaves IT Firm Extended From Prior Base - 7/12/2019 |
View all notes |
Set NEW NOTE alert |
Company Profile |
SEC
News |
Chart |
Request a new note
C
A
S
I |
AUDC
-
NASDAQ
Audiocodes Ltd
ELECTRONICS - Scientific and Technical Instrum
|
$18.78
|
+0.17
0.91% |
$19.08
|
179,725
102.70% of 50 DAV
50 DAV is 175,000
|
$19.74
-4.86%
|
7/15/2019
|
$17.10
|
PP = $17.54
|
|
MB = $18.42
|
Most Recent Note - 8/5/2019 4:01:44 PM
Y - Color code is changed to yellow after retreating below its "max buy" level amid widespread market weakness (M criteria). Reported earnings +57% on +14% sales revenues for the Jun '19 quarter, continuing its strong earnings track record. Prior highs in the $17 area define initial support above its 50 DMA line ($16.18).
>>> FEATURED STOCK ARTICLE : Posted a Gain With Average Volume for Best Ever Close - 7/15/2019 |
View all notes |
Set NEW NOTE alert |
Company Profile |
SEC
News |
Chart |
Request a new note
C
A
S
I |
ENV
-
NYSE
Envestnet Inc
FINANCIAL SERVICES - Diversified Investments
|
$61.18
|
-3.64
-5.62% |
$63.32
|
1,836,951
667.98% of 50 DAV
50 DAV is 275,000
|
$73.94
-17.26%
|
3/15/2019
|
$66.05
|
PP = $64.90
|
|
MB = $68.15
|
Most Recent Note - 8/8/2019 10:44:26 AM
Violating its 200 DMA line with heavier volume behind today's 9th consecutive loss. Reported earnings +12% on +12% sales revenues for the Jun '19 quarter, its 2nd consecutive quarterly comparison below the +25% minimum earnings guideline (C criteria). It will be dropped from the Featured Stocks list tonight.
>>> FEATURED STOCK ARTICLE : Technical Damage Mounts Ahead of Next Quarterly Report - 8/5/2019 |
View all notes |
Set NEW NOTE alert |
Company Profile |
SEC
News |
Chart |
Request a new note
C
A
S
I |
LHCG
-
NASDAQ
L H C Group Inc
HEALTH SERVICES - Home Health Care
|
$122.18
|
-1.22
-0.99% |
$127.14
|
429,760
200.82% of 50 DAV
50 DAV is 214,000
|
$129.37
-5.56%
|
7/1/2019
|
$110.94
|
PP = $122.20
|
|
MB = $128.31
|
Most Recent Note - 8/8/2019 12:39:01 PM
Y - Reported earnings +27% on +3% sales revenues for the Jun '19 quarter. Prior quarterly comparisons showed much stronger sales revenues growth. Found support above its 50 DMA line ($119.76). Recent gains above its pivot point were not backed by the +40% above average volume needed to trigger a proper new (or add-on) technical buy signal.
>>> FEATURED STOCK ARTICLE : Consolidating Following a Negative Reversal at High - 7/22/2019 |
View all notes |
Set NEW NOTE alert |
Company Profile |
SEC
News |
Chart |
Request a new note
C
A
S
I |
Symbol/Exchange
Company Name
Industry Group |
PRICE |
CHANGE
(%Change) |
Day High |
Volume
(% DAV)
(% 50 day avg vol) |
52 Wk Hi
% From Hi |
Featured
Date |
Price
Featured |
Pivot Featured |
|
Max Buy |
CHDN
-
NASDAQ
Churchill Downs Inc
LEISURE - Gaming Activities
|
$121.38
|
+4.10
3.50% |
$121.49
|
280,193
101.52% of 50 DAV
50 DAV is 276,000
|
$132.73
-8.55%
|
7/22/2019
|
$118.45
|
PP = $118.89
|
|
MB = $124.83
|
Most Recent Note - 8/6/2019 8:57:41 PM
Y - Found support above its 50 DMA line ($114) with a gain on lighter volume. Reported Jun '19 earnings rose +10% on +26% sales revenues versus the year ago period, below the +25% minimum earnings guideline (C criteria). The prior low ($108.57 on 6/25/19) defines the next important near-term support to watch below its 50 DMA line.
>>> FEATURED STOCK ARTICLE : Volume Light While Hovering at Record High - 7/16/2019 |
View all notes |
Set NEW NOTE alert |
Company Profile |
SEC
News |
Chart |
Request a new note
C
A
S
I |
LULU
-
NASDAQ
Lululemon Athletica
MANUFACTURING - Textile Manufacturing
|
$186.35
|
+4.99
2.75% |
$186.88
|
1,480,940
69.59% of 50 DAV
50 DAV is 2,128,000
|
$194.25
-4.07%
|
6/13/2019
|
$174.48
|
PP = $179.60
|
|
MB = $188.58
|
Most Recent Note - 8/8/2019 10:53:10 AM
Y - Color code is changed to yellow after rebounding above its 50 DMA line ($181.65) helping its technical stance improve. Reported Apr '19 quarterly earnings +35% on +20% sales revenues versus the year ago period.
>>> FEATURED STOCK ARTICLE : Quietly Hovering at All-Time High - 7/17/2019 |
View all notes |
Set NEW NOTE alert |
Company Profile |
SEC
News |
Chart |
Request a new note
C
A
S
I |
ULTA
-
NASDAQ
Ulta Beauty Inc
SPECIALTY RETAIL - Specialty Retail, Other
|
$353.04
|
+9.36
2.72% |
$355.36
|
588,157
78.84% of 50 DAV
50 DAV is 746,000
|
$368.83
-4.28%
|
3/15/2019
|
$341.27
|
PP = $322.59
|
|
MB = $338.72
|
Most Recent Note - 8/7/2019 6:54:44 PM
G - Still sputtering below its 50 DMA line ($346.55). Volume totals have been near average while still hovering near its all-time high. Reported earnings +17% on +13% sales revenues for the Apr '19 quarter, below the +25% minimum earnings guideline (C criteria), raising fundamental concerns. See the latest FSU analysis for more details and a new annotated graph.
>>> FEATURED STOCK ARTICLE : Ulta Beauty Sputtering Below 50-Day Moving Average - 8/7/2019 |
View all notes |
Set NEW NOTE alert |
Company Profile |
SEC
News |
Chart |
Request a new note
C
A
S
I |
CHGG
-
NYSE
Chegg Inc
Consumer Svcs-Education
|
$44.99
|
+1.53
3.52% |
$45.54
|
970,566
64.53% of 50 DAV
50 DAV is 1,504,000
|
$48.22
-6.70%
|
7/8/2019
|
$44.11
|
PP = $41.79
|
|
MB = $43.88
|
Most Recent Note - 8/7/2019 6:57:18 PM
Y - Volume totals have been cooling while consolidating above prior highs in the $40-41 area which define important near-term support to watch along with its 50 DMA line ($40.99). Reported earnings +92% on +26% sales revenues for the Jun '19 quarter. See the latest FSU analysis for more details and an annotated graph.
>>> FEATURED STOCK ARTICLE : Consolidating Above Prior Highs and 50-Day Average - 8/6/2019 |
View all notes |
Set NEW NOTE alert |
Company Profile |
SEC
News |
Chart |
Request a new note
C
A
S
I |
VEEV
-
NYSE
Veeva Systems Inc Cl A
Computer Sftwr-Medical
|
$163.30
|
+3.45
2.16% |
$165.13
|
1,261,558
76.27% of 50 DAV
50 DAV is 1,654,000
|
$176.90
-7.69%
|
5/30/2019
|
$154.32
|
PP = $145.80
|
|
MB = $153.09
|
Most Recent Note - 8/5/2019 4:15:49 PM
G - Undercut yet closed above the prior low ($155 on 6/27/19) as it gapped down below its 50 DMA line ($163.58) with today's 3rd consecutive loss raising greater concerns. Fundamentals remain strong.
>>> FEATURED STOCK ARTICLE : Recently Found Support Near 50-Day Moving Average - 8/1/2019 |
View all notes |
Set NEW NOTE alert |
Company Profile |
SEC
News |
Chart |
Request a new note
C
A
S
I |
Symbol/Exchange
Company Name
Industry Group |
PRICE |
CHANGE
(%Change) |
Day High |
Volume
(% DAV)
(% 50 day avg vol) |
52 Wk Hi
% From Hi |
Featured
Date |
Price
Featured |
Pivot Featured |
|
Max Buy |
PAYC
-
NYSE
Paycom Software Inc
COMPUTER SOFTWARE and SERVICES - Application Software
|
$240.47
|
+9.27
4.01% |
$241.24
|
650,759
94.45% of 50 DAV
50 DAV is 689,000
|
$246.85
-2.58%
|
2/6/2019
|
$171.66
|
PP = $164.18
|
|
MB = $172.39
|
Most Recent Note - 8/5/2019 4:09:03 PM
G - Gapped down and violated its 50 DMA line with today's volume-driven loss triggering a technical sell signal. Last week it reported earnings +27% on +31% sales revenues for the Jun '19 quarter, continuing its strong earnings track record. See the latest FSU analysis for more details and an annotated graph.
>>> FEATURED STOCK ARTICLE : Found Support and Gapped Up Following Earnings Report - 8/2/2019 |
View all notes |
Set NEW NOTE alert |
Company Profile |
SEC
News |
Chart |
Request a new note
C
A
S
I |
PLNT
-
NYSE
Planet Fitness Inc Cl A
Leisure-Services
|
$75.35
|
+3.10
4.29% |
$75.47
|
1,281,336
81.93% of 50 DAV
50 DAV is 1,564,000
|
$81.90
-8.00%
|
7/26/2019
|
$79.15
|
PP = $82.00
|
|
MB = $86.10
|
Most Recent Note - 8/7/2019 12:36:46 PM
G - Color code is changed to green after it gapped down today slumping well below its 50 DMA line ($76.70) with today's big volume-driven loss raising concerns. Reported earnings +32% on +29% sales revenues for the Jun '19 quarter continuing its strong earnings track record.
>>> FEATURED STOCK ARTICLE : Fitness Firm Forming a New Base - 7/26/2019 |
View all notes |
Set NEW NOTE alert |
Company Profile |
SEC
News |
Chart |
Request a new note
C
A
S
I |
BLD
-
NYSE
Topbuild Corp
Bldg-Constr Prds/Misc
|
$90.56
|
-0.41
-0.45% |
$92.07
|
314,097
95.76% of 50 DAV
50 DAV is 328,000
|
$91.49
-1.02%
|
5/17/2019
|
$82.19
|
PP = $87.31
|
|
MB = $91.68
|
Most Recent Note - 8/7/2019 7:00:45 PM
Y - Posted a gain with average volume today for a best-ever close, perched at its all-time high. Bullish action came after it reported earnings +39% on +9% sales revenues for the Jun '19 quarter versus the year ago period, continuing its strong earnings track record. Its gain above the pivot point on 8/02/19 was backed by +81% above average volume clinching a convincing technical buy signal. Its 50 DMA line ($81.43) and recent lows define near-term support to watch on pullbacks.
>>> FEATURED STOCK ARTICLE : Perched Near 52-Week High Finding Support - 7/25/2019 |
View all notes |
Set NEW NOTE alert |
Company Profile |
SEC
News |
Chart |
Request a new note
C
A
S
I |
TEAM
-
NASDAQ
Atlassian Corp Plc Cl A
Comp Sftwr-Spec Enterprs
|
$145.12
|
+3.22
2.27% |
$146.05
|
1,207,114
90.42% of 50 DAV
50 DAV is 1,335,000
|
$149.80
-3.12%
|
5/24/2019
|
$129.52
|
PP = $132.09
|
|
MB = $138.69
|
Most Recent Note - 8/7/2019 6:56:15 PM
Y - Posted a gain with above average volume, finding support above its 50 DMA line ($133.45). Its prior low ($123.43 on 6/25/19) defines important near-term support to watch where a violation would raise serious concerns and trigger a more worrisome technical sell signal. Reported earnings +43% on +36% sales revenues for the Jun '19 quarter, continuing its strong earnings track record.
>>> FEATURED STOCK ARTICLE : Abrupt Retreat After Getting Very Extended From Prior Base - 7/29/2019 |
View all notes |
Set NEW NOTE alert |
Company Profile |
SEC
News |
Chart |
Request a new note
C
A
S
I |
GLOB
-
NYSE
Globant SA
Computer-Tech Services
|
$107.27
|
+4.38
4.26% |
$109.80
|
569,520
178.53% of 50 DAV
50 DAV is 319,000
|
$112.33
-4.50%
|
2/15/2019
|
$69.35
|
PP = $70.00
|
|
MB = $73.50
|
Most Recent Note - 8/8/2019 10:48:54 AM
G - Found support at Its 50 DMA line ($102.41), but it has not formed a sound new base of sufficient length. Due to report earnings news on 8/15/19.
>>> FEATURED STOCK ARTICLE : Extended From Any Sound Base After Wedging Higher - 7/11/2019 |
View all notes |
Set NEW NOTE alert |
Company Profile |
SEC
News |
Chart |
Request a new note
C
A
S
I |
Symbol/Exchange
Company Name
Industry Group |
PRICE |
CHANGE
(%Change) |
Day High |
Volume
(% DAV)
(% 50 day avg vol) |
52 Wk Hi
% From Hi |
Featured
Date |
Price
Featured |
Pivot Featured |
|
Max Buy |
TTD
-
NASDAQ
The Trade Desk Inc Cl A
Comml Svcs-Advertising
|
$273.67
|
+16.44
6.39% |
$273.91
|
3,358,466
235.02% of 50 DAV
50 DAV is 1,429,000
|
$279.71
-2.16%
|
7/18/2019
|
$240.61
|
PP = $258.10
|
|
MB = $271.01
|
Most Recent Note - 8/8/2019 12:49:23 PM
Y - Showing resilience and rising back above its pivot point after undercutting the prior high ($258). The next important support to watch is its 50 DMA line ($242.60). Due to report Jun '19 quarterly results. Volume and volatility often increase near earnings news.
>>> FEATURED STOCK ARTICLE : Endured Distributional Pressure While Building on New Base - 7/18/2019 |
View all notes |
Set NEW NOTE alert |
Company Profile |
SEC
News |
Chart |
Request a new note
C
A
S
I |
PAGS
-
NYSE
Pagseguro Digital Cl A
Finance-CrdtCard/PmtPr
|
$46.97
|
+2.19
4.89% |
$47.00
|
1,816,424
80.95% of 50 DAV
50 DAV is 2,244,000
|
$48.88
-3.91%
|
6/25/2019
|
$37.69
|
PP = $40.07
|
|
MB = $42.07
|
Most Recent Note - 8/6/2019 8:54:36 PM
G - Posted a gain today with light volume. Prior high in the $40 area defines initial support to watch along with its 50 DMA line ($39.95).
>>> FEATURED STOCK ARTICLE : Encountering Distributional Pressure After Impressive Sprint - 7/30/2019 |
View all notes |
Set NEW NOTE alert |
Company Profile |
SEC
News |
Chart |
Request a new note
C
A
S
I |
|
|
|
THESE ARE NOT BUY RECOMMENDATIONS!
Comments contained in the body of this report are technical
opinions only. The material herein has been obtained
from sources believed to be reliable and accurate, however,
its accuracy and completeness cannot be guaranteed.
This site is not an investment advisor, hence it does
not endorse or recommend any securities or other investments.
Any recommendation contained in this report may not
be suitable for all investors and it is not to be deemed
an offer or solicitation on our part with respect to
the purchase or sale of any securities. All trademarks,
service marks and trade names appearing in this report
are the property of their respective owners, and are
likewise used for identification purposes only.
This report is a service available
only to active Paid Premium Members.
You may opt-out of receiving report notifications
at any time. Questions or comments may be submitted
by writing to Premium Membership Services 665 S.E. 10 Street, Suite 201 Deerfield Beach, FL 33441-5634 or by calling 1-800-965-8307
or 954-785-1121.
|
|
|

