You are not logged in.
This means you
CAN ONLY VIEW reports that were published prior to Sunday, February 25, 2024.
You
MUST UPGRADE YOUR MEMBERSHIP if you want to see any current reports.
AFTER MARKET UPDATE - MONDAY, JUNE 17TH, 2019
Previous After Market Report Next After Market Report >>>
|
|
|
|
DOW |
+22.92 |
26,112.53 |
+0.09% |
|
Volume |
681,698,190 |
-7% |
|
Volume |
1,929,444,000 |
+8% |
|
NASDAQ |
+48.36 |
7,845.02 |
+0.62% |
|
Advancers |
1,544 |
54% |
|
Advancers |
1,662 |
54% |
|
S&P 500 |
+2.69 |
2,889.67 |
+0.09% |
|
Decliners |
1,299 |
46% |
|
Decliners |
1,387 |
45% |
|
Russell 2000 |
+10.25 |
1,532.75 |
+0.67% |
|
52 Wk Highs |
153 |
|
|
52 Wk Highs |
80 |
|
|
S&P 600 |
+0.44 |
924.01 |
+0.05% |
|
52 Wk Lows |
73 |
|
|
52 Wk Lows |
89 |
|
|
 |
Nasdaq Led Major Indices Higher
Kenneth J. Gruneisen - Passed the CAN SLIM® Master's Exam
The major averages finished higher Monday as investors awaited a crucial week for geopolitical and central bank updates. The Dow added 22 points while the S&P 500 gained 0.1%. The Nasdaq Composite outperformed its peers, climbing 0.6% as Technology shares rebounded from recent weakness. The volume totals reported were mixed, lighter on the NYSE and higher on the Nasdaq exchange. Breadth was slightly positive as advancers led decliners by an 8-7 margin on the NYSE and on the Nasdaq exchange. There were 34 high-ranked companies from the Leaders List hit new 52-week highs and were listed on the BreakOuts Page, versus the total of 25 on the prior session. New 52-week highs easily outnumbered new 52-week lows on the NYSE but new lows still outnumbered new highs on the Nasdaq exchange. The major indices (M criteria) are in a "confirmed uptrend" under the fact-based system. The Featured Stocks Page provides the most timely analysis on high-ranked leaders. Charts used courtesy of www.stockcharts.com
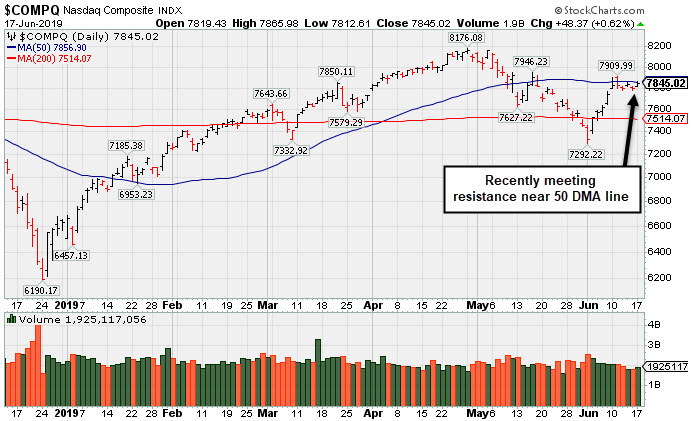
PICTURED: The Nasdaq Composite Index is perched -4% off its record high but recently has met resistance near its 50-day moving average (DMA) line.
Central bank news garnered much of the attention during the session with the Federal Reserve expected to begin their two-day policy meeting tomorrow. The Fed is widely expected to leave interest rates unchanged at the conclusion of its summit Wednesday, but investors will be fixated on Chair Jerome Powell’s post-meeting press conference for indications of future rate cuts.
On the data front, a report showed homebuilder confidence unexpectedly fell in June. In a separate release, a gauge on manufacturing activity in the New York Fed district experienced its largest monthly drop on record, falling to the lowest level since 2016. Treasuries strengthened following the report, but pared the gains to leave the yield on the 10-year note up one basis point to 2.09%.
Six of 11 S&P 500 sectors ended higher. The Communication Services group was a notable outperformer with shares of Facebook (FB +4.24%) and Netflix (NFLX +3.21%) rising. In corporate news, Pfizer (PFE +0.28%) inched higher after announcing it would buy Array Biopharma (ARRY +56.94%) for $11.4 billion. .
In commodities, WTI crude lost 1.1% to $51.95/barrel. COMEX Gold dipped 0.1% to $1,338.70 amid a modestly stronger dollar.
|
 Kenneth J. Gruneisen started out as a licensed stockbroker in August 1987, a couple of months prior to the historic stock market crash that took the Dow Jones Industrial Average down -22.6% in a single day. He has published daily fact-based fundamental and technical analysis on high-ranked stocks online for two decades. Through FACTBASEDINVESTING.COM, Kenneth provides educational articles, news, market commentary, and other information regarding proven investment systems that work in good times and bad.
Comments contained in the body of this report are technical opinions only and are not necessarily those of Gruneisen Growth Corp. The material herein has been obtained from sources believed to be reliable and accurate, however, its accuracy and completeness cannot be guaranteed. Our firm, employees, and customers may effect transactions, including transactions contrary to any recommendation herein, or have positions in the securities mentioned herein or options with respect thereto. Any recommendation contained in this report may not be suitable for all investors and it is not to be deemed an offer or solicitation on our part with respect to the purchase or sale of any securities. |
|
 |
Financials and Semiconductor Index Fell
Kenneth J. Gruneisen - Passed the CAN SLIM® Master's Exam
The Retail Index ($RLX +0.49%) posted a modest gain but the Bank Index ($BKX -1.32%) and the Broker/Dealer Index ($XBD -0.84%) both ended lower. The tech sector was mixed as the Semiconductor Index ($SOX -0.64%) edged lower while the Networking Index ($NWX +0.67%) edged higher and the Biotech Index ($BTK +2.80%) was a standout gainer. The Gold & Silver Index ($XAU +1.03%) and Oil Services Index ($OSX +2.28%) both outpaced the Integrated Oil Index ($XOI +0.36%) to the upside. Charts courtesy of www.stockcharts.com
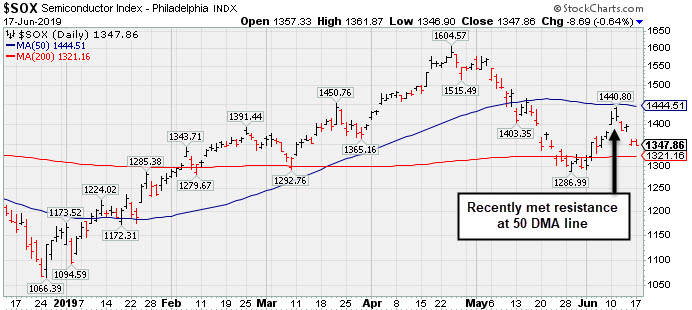 PICTURED: The Semiconductor Index ($SOX -0.64%) met resistance at its 50-day moving average (DMA) line while rebounding after a slump below its 200 DMA since peaking in April.
| Oil Services |
$OSX |
73.63 |
+1.64 |
+2.28% |
-8.65% |
| Integrated Oil |
$XOI |
1,209.25 |
+4.32 |
+0.36% |
+4.33% |
| Semiconductor |
$SOX |
1,347.86 |
-8.69 |
-0.64% |
+16.68% |
| Networking |
$NWX |
564.44 |
+3.74 |
+0.67% |
+15.51% |
| Broker/Dealer |
$XBD |
260.02 |
-2.21 |
-0.84% |
+9.56% |
| Retail |
$RLX |
2,348.89 |
+11.38 |
+0.49% |
+20.37% |
| Gold & Silver |
$XAU |
76.59 |
+0.78 |
+1.03% |
+8.39% |
| Bank |
$BKX |
95.01 |
-1.28 |
-1.33% |
+10.75% |
| Biotech |
$BTK |
4,618.75 |
+125.94 |
+2.80% |
+9.43% |
|
|
|
 |
Prior Gains Lacked Volume; 50-Day Moving Average Defines Support
Kenneth J. Gruneisen - Passed the CAN SLIM® Master's Exam
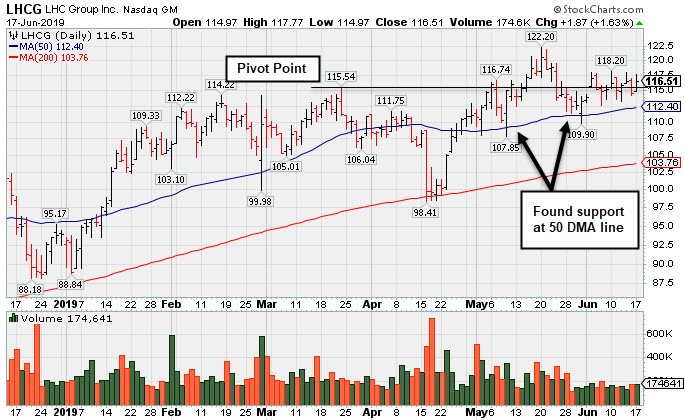
L H C Group Inc (LHCG +$1.87 or +1.63% to $116.51) quietly traded back above its pivot point with today's gain backed by lighter than average volume. Prior gains above the pivot point lacked great volume conviction indicative of institutional buying demand, so subsequent gains backed by at least +40% above average volume may help clinch a more convincing new (or add-on) technical buy signal. Its 50-day moving average DMA line ($112.40) defines near-term support.
Fundamentals remain strong after it reported earnings +56% on +73% sales revenues for the Mar '19 quarter, continuing its strong earnings track record above the +25% minimum guideline (C criteria). LHCG last shown in this FSU section on 5/14/19 with an annotated graph under the headline, "Long-Term Care Firm Hovering Near All-Time High".
Its annual earnings growth (A criteria) has been strong, and it has a current Earnings Per Share Rating of 99. The number of top-rated funds owning its shares rose from 350 in Mar '18 to 521 in Mar '19, a reassuring sign concerning the I criteria. It has earned an A Timeliness Rating and a C Sponsorship Rating. It has a small supply of only 31.5 million shares (S criteria) outstanding, which can contribute to greater volatility in the event of institutional buying or selling.
Charts courtesy of www.stockcharts.com
|
|
|
Color Codes Explained :
Y - Better candidates highlighted by our
staff of experts.
G - Previously featured
in past reports as yellow but may no longer be buyable under the
guidelines.
***Last / Change / Volume data in this table is the closing quote data***
Symbol/Exchange
Company Name
Industry Group |
PRICE |
CHANGE
(%Change) |
Day High |
Volume
(% DAV)
(% 50 day avg vol) |
52 Wk Hi
% From Hi |
Featured
Date |
Price
Featured |
Pivot Featured |
|
Max Buy |
 SPSC
-
NASDAQ
SPSC
-
NASDAQ
S P S Commerce Inc
COMPUTER SOFTWARE and SERVICES - Application Software
|
$106.16
|
+1.10
1.05% |
$107.07
|
72,280
46.94% of 50 DAV
50 DAV is 154,000
|
$115.00
-7.69%
|
6/7/2019
|
$107.72
|
PP = $115.10
|
|
MB = $120.86
|
Most Recent Note - 6/14/2019 10:09:51 AM
Y - Consolidating above its 50 DMA line ($104). Subsequent volume-driven gains above the pivot point are needed to trigger a new (or add-on) technical buy signal. Faces some resistance due to overhead supply up to the $115 level. Recent lows in the $98-99 area define important near-term support to watch. Fundamentals remain strong.
>>> FEATURED STOCK ARTICLE : Base Building Now Above 50-Day Moving Average Line - 6/7/2019 |
View all notes |
Set NEW NOTE alert |
Company Profile |
SEC
News |
Chart |
Request a new note
C
A
S
I |
EPAM
-
NYSE
Epam Systems Inc
COMPUTER SOFTWARE and SERVICES - Information Technology Service
|
$172.60
|
-1.90
-1.09% |
$175.55
|
484,388
96.30% of 50 DAV
50 DAV is 503,000
|
$180.55
-4.40%
|
5/9/2019
|
$169.25
|
PP = $180.55
|
|
MB = $189.58
|
Most Recent Note - 6/14/2019 9:56:59 AM
Y - Perched within close striking distance of its 52-week high. Subsequent gains above the pivot point backed by at least +40% above average volume may trigger a new (or add-on) technical buy signal. Rebound above its 50 DMA line ($172) helped its outlook to improve. Fundamentals remain strong. See the latest FSU analysis for more details and a new annotated graph.
>>> FEATURED STOCK ARTICLE : Perched Near Pivot Point After a New Flat Base - 6/13/2019 |
View all notes |
Set NEW NOTE alert |
Company Profile |
SEC
News |
Chart |
Request a new note
C
A
S
I |
ENV
-
NYSE
Envestnet Inc
FINANCIAL SERVICES - Diversified Investments
|
$69.30
|
+0.10
0.14% |
$70.15
|
339,596
116.30% of 50 DAV
50 DAV is 292,000
|
$72.67
-4.64%
|
3/15/2019
|
$66.05
|
PP = $64.90
|
|
MB = $68.15
|
Most Recent Note - 6/12/2019 12:05:41 PM
G - Violated its 50 DMA line ($68.72) on the prior session with a damaging volume-driven loss raising concerns. Recently reported earnings +5% on +1% sales revenues for the Mar '19 quarter, below the +25% minimum earnings guideline (C criteria). The prior high ($64.80 on 9/14/18) defines important near-term support to watch.
>>> FEATURED STOCK ARTICLE : Rebound Above 50-Day Moving Average Improved Technical Stance - 6/4/2019 |
View all notes |
Set NEW NOTE alert |
Company Profile |
SEC
News |
Chart |
Request a new note
C
A
S
I |
LHCG
-
NASDAQ
L H C Group Inc
HEALTH SERVICES - Home Health Care
|
$116.51
|
+1.87
1.63% |
$117.77
|
174,823
71.07% of 50 DAV
50 DAV is 246,000
|
$122.20
-4.66%
|
4/29/2019
|
$110.94
|
PP = $115.64
|
|
MB = $121.42
|
 Most Recent Note - 6/17/2019 5:38:30 PM
Y - Quietly traded back above its pivot point with today's gain backed by lighter than average volume. Its 50 DMA line ($112.40) defines near-term support. Fundamentals remain strong. See the latest FSU analysis for more details and a new annotated graph.
>>> FEATURED STOCK ARTICLE : Prior Gains Lacked Volume; 50-Day Moving Average Defines Support - 6/17/2019 |
View all notes |
Set NEW NOTE alert |
Company Profile |
SEC
News |
Chart |
Request a new note
C
A
S
I |
ENSG
-
NASDAQ
Ensign Group Inc
HEALTH SERVICES - Long-Term Care Facilities
|
$57.62
|
+1.01
1.78% |
$57.77
|
422,000
142.09% of 50 DAV
50 DAV is 297,000
|
$58.14
-0.89%
|
4/30/2019
|
$51.46
|
PP = $53.30
|
|
MB = $55.97
|
Most Recent Note - 6/14/2019 10:04:07 AM
Y - Showed resilience while consolidating above its 50 DMA line ($52.89) and recent lows which define near-term support to watch. Recently reported earnings +22% on +12% sales revenues for the Mar '19 quarter, below the +25% minimum earnings guideline (C criteria), raising fundamental concerns.
>>> FEATURED STOCK ARTICLE : Resilient After Latest Quarterly Report Missed Minimum Guideline - 6/3/2019 |
View all notes |
Set NEW NOTE alert |
Company Profile |
SEC
News |
Chart |
Request a new note
C
A
S
I |
Symbol/Exchange
Company Name
Industry Group |
PRICE |
CHANGE
(%Change) |
Day High |
Volume
(% DAV)
(% 50 day avg vol) |
52 Wk Hi
% From Hi |
Featured
Date |
Price
Featured |
Pivot Featured |
|
Max Buy |
CHDN
-
NASDAQ
Churchill Downs Inc
LEISURE - Gaming Activities
|
$114.19
|
-0.32
-0.28% |
$114.98
|
144,301
44.68% of 50 DAV
50 DAV is 323,000
|
$115.64
-1.25%
|
6/5/2019
|
$108.87
|
PP = $104.96
|
|
MB = $110.21
|
Most Recent Note - 6/17/2019 1:10:38 PM
G - Hovering near its all-time high, holding its ground stubbornly following a recent streak of 8 consecutive gains. Prior highs in the $104 area define initial support to watch on pullbacks. Share price was impacted by a 3:1 split when noted on 1/28/19.
>>> FEATURED STOCK ARTICLE : Consolidating Near 50-Day Moving Average - 6/29/2018 |
View all notes |
Set NEW NOTE alert |
Company Profile |
SEC
News |
Chart |
Request a new note
C
A
S
I |
LULU
-
NASDAQ
Lululemon Athletica
MANUFACTURING - Textile Manufacturing
|
$183.34
|
+6.63
3.75% |
$184.68
|
3,953,077
194.25% of 50 DAV
50 DAV is 2,035,000
|
$182.89
0.25%
|
6/13/2019
|
$174.48
|
PP = $179.60
|
|
MB = $188.58
|
Most Recent Note - 6/17/2019 12:41:37 PM
Y - Trading further above its 50 DMA line ($172.59) and rising above its pivot point challenging its all-time high with today's 3rd consecutive volume-driven gain. A gain and strong close above the pivot point backed by at least +40% above average volume may clinch a new (or add-on) technical buy signal. Reported Apr '19 quarterly earnings +35% on +20% sales revenues versus the ear ago period. Recent low ($160.88 on 5/29/19) defines important support near prior highs. See the latest FSU analysis for more details and an annotated graph.
>>> FEATURED STOCK ARTICLE : Perched Near High Following Another Strong Earnings Report - 6/14/2019 |
View all notes |
Set NEW NOTE alert |
Company Profile |
SEC
News |
Chart |
Request a new note
C
A
S
I |
ULTA
-
NASDAQ
Ulta Beauty Inc
SPECIALTY RETAIL - Specialty Retail, Other
|
$350.19
|
-4.43
-1.25% |
$357.54
|
602,485
83.33% of 50 DAV
50 DAV is 723,000
|
$359.69
-2.64%
|
3/15/2019
|
$341.27
|
PP = $322.59
|
|
MB = $338.72
|
Most Recent Note - 6/13/2019 5:17:48 PM
G - Posted a 3rd consecutive gain today with average volume as it rebounded above its 50 DMA line ($344) helping its outlook to improve. Rebounded from a deep early loss on 5/31/19 after gapping down. Reported earnings +17% on +13% sales revenues for the Apr '19 quarter, below the +25% minimum earnings guideline (C criteria), raising fundamental concerns. Faces resistance due to overhead supply up to the $359 level.
>>> FEATURED STOCK ARTICLE : Sputtering Below 50-Day Moving Average Following Sub Par Earnings - 6/6/2019 |
View all notes |
Set NEW NOTE alert |
Company Profile |
SEC
News |
Chart |
Request a new note
C
A
S
I |
ESNT
-
NYSE
Essent Group Ltd
Finance-MrtgandRel Svc
|
$47.80
|
-0.63
-1.30% |
$48.65
|
308,893
51.57% of 50 DAV
50 DAV is 599,000
|
$50.51
-5.37%
|
3/18/2019
|
$45.84
|
PP = $45.06
|
|
MB = $47.31
|
Most Recent Note - 6/17/2019 1:12:36 PM
G - Consolidating near its all-time high, it found support above its 50 DMA line ($47.14) in recent months. Recently reported earnings +15% on +20% sales revenues for the Mar '19 quarter, below the +25% minimum earnings guideline (C criteria), raising fundamental concerns.
>>> FEATURED STOCK ARTICLE : Still Hovering Not Far From 52-Week High - 6/5/2019 |
View all notes |
Set NEW NOTE alert |
Company Profile |
SEC
News |
Chart |
Request a new note
C
A
S
I |
NOW
-
NYSE
Servicenow Inc
Computer Sftwr-Enterprse
|
$274.56
|
+2.31
0.85% |
$276.38
|
986,672
56.51% of 50 DAV
50 DAV is 1,746,000
|
$281.74
-2.55%
|
4/22/2019
|
$242.64
|
PP = $251.75
|
|
MB = $264.34
|
Most Recent Note - 6/17/2019 1:18:38 PM
G - Hovering near its all-time high. Its 50 DMA line ($261) and prior high ($251.65 on 3/21/19) define near-term support to watch. Recently reported earnings +20% on +34% sales revenues for the Mar '19 quarter, below the +25% minimum earnings guideline (C criteria), raising fundamental concerns.
>>> FEATURED STOCK ARTICLE : Leader Consolidating Above 50-Day Moving Average Line - 5/29/2019 |
View all notes |
Set NEW NOTE alert |
Company Profile |
SEC
News |
Chart |
Request a new note
C
A
S
I |
Symbol/Exchange
Company Name
Industry Group |
PRICE |
CHANGE
(%Change) |
Day High |
Volume
(% DAV)
(% 50 day avg vol) |
52 Wk Hi
% From Hi |
Featured
Date |
Price
Featured |
Pivot Featured |
|
Max Buy |
QLYS
-
NASDAQ
Qualys Inc
Computer Sftwr-Security
|
$85.66
|
+0.24
0.28% |
$86.73
|
452,752
143.55% of 50 DAV
50 DAV is 315,400
|
$98.30
-12.86%
|
5/23/2019
|
$90.43
|
PP = $98.40
|
|
MB = $103.32
|
Most Recent Note - 6/17/2019 12:51:10 PM
G - Consolidating near its 50 DMA line ($86.42) after finding prompt support near its 200 DMA line. It is only -12.8% off its 52-week high, however, its Relative Strength Rating has slumped to 44, below the 80+ minimum guideline for buy candidates. Met stubborn resistance in the $97-98 area. Reported earnings +36% on +16% sales revenues for the Mar '19 quarter, continuing its strong earnings history.
>>> FEATURED STOCK ARTICLE : Encountering Distributional Pressure in Recent Weeks - 6/11/2019 |
View all notes |
Set NEW NOTE alert |
Company Profile |
SEC
News |
Chart |
Request a new note
C
A
S
I |
VEEV
-
NYSE
Veeva Systems Inc Cl A
Computer Sftwr-Medical
|
$166.46
|
+1.83
1.11% |
$167.36
|
911,610
68.08% of 50 DAV
50 DAV is 1,339,000
|
$168.46
-1.19%
|
5/30/2019
|
$154.32
|
PP = $145.80
|
|
MB = $153.09
|
Most Recent Note - 6/17/2019 1:21:23 PM
G -Very extended from any sound base and perched near its all-time high, holding its ground after 7 consecutive gains marked by volume. Reported earnings +52% on +25% sales revenues for the Apr '19 quarter, marking its 5th strong quarter with earnings above the +25% minimum guideline (C criteria).
>>> FEATURED STOCK ARTICLE : Big Volume-Driven Gain for New High Following Earnings News - 5/30/2019 |
View all notes |
Set NEW NOTE alert |
Company Profile |
SEC
News |
Chart |
Request a new note
C
A
S
I |
PAYC
-
NYSE
Paycom Software Inc
COMPUTER SOFTWARE and SERVICES - Application Software
|
$219.52
|
+5.18
2.42% |
$220.44
|
618,828
82.62% of 50 DAV
50 DAV is 749,000
|
$230.90
-4.93%
|
2/6/2019
|
$171.66
|
PP = $164.18
|
|
MB = $172.39
|
Most Recent Note - 6/17/2019 1:22:37 PM
G - Extended from any sound base, and there was a "negative reversal" on 6/10/19 after hitting a new all-time high. Its 50 DMA line ($203) defines near-term support to watch above the recent low ($194.84 on 6/03/19). Reported earnings +25% on +30% sales revenues for the Mar '19 quarter.
>>> FEATURED STOCK ARTICLE : Posted Volume-Driven Gain While Hovering Near All-Time High - 5/31/2019 |
View all notes |
Set NEW NOTE alert |
Company Profile |
SEC
News |
Chart |
Request a new note
C
A
S
I |
PYPL
-
NASDAQ
Paypal Holdings Inc
Finance-CrdtCard/PmtPr
|
$117.16
|
+0.99
0.85% |
$117.34
|
4,565,413
74.83% of 50 DAV
50 DAV is 6,101,000
|
$117.45
-0.25%
|
1/24/2019
|
$92.56
|
PP = $93.80
|
|
MB = $98.49
|
Most Recent Note - 6/14/2019 10:06:28 AM
G - Perched near its all-time high with no resistance remaining due to overhead supply. It did not form a sound base yet promptly rebounded after violating its 50 DMA line and prior low ($106.52) on 6/03/19 triggering technical sell signals. Recently reported earnings +37% on +12% sales revenues for the Mar '19 quarter, continuing its strong earnings track record.
>>> FEATURED STOCK ARTICLE : Hovering Near All Time High Extended From Any Sound Base - 5/15/2019 |
View all notes |
Set NEW NOTE alert |
Company Profile |
SEC
News |
Chart |
Request a new note
C
A
S
I |
PLNT
-
NYSE
Planet Fitness Inc Cl A
Leisure-Services
|
$80.90
|
+0.14
0.17% |
$81.66
|
937,738
66.65% of 50 DAV
50 DAV is 1,407,000
|
$81.76
-1.05%
|
11/7/2018
|
$57.10
|
PP = $55.45
|
|
MB = $58.22
|
Most Recent Note - 6/12/2019 5:31:39 PM
G - Extended from any sound base. Found support above its 50 DMA line ($75.17) and prior low during the recent consolidation. Violations would raise concerns and trigger technical sell signals. Fundamentals remain strong.
>>> FEATURED STOCK ARTICLE : Pulling Back From High After Impressive Rally - 5/23/2019 |
View all notes |
Set NEW NOTE alert |
Company Profile |
SEC
News |
Chart |
Request a new note
C
A
S
I |
Symbol/Exchange
Company Name
Industry Group |
PRICE |
CHANGE
(%Change) |
Day High |
Volume
(% DAV)
(% 50 day avg vol) |
52 Wk Hi
% From Hi |
Featured
Date |
Price
Featured |
Pivot Featured |
|
Max Buy |
BLD
-
NYSE
Topbuild Corp
Bldg-Constr Prds/Misc
|
$79.38
|
-1.76
-2.17% |
$81.10
|
378,500
118.65% of 50 DAV
50 DAV is 319,000
|
$86.96
-8.72%
|
5/17/2019
|
$82.19
|
PP = $87.31
|
|
MB = $91.68
|
Most Recent Note - 6/17/2019 5:39:52 PM
Y - Pulled back today with slightly higher volume indicative of distributional pressure. Remains within striking distance of its 52-week high. Subsequent gains above the pivot point backed by at least +40% above average volume may trigger a technical buy signal. Fundamentals remain strong.
>>> FEATURED STOCK ARTICLE : Encountered Distributional Pressure Near Prior High - 5/20/2019 |
View all notes |
Set NEW NOTE alert |
Company Profile |
SEC
News |
Chart |
Request a new note
C
A
S
I |
TEAM
-
NASDAQ
Atlassian Corp Plc Cl A
Comp Sftwr-Spec Enterprs
|
$130.65
|
+0.74
0.57% |
$131.95
|
703,028
38.37% of 50 DAV
50 DAV is 1,832,000
|
$137.78
-5.17%
|
5/24/2019
|
$129.52
|
PP = $132.09
|
|
MB = $138.69
|
Most Recent Note - 6/14/2019 10:13:02 AM
Y - Perched near its all-time high. The 50 DMA line ($118.78) and prior low ($115.87 on 6/03/19) define important neat-term support to watch. Reported earnings +133% on +38% sales revenues for the Mar '19 quarter, continuing its strong earnings track record.
>>> FEATURED STOCK ARTICLE : Perched Near All-Time High After "3-Weeks Tight" - 5/24/2019 |
View all notes |
Set NEW NOTE alert |
Company Profile |
SEC
News |
Chart |
Request a new note
C
A
S
I |
UPLD
-
NASDAQ
Upland Software Inc
Computer Sftwr-Enterprse
|
$49.69
|
+1.50
3.11% |
$49.83
|
516,341
102.04% of 50 DAV
50 DAV is 506,000
|
$54.87
-9.44%
|
6/10/2019
|
$53.30
|
PP = $50.74
|
|
MB = $53.28
|
Most Recent Note - 6/17/2019 5:46:11 PM
Y - Posted a gain today with average volume for its second best close ever. Abruptly retreated into the prior base raising concerns with volume-driven losses last week. Its 50 DMA line ($45.87) defines near-term support to watch. Highlighted in yellow in the 6/10/19 mid-day report with pivot point cited based on its 5/17/19 high plus 10 cents as it rose from an advanced ascending base. Completed a new Public Offering on 5/08/19. Quarterly comparisons through Mar '19 have shown impressive sales revenues growth and greatly improved earnings increases above the +25% minimum guideline (C criteria).
>>> FEATURED STOCK ARTICLE : Rose From an Advanced Ascending Base - 6/10/2019 |
View all notes |
Set NEW NOTE alert |
Company Profile |
SEC
News |
Chart |
Request a new note
C
A
S
I |
GLOB
-
NYSE
Globant SA
Computer-Tech Services
|
$101.46
|
+1.96
1.97% |
$101.62
|
296,106
75.35% of 50 DAV
50 DAV is 393,000
|
$102.24
-0.76%
|
2/15/2019
|
$69.35
|
PP = $70.00
|
|
MB = $73.50
|
Most Recent Note - 6/17/2019 5:41:53 PM
G - Posted a small gain today with below average volume for a best-ever close. Very extended from any sound base. Its 50 DMA line ($85.76) defines important support where a violation would raise concerns and trigger a technical sell signal. Fundamentals remain strong.
>>> FEATURED STOCK ARTICLE : Posted Big Gain for Another New High Close - 6/12/2019 |
View all notes |
Set NEW NOTE alert |
Company Profile |
SEC
News |
Chart |
Request a new note
C
A
S
I |
|
|
|
THESE ARE NOT BUY RECOMMENDATIONS!
Comments contained in the body of this report are technical
opinions only. The material herein has been obtained
from sources believed to be reliable and accurate, however,
its accuracy and completeness cannot be guaranteed.
This site is not an investment advisor, hence it does
not endorse or recommend any securities or other investments.
Any recommendation contained in this report may not
be suitable for all investors and it is not to be deemed
an offer or solicitation on our part with respect to
the purchase or sale of any securities. All trademarks,
service marks and trade names appearing in this report
are the property of their respective owners, and are
likewise used for identification purposes only.
This report is a service available
only to active Paid Premium Members.
You may opt-out of receiving report notifications
at any time. Questions or comments may be submitted
by writing to Premium Membership Services 665 S.E. 10 Street, Suite 201 Deerfield Beach, FL 33441-5634 or by calling 1-800-965-8307
or 954-785-1121.
|
|
|

