You are not logged in.
This means you
CAN ONLY VIEW reports that were published prior to Monday, February 26, 2024.
You
MUST UPGRADE YOUR MEMBERSHIP if you want to see any current reports.
AFTER MARKET UPDATE - THURSDAY, MAY 19TH, 2022
Previous After Market Report Next After Market Report >>>
|
|
|
|
DOW |
-236.94 |
31,253.13 |
-0.75% |
|
Volume |
1,109,758,614 |
-3% |
|
Volume |
5,111,870,300 |
+2% |
|
NASDAQ |
-29.66 |
11,388.50 |
-0.26% |
|
Advancers |
1,598 |
52% |
|
Advancers |
2,411 |
55% |
|
S&P 500 |
-22.89 |
3,900.79 |
-0.58% |
|
Decliners |
1,487 |
48% |
|
Decliners |
1,953 |
45% |
|
Russell 2000 |
+1.38 |
1,776.22 |
+0.08% |
|
52 Wk Highs |
9 |
|
|
52 Wk Highs |
8 |
|
|
S&P 600 |
-5.77 |
1,176.22 |
-0.49% |
|
52 Wk Lows |
323 |
|
|
52 Wk Lows |
359 |
|
|
Damaging losses quickly negated Tuesday's follow-through day and signaled a continuation of the market correction (M criteria). New buying efforts should be avoided until more decisive strength returns.
|
 |
Major Indices Lose More Ground While Market Leadership Thins
Kenneth J. Gruneisen - Passed the CAN SLIM® Master's Exam
The S&P 500 fell 0.6% after suffering its worst session since June 2020 (-4%) yesterday, and now sits within 1.5% of bear market territory (defined as a 20% drop from a recent peak). The Dow shed 236 points, while the Nasdaq Composite lost 0.3%. Volume totals reported were mixed, lighter than the prior session on the NYSE and higher on the Nasdaq exchange. Advancers led decliners by just a narrow margin on the NYSE and by a 6-5 margin on the Nasdaq exchange. Leadership was thin as there were 5 high-ranked companies from the Leaders List that hit new 52-week highs and were listed on the BreakOuts Page, versus 11 on the prior session. New 52-week lows totals still solidly outnumbered the very short lists of new 52-week highs on both the NYSE and the Nasdaq exchange. The damaging losses for the major indices effectively negated Tuesday's noted follow-through day, quickly signaling a continuation of the market correction (M criteria).
Chart courtesy of www.stockcharts.com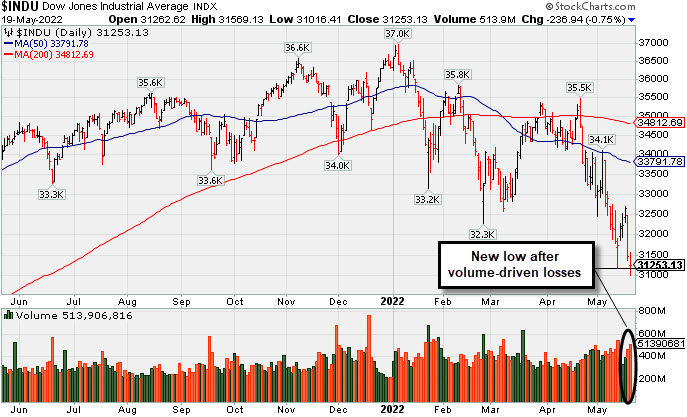 PICTURED: The Dow Jones Industrial Average suffered another damaging loss on higher volume, erasing recent gains and slumping to a new 2022 low.
U.S. stocks finished lower during a choppy session Thursday as worries over inflation and tighter monetary policy incited a cautious tone. Corporate earnings reports from high-profile retailers have disappointed in recent days, with both Target Corp. (TGT -5.06%) and Walmart Inc. (WMT -2.74%) flagging higher costs and signs of weakening consumer spending.
Treasuries strengthened, with the 10-year note yield down three basis points (0.03%) to 2.85%. In FOREX trading, the U.S. dollar fell 1.0% against a basket of its peers. On the data front, weekly initial jobless claims came in at 218,000, unexpectedly rising to the highest level since January. Still, continuing claims dropped to the lowest level since 1969 in the week ending May 7, underscoring a still-robust labor market. Separately, the Philadelphia Fed Business Outlook slumped more than forecasted in May to 2.6, the lowest level in two years. Finally, the leading index of economic indicators unexpectedly dipped 0.3% in April, while existing home sales declined 2.4% during the month.
In corporate news, Kohl’s Corp. (KSS +4.43%) rose after executives alluded to the possibility of multiple takeover bids following a downward revision to its full-year guidance. Meanwhile, Cisco Systems Inc. (CSCO -13.73%) gapped down after warning that lingering supply chain issues should adversely impact current-quarter results. Elsewhere, shares of Under Armour Inc. (UA -15.76%) saw a double-digit percentage decline after unexpectedly announcing the departure of its CEO.
|
 Kenneth J. Gruneisen started out as a licensed stockbroker in August 1987, a couple of months prior to the historic stock market crash that took the Dow Jones Industrial Average down -22.6% in a single day. He has published daily fact-based fundamental and technical analysis on high-ranked stocks online for two decades. Through FACTBASEDINVESTING.COM, Kenneth provides educational articles, news, market commentary, and other information regarding proven investment systems that work in good times and bad.
Comments contained in the body of this report are technical opinions only and are not necessarily those of Gruneisen Growth Corp. The material herein has been obtained from sources believed to be reliable and accurate, however, its accuracy and completeness cannot be guaranteed. Our firm, employees, and customers may effect transactions, including transactions contrary to any recommendation herein, or have positions in the securities mentioned herein or options with respect thereto. Any recommendation contained in this report may not be suitable for all investors and it is not to be deemed an offer or solicitation on our part with respect to the purchase or sale of any securities. |
|
 |
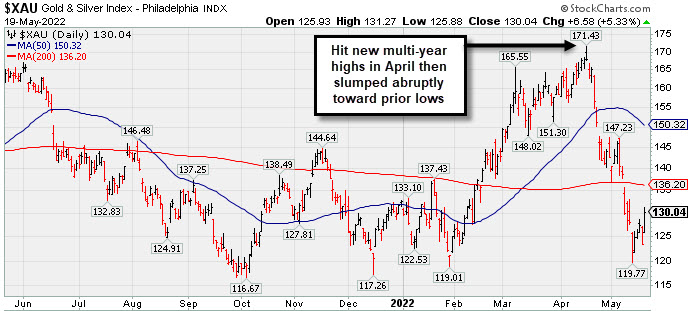
Gold & Silver Index Rebounded With a Standout Gain
Kenneth J. Gruneisen - Passed the CAN SLIM® Master's Exam
The Gold & Silver Index ($XAU +5.33%) posted a standout gain while the Oil Services Index ($OSX -0.11%) and Integrated Oil Index ($XOI +0.05%) both finished flat. The Biotech Index ($BTK +1.02%) led the tech sector, meanwhile the Semiconductor Index ($SOX -0.61%) edged lower and the Networking Index ($NWX -2.91%) suffered a larger loss. The Broker/Dealer Index ($XBD +1.18%) rose while the Bank Index ($BKX -0.45%) edged lower and the Retail Index ($RLX +0.29%) posted a small gain.
PICTURED: The Gold & Silver Index ($XAU +5.33%) rebounded impressively on Thursday. It abruptly slumped after hitting new multi-year highs in April, quickly falling near prior lows.
| Oil Services |
$OSX |
74.32 |
-0.08 |
-0.11% |
+40.97% |
| Integrated Oil |
$XOI |
1,661.78 |
+0.77 |
+0.05% |
+41.04% |
| Semiconductor |
$SOX |
2,890.33 |
-17.63 |
-0.61% |
-26.76% |
| Networking |
$NWX |
715.12 |
-21.45 |
-2.91% |
-26.36% |
| Broker/Dealer |
$XBD |
391.58 |
+4.58 |
+1.18% |
-19.57% |
| Retail |
$RLX |
2,902.48 |
+8.26 |
+0.29% |
-31.33% |
| Gold & Silver |
$XAU |
130.04 |
+6.58 |
+5.33% |
-1.82% |
| Bank |
$BKX |
106.57 |
-0.48 |
-0.45% |
-19.40% |
| Biotech |
$BTK |
4,526.08 |
+45.73 |
+1.02% |
-17.98% |
|
|
|
 |
Featured Stocks
Kenneth J. Gruneisen - Passed the CAN SLIM® Master's Exam
|
|
|
Color Codes Explained :
Y - Better candidates highlighted by our
staff of experts.
G - Previously featured
in past reports as yellow but may no longer be buyable under the
guidelines.
***Last / Change / Volume data in this table is the closing quote data***
Symbol/Exchange
Company Name
Industry Group |
PRICE |
CHANGE
(%Change) |
Day High |
Volume
(% DAV)
(% 50 day avg vol) |
52 Wk Hi
% From Hi |
Featured
Date |
Price
Featured |
Pivot Featured |
|
Max Buy |
 LLY
-
NYSE
LLY
-
NYSE
Eli Lilly & Co
Medical-Diversified
|
$286.27
|
-8.92
-3.02% |
$293.58
|
3,128,620
106.02% of 50 DAV
50 DAV is 2,951,000
|
$314.00
-8.83%
|
5/16/2022
|
$302.46
|
PP = $314.10
|
|
MB = $329.81
|
 Most Recent Note - 5/19/2022 4:54:30 PM
G - Slumping after challenging its 52-week high, violating its 50 DMA line ($290.62) with a loss on higher volume today triggering a technical sell signal and its color code is changed to green. Only a prompt rebound above the 50 DMA line would help its outlook improve. Highlighted in yellow in the 5/16/222 mid-day report with pivot point cited based on its 4/07/22 high plus 10 cents. Three of the past 4 quarterly comparisons were above the +25% minimum earnings guideline (C criteria).
>>> FEATURED STOCK ARTICLE : Eli Lilly & Co Challenges All-Time High - 5/16/2022 |
View all notes |
Set NEW NOTE alert |
Company Profile |
SEC
News |
Chart |
Request a new note
C
A
S
I |
CI
-
NYSE
Cigna Corp
Medical-Managed Care
|
$256.88
|
-0.69
-0.27% |
$259.15
|
1,673,628
109.60% of 50 DAV
50 DAV is 1,527,000
|
$271.71
-5.46%
|
5/6/2022
|
$263.52
|
PP = $269.97
|
|
MB = $283.47
|
Most Recent Note - 5/18/2022 2:28:09 PM
Y - Down considerably today without great volume conviction amid widespread market weakness. Challenged its all-time high with this week's gains on average volume. Subsequent gains above the pivot point backed by at least +40% above average volume may trigger a technical buy signal. Reported a strong +27% earnings increase on +7% sales revenues for the Mar '22 quarter versus the year ago period, its 3rd strong quarterly comparison above the +25% minimum guideline (C criteria). Annual earnings growth (A criteria) has been strong.
>>> FEATURED STOCK ARTICLE : Cigna Rises Near All-Time High - 5/6/2022 |
View all notes |
Set NEW NOTE alert |
Company Profile |
SEC
News |
Chart |
Request a new note
C
A
S
I |
IMKTA
-
NASDAQ
Ingles Markets Inc Cl A
RETAIL - Grocery Stores
|
$84.67
|
-0.85
-0.99% |
$86.86
|
155,280
131.59% of 50 DAV
50 DAV is 118,000
|
$101.98
-16.97%
|
4/11/2022
|
$96.25
|
PP = $95.75
|
|
MB = $100.54
|
Most Recent Note - 5/18/2022 12:24:23 PM
G - Slumping further below its 50 DMA line ($93.04) with today's 6th consecutive loss also violating the prior low ($90.53 on 5/05/22) raising concerns and triggering a more worrisome technical sell signal. Reported Mar '22 quarterly earnings +40% on +16% sales revenues versus the year ago period.
>>> FEATURED STOCK ARTICLE : Ingles Markets Perched Near High With Earnings News Due - 5/4/2022 |
View all notes |
Set NEW NOTE alert |
Company Profile |
SEC
News |
Chart |
Request a new note
C
A
S
I |
PAG
-
NYSE
Penske Automotive Grp
Retail/Whlsle-Automobile
|
$108.90
|
+0.11
0.10% |
$110.79
|
375,244
110.37% of 50 DAV
50 DAV is 340,000
|
$119.47
-8.85%
|
5/13/2022
|
$114.88
|
PP = $114.57
|
|
MB = $120.30
|
Most Recent Note - 5/18/2022 2:26:13 PM
Y - Down considerably today without great volume conviction, negating the recent technical breakout amid widespread market weakness. Its 50 DMA line ($102.49) defines near term support below prior highs.
>>> FEATURED STOCK ARTICLE : Breakout With Volume-Driven Gain to New High - 5/13/2022 |
View all notes |
Set NEW NOTE alert |
Company Profile |
SEC
News |
Chart |
Request a new note
C
A
S
I |
WCC
-
NYSE
Wesco International Inc
WHOLESALE - Electronics Wholesale
|
$120.68
|
-0.45
-0.37% |
$123.24
|
391,410
82.58% of 50 DAV
50 DAV is 474,000
|
$144.43
-16.44%
|
4/21/2022
|
$135.54
|
PP = $139.10
|
|
MB = $146.06
|
Most Recent Note - 5/18/2022 2:30:17 PM
G - Quietly undercutting its 200 DMA line ($124) again with today's loss on light volume. Prior lows in the $115 area define important near-term support to watch. A rebound above its 50 DMA line ($126.56) is needed for its outlook to improve. Reported Mar '22 quarterly earnings +154% on +22% sales revenues versus the year ago period. See the latest FSU analysis for more details and an annotated graph.
>>> FEATURED STOCK ARTICLE : Stalled After Recent Breakout But Remains Near High - 5/17/2022 |
View all notes |
Set NEW NOTE alert |
Company Profile |
SEC
News |
Chart |
Request a new note
C
A
S
I |
Symbol/Exchange
Company Name
Industry Group |
PRICE |
CHANGE
(%Change) |
Day High |
Volume
(% DAV)
(% 50 day avg vol) |
52 Wk Hi
% From Hi |
Featured
Date |
Price
Featured |
Pivot Featured |
|
Max Buy |
IMXI
-
NASDAQ
International Money Exp
Financial Svcs-Specialty
|
$19.32
|
-0.52
-2.62% |
$20.01
|
291,306
70.71% of 50 DAV
50 DAV is 412,000
|
$22.86
-15.49%
|
3/8/2022
|
$18.64
|
PP = $19.06
|
|
MB = $20.01
|
Most Recent Note - 5/19/2022 4:55:37 PM
G - Slumped today with below average volume. Only a prompt rebound above the 50 DMA line ($20.24) would help its outlook improve. Recently testing prior highs which help define important near term support to watch. More damaging losses would raise concerns and trigger a more worrisome technical sell signal.
>>> FEATURED STOCK ARTICLE : Fell Below 50-Day Moving Average Line Testing Prior Highs - 5/12/2022 |
View all notes |
Set NEW NOTE alert |
Company Profile |
SEC
News |
Chart |
Request a new note
C
A
S
I |
|
|
|
THESE ARE NOT BUY RECOMMENDATIONS!
Comments contained in the body of this report are technical
opinions only. The material herein has been obtained
from sources believed to be reliable and accurate, however,
its accuracy and completeness cannot be guaranteed.
This site is not an investment advisor, hence it does
not endorse or recommend any securities or other investments.
Any recommendation contained in this report may not
be suitable for all investors and it is not to be deemed
an offer or solicitation on our part with respect to
the purchase or sale of any securities. All trademarks,
service marks and trade names appearing in this report
are the property of their respective owners, and are
likewise used for identification purposes only.
This report is a service available
only to active Paid Premium Members.
You may opt-out of receiving report notifications
at any time. Questions or comments may be submitted
by writing to Premium Membership Services 665 S.E. 10 Street, Suite 201 Deerfield Beach, FL 33441-5634 or by calling 1-800-965-8307
or 954-785-1121.
|
|
|