You are not logged in.
This means you
CAN ONLY VIEW reports that were published prior to Tuesday, April 8, 2025.
You
MUST UPGRADE YOUR MEMBERSHIP if you want to see any current reports.
AFTER MARKET UPDATE - WEDNESDAY, MAY 18TH, 2022
Previous After Market Report Next After Market Report >>>
|
|
|
|
DOW |
-1,164.52 |
31,490.07 |
-3.57% |
|
Volume |
1,139,568,298 |
+12% |
|
Volume |
5,020,085,700 |
-1% |
|
NASDAQ |
-566.37 |
11,418.15 |
-4.73% |
|
Advancers |
485 |
16% |
|
Advancers |
977 |
23% |
|
S&P 500 |
-165.17 |
3,923.68 |
-4.04% |
|
Decliners |
2,587 |
84% |
|
Decliners |
3,215 |
77% |
|
Russell 2000 |
-65.45 |
1,774.85 |
-3.56% |
|
52 Wk Highs |
24 |
|
|
52 Wk Highs |
17 |
|
|
S&P 600 |
-38.83 |
1,182.08 |
-3.18% |
|
52 Wk Lows |
346 |
|
|
52 Wk Lows |
352 |
|
|
Wednesday's damaging losses quickly negated Tuesday's follow-through day and signaled a continuation of the market correction (M criteria). New buying efforts should be avoided until more decisive strength returns.
|
 |
Weak Major Averages Signal Continuing Market Correction
Kenneth J. Gruneisen - Passed the CAN SLIM® Master's Exam
Both the Dow and S&P 500 suffered their steepest percentage declines since June 2020, sliding 3.6% (or 1,164 points) and 4%, respectively. The latter narrowly avoided bear market territory (defined as a 20% drawdown from a recent peak). The Nasdaq Composite tumbled 4.7%, now 28.9% below its November 19 record. Volume totals reported were mixed, higher than the prior session on the NYSE and lighter on the Nasdaq exchange. Decliners led advancers by more than a 5-1 margin on the NYSE and by more than a 3-1 margin on the Nasdaq exchange. There were 11 high-ranked companies from the Leaders List that hit new 52-week highs and were listed on the BreakOuts Page, versus 25 on the prior session. New 52-week lows totals still solidly outnumbered new 52-week highs on both the NYSE and the Nasdaq exchange. The damaging losses for the major indices effectively negated Tuesday's noted follow-through day, quickly signaling a continuation of the market correction (M criteria).
Chart courtesy of www.stockcharts.com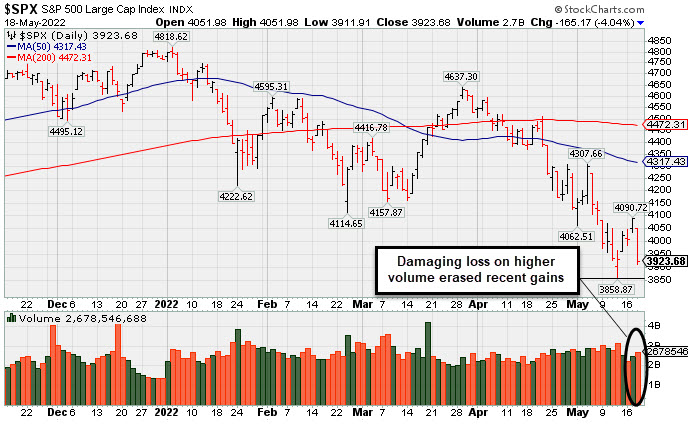 PICTURED: The S&P 500 Index suffered a damaging loss on higher volume that erased its recent gains.
U.S. stocks finished firmly lower on Wednesday, relinquishing gains seen in recent sessions as corporate earnings from key retailers highlighted the persistence of inflationary pressures. Target Corp. (TGT -24.93%) slumped for its worst session since 1987 after its profit tally disappointed consensus estimates as the company coped with higher costs. The results mirrored those of competitor Walmart Inc. (WMT -6.79%), with the big-box retailer slashing its full-year outlook as higher food prices especially squeezed its margins.
All 11 S&P 500 sectors closed in negative territory, with the Consumer Staples and Consumer Discretionary groups shedding the most. TJX Companies Inc. (TJX +7.12%) bucked the downtrend, rallying as its solid margin performance and earnings guidance overshadowed softer-than-expected sales.
Perceived safe haven assets caught a bid amid the decidedly risk off tone. A gauge of the U.S. dollar gained 0.5%, while Treasuries recouped some of yesterday’s losses. The yield on the 10-year note fell 10 basis points (0.10%) to 2.88%. Shorter-dated yields remained elevated after Federal Reserve Chair Jerome Powell yesterday stated that the central bank "won’t hesitate" to tighten policy into restrictive territory, if necessary, in order to tame inflation. On the data front, housing starts slipped a smaller-than-projected 0.2% in April, while building permits shrank 3.2% during the same period. Separately, mortgage applications fell 11% in the latest week.
|
 Kenneth J. Gruneisen started out as a licensed stockbroker in August 1987, a couple of months prior to the historic stock market crash that took the Dow Jones Industrial Average down -22.6% in a single day. He has published daily fact-based fundamental and technical analysis on high-ranked stocks online for two decades. Through FACTBASEDINVESTING.COM, Kenneth provides educational articles, news, market commentary, and other information regarding proven investment systems that work in good times and bad.
Comments contained in the body of this report are technical opinions only and are not necessarily those of Gruneisen Growth Corp. The material herein has been obtained from sources believed to be reliable and accurate, however, its accuracy and completeness cannot be guaranteed. Our firm, employees, and customers may effect transactions, including transactions contrary to any recommendation herein, or have positions in the securities mentioned herein or options with respect thereto. Any recommendation contained in this report may not be suitable for all investors and it is not to be deemed an offer or solicitation on our part with respect to the purchase or sale of any securities. |
|
 |
Retail, Financial, Tech, and Commodity-Linked Groups Fell
Kenneth J. Gruneisen - Passed the CAN SLIM® Master's Exam
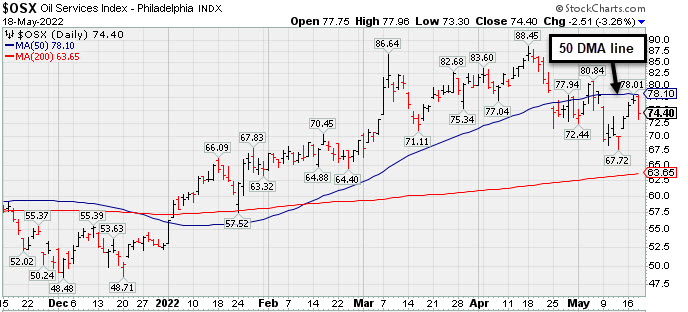
The Retail Index ($RLX -7.41%) was a standout decliner and financial stocks were also weak as the Broker/Dealer Index ($XBD -3.86%) and Bank Index ($BKX -2.88%) both weighed on the major averages. The tech sector saw unanimous losses from the Semiconductor Index ($SOX -5.17%), Networking Index ($NWX -3.81%), and the Biotech Index ($BTK -3.11%). Commodity-linked groups had a negative bias as the Oil Services Index ($OSX -3.26%), Integrated Oil Index ($XOI -2.63%), and Gold & Silver Index ($XAU -3.03%) lost ground.
PICTURED: The Oil Services Index ($OSX -3.26%) slumped after meeting resistance near its 50-day moving average (DMA) line.
| Oil Services |
$OSX |
74.40 |
-2.51 |
-3.26% |
+41.12% |
| Integrated Oil |
$XOI |
1,661.01 |
-44.78 |
-2.63% |
+40.98% |
| Semiconductor |
$SOX |
2,907.96 |
-158.54 |
-5.17% |
-26.31% |
| Networking |
$NWX |
736.57 |
-29.18 |
-3.81% |
-24.15% |
| Broker/Dealer |
$XBD |
387.00 |
-15.52 |
-3.86% |
-20.51% |
| Retail |
$RLX |
2,894.22 |
-231.72 |
-7.41% |
-31.52% |
| Gold & Silver |
$XAU |
123.46 |
-3.86 |
-3.03% |
-6.79% |
| Bank |
$BKX |
107.05 |
-3.18 |
-2.88% |
-19.03% |
| Biotech |
$BTK |
4,480.34 |
-143.66 |
-3.11% |
-18.81% |
|
|
|
 |
Featured Stocks
Kenneth J. Gruneisen - Passed the CAN SLIM® Master's Exam
|
|
|
Color Codes Explained :
Y - Better candidates highlighted by our
staff of experts.
G - Previously featured
in past reports as yellow but may no longer be buyable under the
guidelines.
***Last / Change / Volume data in this table is the closing quote data***
Symbol/Exchange
Company Name
Industry Group |
PRICE |
CHANGE
(%Change) |
Day High |
Volume
(% DAV)
(% 50 day avg vol) |
52 Wk Hi
% From Hi |
Featured
Date |
Price
Featured |
Pivot Featured |
|
Max Buy |
 LLY
-
NYSE
LLY
-
NYSE
Eli Lilly & Co
Medical-Diversified
|
$295.19
|
-6.21
-2.06% |
$302.60
|
2,152,722
72.31% of 50 DAV
50 DAV is 2,977,000
|
$314.00
-5.99%
|
5/16/2022
|
$302.46
|
PP = $314.10
|
|
MB = $329.81
|
Most Recent Note - 5/16/2022 5:10:17 PM
Y - Challenged its 52-week high today but finished near the middle of its intra-day range after highlighted in yellow in the earlier mid-day report with pivot point cited based on its 4/07/22 high plus 10 cents. Found support near prior highs and its 50 DMA line ($289) during a 6-week consolidation. Reported Mar '22 quarterly earnings +63% on +15% sales revenues versus the year ago period. Three of the past 4 quarterly comparisons were above the +25% minimum earnings guideline (C criteria). See the latest FSU analysis for more details and a new annotated graph.
>>> FEATURED STOCK ARTICLE : Eli Lilly & Co Challenges All-Time High - 5/16/2022 |
View all notes |
Set NEW NOTE alert |
Company Profile |
SEC
News |
Chart |
Request a new note
C
A
S
I |
CI
-
NYSE
Cigna Corp
Medical-Managed Care
|
$257.57
|
-13.78
-5.08% |
$270.00
|
2,533,352
167.22% of 50 DAV
50 DAV is 1,515,000
|
$271.71
-5.20%
|
5/6/2022
|
$263.52
|
PP = $269.97
|
|
MB = $283.47
|
 Most Recent Note - 5/18/2022 2:28:09 PM
Y - Down considerably today without great volume conviction amid widespread market weakness. Challenged its all-time high with this week's gains on average volume. Subsequent gains above the pivot point backed by at least +40% above average volume may trigger a technical buy signal. Reported a strong +27% earnings increase on +7% sales revenues for the Mar '22 quarter versus the year ago period, its 3rd strong quarterly comparison above the +25% minimum guideline (C criteria). Annual earnings growth (A criteria) has been strong.
>>> FEATURED STOCK ARTICLE : Cigna Rises Near All-Time High - 5/6/2022 |
View all notes |
Set NEW NOTE alert |
Company Profile |
SEC
News |
Chart |
Request a new note
C
A
S
I |
IMKTA
-
NASDAQ
Ingles Markets Inc Cl A
RETAIL - Grocery Stores
|
$85.52
|
-6.16
-6.72% |
$90.41
|
184,188
157.43% of 50 DAV
50 DAV is 117,000
|
$101.98
-16.14%
|
4/11/2022
|
$96.25
|
PP = $95.75
|
|
MB = $100.54
|
Most Recent Note - 5/18/2022 12:24:23 PM
G - Slumping further below its 50 DMA line ($93.04) with today's 6th consecutive loss also violating the prior low ($90.53 on 5/05/22) raising concerns and triggering a more worrisome technical sell signal. Reported Mar '22 quarterly earnings +40% on +16% sales revenues versus the year ago period.
>>> FEATURED STOCK ARTICLE : Ingles Markets Perched Near High With Earnings News Due - 5/4/2022 |
View all notes |
Set NEW NOTE alert |
Company Profile |
SEC
News |
Chart |
Request a new note
C
A
S
I |
PAG
-
NYSE
Penske Automotive Grp
Retail/Whlsle-Automobile
|
$108.79
|
-9.18
-7.78% |
$115.63
|
395,334
116.62% of 50 DAV
50 DAV is 339,000
|
$116.72
-6.79%
|
5/13/2022
|
$114.88
|
PP = $114.57
|
|
MB = $120.30
|
Most Recent Note - 5/18/2022 2:26:13 PM
Y - Down considerably today without great volume conviction, negating the recent technical breakout amid widespread market weakness. Its 50 DMA line ($102.49) defines near term support below prior highs.
>>> FEATURED STOCK ARTICLE : Breakout With Volume-Driven Gain to New High - 5/13/2022 |
View all notes |
Set NEW NOTE alert |
Company Profile |
SEC
News |
Chart |
Request a new note
C
A
S
I |
WCC
-
NYSE
Wesco International Inc
WHOLESALE - Electronics Wholesale
|
$121.13
|
-5.18
-4.10% |
$127.06
|
360,136
74.87% of 50 DAV
50 DAV is 481,000
|
$144.43
-16.13%
|
4/21/2022
|
$135.54
|
PP = $139.10
|
|
MB = $146.06
|
Most Recent Note - 5/18/2022 2:30:17 PM
G - Quietly undercutting its 200 DMA line ($124) again with today's loss on light volume. Prior lows in the $115 area define important near-term support to watch. A rebound above its 50 DMA line ($126.56) is needed for its outlook to improve. Reported Mar '22 quarterly earnings +154% on +22% sales revenues versus the year ago period. See the latest FSU analysis for more details and an annotated graph.
>>> FEATURED STOCK ARTICLE : Stalled After Recent Breakout But Remains Near High - 5/17/2022 |
View all notes |
Set NEW NOTE alert |
Company Profile |
SEC
News |
Chart |
Request a new note
C
A
S
I |
Symbol/Exchange
Company Name
Industry Group |
PRICE |
CHANGE
(%Change) |
Day High |
Volume
(% DAV)
(% 50 day avg vol) |
52 Wk Hi
% From Hi |
Featured
Date |
Price
Featured |
Pivot Featured |
|
Max Buy |
IMXI
-
NASDAQ
International Money Exp
Financial Svcs-Specialty
|
$19.84
|
+0.27
1.38% |
$20.08
|
326,703
77.23% of 50 DAV
50 DAV is 423,000
|
$22.86
-13.21%
|
3/8/2022
|
$18.64
|
PP = $19.06
|
|
MB = $20.01
|
Most Recent Note - 5/17/2022 5:50:36 PM
G - Posted a gain today with a higher volume total but still below average. Only a prompt rebound above the 50 DMA line ($20.18) would help its outlook improve. Recently testing prior highs which help define important near term support to watch. More damaging losses would raise concerns and trigger a more worrisome technical sell signal.
>>> FEATURED STOCK ARTICLE : Fell Below 50-Day Moving Average Line Testing Prior Highs - 5/12/2022 |
View all notes |
Set NEW NOTE alert |
Company Profile |
SEC
News |
Chart |
Request a new note
C
A
S
I |
|
|
|
THESE ARE NOT BUY RECOMMENDATIONS!
Comments contained in the body of this report are technical
opinions only. The material herein has been obtained
from sources believed to be reliable and accurate, however,
its accuracy and completeness cannot be guaranteed.
This site is not an investment advisor, hence it does
not endorse or recommend any securities or other investments.
Any recommendation contained in this report may not
be suitable for all investors and it is not to be deemed
an offer or solicitation on our part with respect to
the purchase or sale of any securities. All trademarks,
service marks and trade names appearing in this report
are the property of their respective owners, and are
likewise used for identification purposes only.
This report is a service available
only to active Paid Premium Members.
You may opt-out of receiving report notifications
at any time. Questions or comments may be submitted
by writing to Premium Membership Services 665 S.E. 10 Street, Suite 201 Deerfield Beach, FL 33441-5634 or by calling 1-800-965-8307
or 954-785-1121.
|
|
|