You are not logged in.
This means you
CAN ONLY VIEW reports that were published prior to Friday, April 4, 2025.
You
MUST UPGRADE YOUR MEMBERSHIP if you want to see any current reports.
AFTER MARKET UPDATE - THURSDAY, MAY 12TH, 2022
Previous After Market Report Next After Market Report >>>
|
|
|
|
DOW |
-103.81 |
31,730.30 |
-0.33% |
|
Volume |
1,338,044,950 |
+11% |
|
Volume |
6,649,278,200 |
+8% |
|
NASDAQ |
+6.73 |
11,370.96 |
+0.06% |
|
Advancers |
1,601 |
51% |
|
Advancers |
2,310 |
54% |
|
S&P 500 |
-5.10 |
3,930.08 |
-0.13% |
|
Decliners |
1,508 |
48% |
|
Decliners |
1,966 |
46% |
|
Russell 2000 |
+21.24 |
1,739.38 |
+1.24% |
|
52 Wk Highs |
4 |
|
|
52 Wk Highs |
11 |
|
|
S&P 600 |
+14.02 |
1,161.44 |
+1.22% |
|
52 Wk Lows |
1,044 |
|
|
52 Wk Lows |
1,714 |
|
|
The market remains in a correction (M criteria). Reducing market exposure and raising cash is prudent until a new confirmed rally is noted.
|
 |
Major Indices Sputtered and Rebounded From Deeper Lows
Kenneth J. Gruneisen - Passed the CAN SLIM® Master's Exam
The S&P 500 eased 0.1%, trimming intraday losses that had pushed the index within striking distance of bear market territory (defined as a 20% slide from a recent high). The Dow lost 103 points, on course for a seventh consecutive weekly decline which would be its longest such losing streak since 2001. The Nasdaq Composite reversed earlier losses to finish just above the flat line, but remains 29.2% below its November 19 peak. Volume totals reported were higher than the prior session on the NYSE and on the Nasdaq exchange. Advancers led decliners by a narrow margin on the NYSE but decliners led advancers by about a 6-5 margin on the Nasdaq exchange. There was 1 high-ranked company from the Leaders List that hit a new 52-week high and was listed on the BreakOuts Page, versus 2 on the prior session. New 52-week lows totals expanded and solidly outnumbered shorter lists of new 52-week highs on both the NYSE and the Nasdaq exchange. The major indices are still in a market correction (M criteria). Followers of the fact-based investment system know to watch for a follow-through day on Day 4-7 of a new rally attempt which could signal a new confirmed uptrend.
Chart courtesy of www.stockcharts.com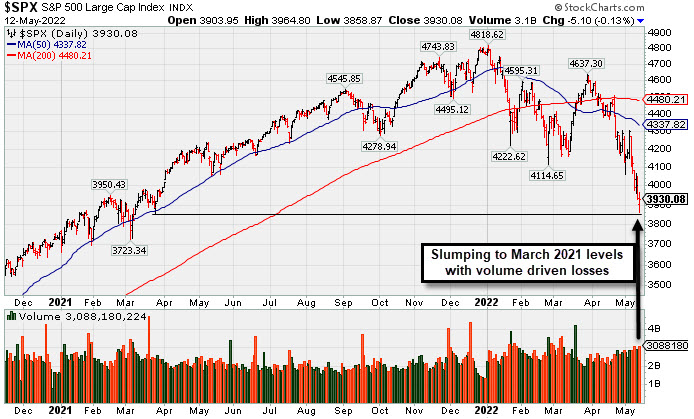 PICTURED: The S&P 500 Index slumped to a new 2022 low, falling near March 2021 levels. It is down -18.4% from the January 1, 2022 record high.
U.S. stocks weathered another volatile session on Thursday as investors continued to parse elevated inflation readings. The Producer Price Index (PPI) rose 0.5% in April, in-line with estimates and below the prior 1.6% advance. Year-over-year prices rose a larger-than-expected 11.0% during the period. Yesterday, a closely-watched report showed consumer prices climbed a hotter-than-expected 8.3% year-over-year in April, hovering near a four-decade high. Components of the release highlighted the persistence of a broad array of underlying price pressures, bolstering expectations for a more aggressive path of Federal Reserve rate hikes. A perceived risk off mood pushed a gauge of the U.S. dollar up 0.9% to a fresh 20-year high. Treasuries also caught a bid, with the 10-year note yield down four basis points (0.04%) to 2.87%, on track to have declined 26 basis points (0.26%) for the week.
Information Technology stocks underperformed with Apple Inc. (AAPL -2.69%) slumping, now down more than -20% from an all-time high. In earnings, Walt Disney Co. (DIS -0.86%) fell after the media giant posted profit and revenue below consensus estimates and lowered its growth expectations for the second half of the year.
|
 Kenneth J. Gruneisen started out as a licensed stockbroker in August 1987, a couple of months prior to the historic stock market crash that took the Dow Jones Industrial Average down -22.6% in a single day. He has published daily fact-based fundamental and technical analysis on high-ranked stocks online for two decades. Through FACTBASEDINVESTING.COM, Kenneth provides educational articles, news, market commentary, and other information regarding proven investment systems that work in good times and bad.
Comments contained in the body of this report are technical opinions only and are not necessarily those of Gruneisen Growth Corp. The material herein has been obtained from sources believed to be reliable and accurate, however, its accuracy and completeness cannot be guaranteed. Our firm, employees, and customers may effect transactions, including transactions contrary to any recommendation herein, or have positions in the securities mentioned herein or options with respect thereto. Any recommendation contained in this report may not be suitable for all investors and it is not to be deemed an offer or solicitation on our part with respect to the purchase or sale of any securities. |
|
 |
Retail and Biotech Indexes Rose While Gold & Silver Index Slumped
Kenneth J. Gruneisen - Passed the CAN SLIM® Master's Exam
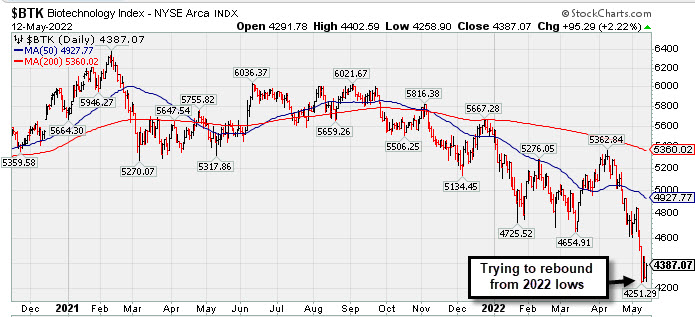
The Gold & Silver Index ($XAU -4.54%) was a standout decliner. Energy-linked shares edged lower as the Oil Services Index ($OSX -0.35%) and Integrated Oil Index ($XOI -0.16%) each ended slightly in the red. The Retail Index ($RLX +1.84%) posted a solid gain. The Biotech Index ($BTK +2.22%) led the tech sector while the Semiconductor Index ($SOX +0.54%) posted a smaller gain and the Networking Index ($NWX -0.07%) finished flat. Financials were mixed as the Broker/Dealer Index ($XBD +0.25%) inched higher while the Bank Index ($BKX -0.59%) edged lower.
PICTURED: The Biotech Index ($BTK +2.22%) is trying to rebound from a new 2022 low.
| Oil Services |
$OSX |
70.12 |
-0.24 |
-0.35% |
+33.01% |
| Integrated Oil |
$XOI |
1,600.05 |
-2.50 |
-0.16% |
+35.80% |
| Semiconductor |
$SOX |
2,827.21 |
+15.27 |
+0.54% |
-28.36% |
| Networking |
$NWX |
723.01 |
-0.50 |
-0.07% |
-25.55% |
| Broker/Dealer |
$XBD |
384.51 |
+0.95 |
+0.25% |
-21.02% |
| Retail |
$RLX |
2,980.98 |
+53.84 |
+1.84% |
-29.47% |
| Gold & Silver |
$XAU |
122.19 |
-5.82 |
-4.54% |
-7.75% |
| Bank |
$BKX |
106.17 |
-0.63 |
-0.59% |
-19.71% |
| Biotech |
$BTK |
4,387.07 |
+95.29 |
+2.22% |
-20.50% |
|
|
|
 |
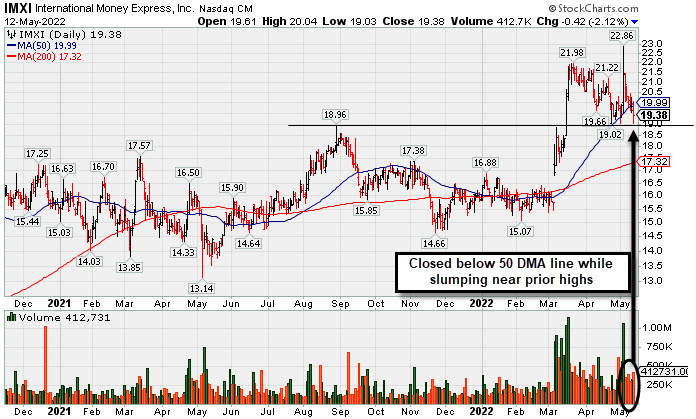
Fell Below 50-Day Moving Average Line Testing Prior Highs
Kenneth J. Gruneisen - Passed the CAN SLIM® Master's Exam
International Money Express (IMXI -$0.42 or -2.12% to $19.38) fell today and closed below its 50-day moving average (DMA) line ($19.99) while testing prior highs which help define important near term support to watch. Only a prompt rebound above the 50 DMA line would help its outlook. More damaging losses would raise concerns and trigger a more worrisome technical sell signal.
IMXI reported Mar '22 quarterly earnings +26% on +21% sales revenues versus the year ago period. The Financial Services-Specialty firm's quarterly and annual earnings (C and A criteria) history has been strong and backed by solid sales revenues growth. The past 7 quarterly comparisons showed earnings increases above the year ago period by more than +25% (C criteria). Annual earnings growth has been strong and it has a 95 Earnings Per Share Rating.
IMXI was highlighted in yellow in the 3/08/22 mid-day report (read here) with pivot point cited based on its 8/30/21 high plus 10 cents. It was last shown with detailed analysis on 3/24/22 with an annotated graph under the headline, "Consolidating After Rally From Previously Noted Base".
There is a small supply of only 38.3 million shares outstanding (S criteria) which can contribute to greater price volatility in the event of institutional buying or selling. The number of top-rated funds owning its shares rose from 210 in Mar '21 to 263 in Mar '221, a reassuring sign concerning the I criteria. Its current Up/Down Volume Ratio of 1.3 is an unbiased indication its shares have been under accumulation over the past 50 days.
|
|
|
Color Codes Explained :
Y - Better candidates highlighted by our
staff of experts.
G - Previously featured
in past reports as yellow but may no longer be buyable under the
guidelines.
***Last / Change / Volume data in this table is the closing quote data***
Symbol/Exchange
Company Name
Industry Group |
PRICE |
CHANGE
(%Change) |
Day High |
Volume
(% DAV)
(% 50 day avg vol) |
52 Wk Hi
% From Hi |
Featured
Date |
Price
Featured |
Pivot Featured |
|
Max Buy |
 CI
-
NYSE
CI
-
NYSE
Cigna Corp
Medical-Managed Care
|
$260.03
|
-0.17
-0.07% |
$260.73
|
1,675,324
111.02% of 50 DAV
50 DAV is 1,509,000
|
$272.81
-4.68%
|
5/6/2022
|
$263.52
|
PP = $269.97
|
|
MB = $283.47
|
Most Recent Note - 5/11/2022 6:18:36 PM
Y - Pulled back today for a 3rd consecutive small loss on lighter volume while perched within close striking distance of its all-time high. Subsequent gains above the pivot point backed by at least +40% above average volume may trigger a technical buy signal. Reported a strong +27% earnings increase on +7% sales revenues for the Mar '22 quarter versus the year ago period, its 3rd strong quarterly comparison above the +25% minimum guideline (C criteria). Annual earnings growth (A criteria) has been strong.
>>> FEATURED STOCK ARTICLE : Cigna Rises Near All-Time High - 5/6/2022 |
View all notes |
Set NEW NOTE alert |
Company Profile |
SEC
News |
Chart |
Request a new note
C
A
S
I |
IMKTA
-
NASDAQ
Ingles Markets Inc Cl A
RETAIL - Grocery Stores
|
$93.78
|
-0.52
-0.55% |
$95.36
|
103,547
87.01% of 50 DAV
50 DAV is 119,000
|
$101.98
-8.04%
|
4/11/2022
|
$96.25
|
PP = $95.75
|
|
MB = $100.54
|
Most Recent Note - 5/11/2022 6:19:58 PM
Y - Reversed an early gain today and closed near the session low. Its 50 DMA line ($92.73) and prior lows define important near-term support. More damaging losses would raise concerns and trigger a technical sell signal. Reported Mar '22 quarterly earnings +40% on +16% sales revenues versus the year ago period.
>>> FEATURED STOCK ARTICLE : Ingles Markets Perched Near High With Earnings News Due - 5/4/2022 |
View all notes |
Set NEW NOTE alert |
Company Profile |
SEC
News |
Chart |
Request a new note
C
A
S
I |
WCC
-
NYSE
Wesco International Inc
WHOLESALE - Electronics Wholesale
|
$120.07
|
-0.46
-0.38% |
$121.64
|
859,122
180.87% of 50 DAV
50 DAV is 475,000
|
$144.43
-16.87%
|
4/21/2022
|
$135.54
|
PP = $139.10
|
|
MB = $146.06
|
Most Recent Note - 5/11/2022 6:17:30 PM
G - Color code is changed to green after slumping below its 50 and 200 DMA lines raising concerns with today's 3rd consecutive volume-driven loss. Prior lows in the $115 define near-term support, meanwhile a rebound above the 50 DMA line is needed for its outlook to improve. Members were cautioned - "New buying efforts may only be considered after a solid follow-through day confirms a new market uptrend (M criteria)." Reported Mar '22 quarterly earnings +154% on +22% sales revenues versus the year ago period. Volume and volatility often increase near earnings news.
>>> FEATURED STOCK ARTICLE : Approaching Prior Highs Where it Met Resistance - 4/21/2022 |
View all notes |
Set NEW NOTE alert |
Company Profile |
SEC
News |
Chart |
Request a new note
C
A
S
I |
IMXI
-
NASDAQ
International Money Exp
Financial Svcs-Specialty
|
$19.38
|
-0.42
-2.12% |
$20.04
|
412,731
97.11% of 50 DAV
50 DAV is 425,000
|
$22.86
-15.22%
|
3/8/2022
|
$18.64
|
PP = $19.06
|
|
MB = $20.01
|
 Most Recent Note - 5/12/2022 6:19:59 PM
G - Fell today and closed below its 50-day moving average (DMA) line ($19.99) while testing prior highs which help define important near term support to watch. Only a prompt rebound above the 50 DMA line would help its outlook. More damaging losses would raise concerns and trigger a more worrisome technical sell signal. See the latest FSU analysis for more details and a new annotated graph.
>>> FEATURED STOCK ARTICLE : Fell Below 50-Day Moving Average Line Testing Prior Highs - 5/12/2022 |
View all notes |
Set NEW NOTE alert |
Company Profile |
SEC
News |
Chart |
Request a new note
C
A
S
I |
|
|
|
THESE ARE NOT BUY RECOMMENDATIONS!
Comments contained in the body of this report are technical
opinions only. The material herein has been obtained
from sources believed to be reliable and accurate, however,
its accuracy and completeness cannot be guaranteed.
This site is not an investment advisor, hence it does
not endorse or recommend any securities or other investments.
Any recommendation contained in this report may not
be suitable for all investors and it is not to be deemed
an offer or solicitation on our part with respect to
the purchase or sale of any securities. All trademarks,
service marks and trade names appearing in this report
are the property of their respective owners, and are
likewise used for identification purposes only.
This report is a service available
only to active Paid Premium Members.
You may opt-out of receiving report notifications
at any time. Questions or comments may be submitted
by writing to Premium Membership Services 665 S.E. 10 Street, Suite 201 Deerfield Beach, FL 33441-5634 or by calling 1-800-965-8307
or 954-785-1121.
|
|
|