You are not logged in.
This means you
CAN ONLY VIEW reports that were published prior to Thursday, April 3, 2025.
You
MUST UPGRADE YOUR MEMBERSHIP if you want to see any current reports.
AFTER MARKET UPDATE - MONDAY, MAY 16TH, 2022
Previous After Market Report Next After Market Report >>>
|
|
|
|
DOW |
+26.76 |
32,223.42 |
+0.08% |
|
Volume |
945,544,044 |
-15% |
|
Volume |
4,857,839,700 |
-17% |
|
NASDAQ |
-142.21 |
11,662.79 |
-1.20% |
|
Advancers |
1,593 |
51% |
|
Advancers |
1,960 |
44% |
|
S&P 500 |
-15.88 |
4,008.01 |
-0.39% |
|
Decliners |
1,554 |
49% |
|
Decliners |
2,524 |
56% |
|
Russell 2000 |
-9.24 |
1,783.43 |
-0.52% |
|
52 Wk Highs |
32 |
|
|
52 Wk Highs |
21 |
|
|
S&P 600 |
-4.17 |
1,185.16 |
-0.35% |
|
52 Wk Lows |
188 |
|
|
52 Wk Lows |
334 |
|
|
The market remains in a correction (M criteria). Reducing market exposure and raising cash is prudent until a new confirmed rally is noted.
|
 |
Mixed Action Leaves Major Indices Still Sputtering
Kenneth J. Gruneisen - Passed the CAN SLIM® Master's Exam
The S&P 500 dipped 0.4% on the heels of its longest weekly losing streak since June 2011. The Nasdaq Composite retreated 1.2%, having dropped more than 27% from its November 19 peak. The Dow added 26 points following a seventh consecutive weekly drawdown--its worst stretch since 2001. Volume totals reported were lighter than the prior session on the NYSE and on the Nasdaq exchange. Advancers led decliners by a very narrow margin on the NYSE while decliners led advancers by a 5-4 margin on the Nasdaq exchange. There were 17 high-ranked companies from the Leaders List that hit new 52-week highs and were listed on the BreakOuts Page, versus 6 on the prior session. New 52-week lows totals still solidly outnumbered new 52-week highs on both the NYSE and the Nasdaq exchange. The major indices are still in a market correction (M criteria). Followers of the fact-based investment system know to watch for a follow-through day on Day 4-7 of a new rally attempt which could signal a new confirmed uptrend.
Chart courtesy of www.stockcharts.com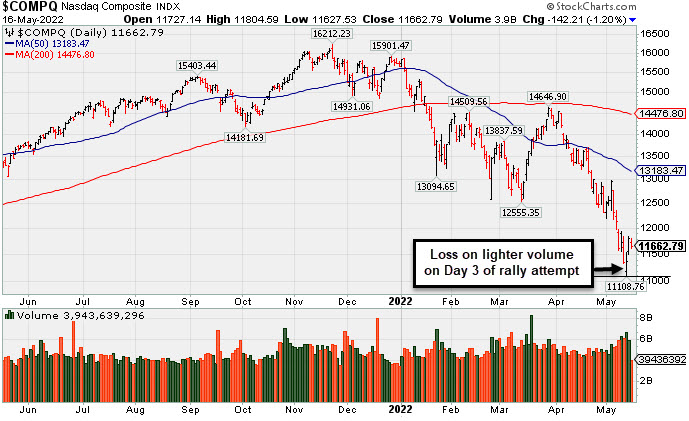 PICTURED: The Nasdaq Composite Index lost ground with lighter volume on Monday, which marked Day 3 for the tech-heavy index during the latest rally attempt. At Thursday's low before a "positive reversal" it had slumped -31.5% from the November 22, 2021 record high.
U.S. stocks finished mixed on Monday as Wall Street grappled with economic growth concerns. The major averages wavered ahead of tomorrow’s update on retail sales, along with remarks from Federal Reserve (Fed) Chair Jerome Powell. Some high-profile retail earnings will also be in focus. Treasuries caught a bid, with the yield on the 10-year note down six basis points (0.06%) to 2.88%.
In commodities, West Texas Intermediate crude climbed 3.3% to $114.09/barrel despite disappointing data out of China. Both industrial production and consumer spending in the world’s second largest economy fell to the lowest levels since the start of the pandemic amid ongoing COVID-19 lockdowns. Domestically, the New York Fed empire manufacturing survey unexpectedly contracted for the second time in three months.
Seven of 11 S&P 500 sectors closed in negative territory, with Consumer Discretionary shares losing the most. Energy outperformed, while the more traditionally defensive groups also bucked the downtrend. In corporate news, Twitter Inc. (TWTR -8.18%) sank on worries Elon Musk may not complete his takeover deal of the social media company. Elsewhere, Eli Lilly and Co. (LLY +2.7%) rose after its Type 2 diabetes drug was granted approval by the FDA (Food and Drug Administration). In M&A news, Spirit Airlines Inc. (SAVE +13.49%) rose after JetBlue Airways Corp. (JBLU -6.06%) announced a tender offer to purchase its competitor for $30 per share.
|
 Kenneth J. Gruneisen started out as a licensed stockbroker in August 1987, a couple of months prior to the historic stock market crash that took the Dow Jones Industrial Average down -22.6% in a single day. He has published daily fact-based fundamental and technical analysis on high-ranked stocks online for two decades. Through FACTBASEDINVESTING.COM, Kenneth provides educational articles, news, market commentary, and other information regarding proven investment systems that work in good times and bad.
Comments contained in the body of this report are technical opinions only and are not necessarily those of Gruneisen Growth Corp. The material herein has been obtained from sources believed to be reliable and accurate, however, its accuracy and completeness cannot be guaranteed. Our firm, employees, and customers may effect transactions, including transactions contrary to any recommendation herein, or have positions in the securities mentioned herein or options with respect thereto. Any recommendation contained in this report may not be suitable for all investors and it is not to be deemed an offer or solicitation on our part with respect to the purchase or sale of any securities. |
|
 |
Commodity-Linked Groups Rose While Other Groups Fell
Kenneth J. Gruneisen - Passed the CAN SLIM® Master's Exam
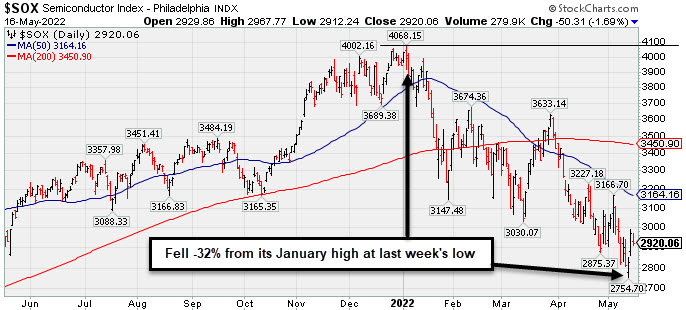
Commodity-linked groups had a positive bias as the Oil Services Index ($OSX +3.49%) and Integrated Oil Index ($XOI +1.96%) both outpaced the Gold & Silver Index ($XAU +0.75%). The Biotech Index ($BTK +0.13%) finished flat while the Semiconductor Index ($SOX -1.69%) and Networking Index ($NWX -1.45%) both lost ground. The Retail Index ($RLX -1.08%), Bank Index ($BKX -1.13%), and Broker/Dealer Index ($XBD -1.77%) each lost ground.
PICTURED: The Semiconductor Index ($SOX -1.69%) traded down as much as -32% from its January high at last week's low.
| Oil Services |
$OSX |
75.94 |
+2.56 |
+3.49% |
+44.04% |
| Integrated Oil |
$XOI |
1,691.61 |
+32.57 |
+1.96% |
+43.58% |
| Semiconductor |
$SOX |
2,920.06 |
-50.31 |
-1.69% |
-26.00% |
| Networking |
$NWX |
740.34 |
-10.86 |
-1.45% |
-23.76% |
| Broker/Dealer |
$XBD |
392.38 |
-7.05 |
-1.77% |
-19.41% |
| Retail |
$RLX |
3,057.78 |
-33.23 |
-1.08% |
-27.65% |
| Gold & Silver |
$XAU |
125.81 |
+0.94 |
+0.75% |
-5.02% |
| Bank |
$BKX |
106.10 |
-1.22 |
-1.13% |
-19.76% |
| Biotech |
$BTK |
4,527.30 |
+5.72 |
+0.13% |
-17.96% |
|
|
|
 |
Eli Lilly & Co Challenges All-Time High
Kenneth J. Gruneisen - Passed the CAN SLIM® Master's Exam
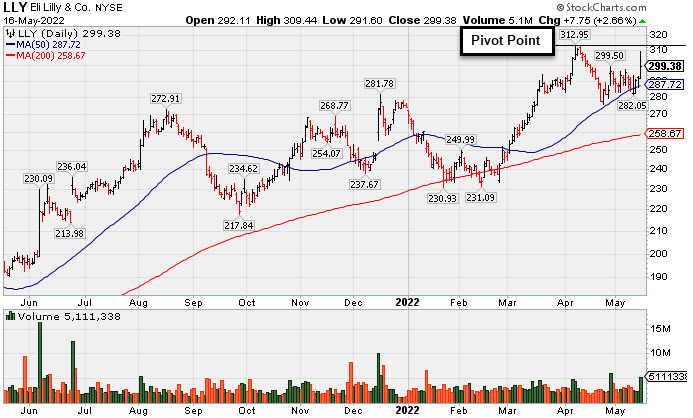
Eli Lilly & Co (LLY +$7.75 or +2.66% to $299.38) was highlighted in yellow with pivot point cited based on its 4/07/22 high plus 10 cents in the earlier mid-day report (read here). It challenged its 52-week high with its early gain but finished near the middle of the session's trading range. LLY found support near prior highs and its 50-day moving average (DMA) line ($289) during a 6-week consolidation. Subsequent gains and a close above the pivot point backed by at least +40% above average volume may trigger a technical buy signal. Members have been repeatedly cautioned - "New buying efforts may only be considered after a solid follow-through day confirms a new market uptrend (M criteria) under the fact-based investment system. Follow this closely in the daily market commentaries."LLY has a 95 Earnings Per Share Rating, well above the 80+ minimum for buy candidates. It reported Mar '22 quarterly earnings +63% on +15% sales revenues versus the year ago period. Three of the past 4 quarterly comparisons were above the +25% minimum earnings guideline (C criteria). Annual earnings (A criteria) improved steadily since a downturn in FY '14.
This giant Medical - Diversified firm was last covered in greater detail on 1/19/22 with an annotated graph under the headline, "Stalled and Slumped Well Below 50 DMA Line". It was dropped from the Featured Stocks list on 1/24/22 yet found support near its 200 DMA line then rebounded and rose to new highs.
The number of top-rated funds owning its shares rose from 3,055 in Dec '20 to 3,554 in Mar '22, a reassuring sign concerning the I criteria. Its current Up/Down Volume Ratio of 1.2 is an unbiased indication its shares have been under slight accumulation over the past 50 days. It has a Timeliness Rating of A and a Sponsorship Rating of B. There are 952.3 million shares outstanding, making it an unlikely sprinter, while it is also well-recognized already by the institutional crowd. |
|
|
Color Codes Explained :
Y - Better candidates highlighted by our
staff of experts.
G - Previously featured
in past reports as yellow but may no longer be buyable under the
guidelines.
***Last / Change / Volume data in this table is the closing quote data***
Symbol/Exchange
Company Name
Industry Group |
PRICE |
CHANGE
(%Change) |
Day High |
Volume
(% DAV)
(% 50 day avg vol) |
52 Wk Hi
% From Hi |
Featured
Date |
Price
Featured |
Pivot Featured |
|
Max Buy |
 LLY
-
NYSE
LLY
-
NYSE
Eli Lilly & Co
Medical-Diversified
|
$299.38
|
+7.75
2.66% |
$309.44
|
5,101,686
172.65% of 50 DAV
50 DAV is 2,955,000
|
$314.00
-4.66%
|
5/16/2022
|
$302.46
|
PP = $314.10
|
|
MB = $329.81
|
 Most Recent Note - 5/16/2022 5:10:17 PM
Y - Challenged its 52-week high today but finished near the middle of its intra-day range after highlighted in yellow in the earlier mid-day report with pivot point cited based on its 4/07/22 high plus 10 cents. Found support near prior highs and its 50 DMA line ($289) during a 6-week consolidation. Reported Mar '22 quarterly earnings +63% on +15% sales revenues versus the year ago period. Three of the past 4 quarterly comparisons were above the +25% minimum earnings guideline (C criteria). See the latest FSU analysis for more details and a new annotated graph.
>>> FEATURED STOCK ARTICLE : Eli Lilly & Co Challenges All-Time High - 5/16/2022 |
View all notes |
Set NEW NOTE alert |
Company Profile |
SEC
News |
Chart |
Request a new note
C
A
S
I |
CI
-
NYSE
Cigna Corp
Medical-Managed Care
|
$266.49
|
+7.30
2.82% |
$269.44
|
1,538,973
101.45% of 50 DAV
50 DAV is 1,517,000
|
$269.97
-1.29%
|
5/6/2022
|
$263.52
|
PP = $269.97
|
|
MB = $283.47
|
Most Recent Note - 5/16/2022 5:06:09 PM
Y - Today's gain with average volume halted a streak of 5 consecutive small losses. It is perched within close striking distance of its all-time high. Subsequent gains above the pivot point backed by at least +40% above average volume may trigger a technical buy signal. Reported a strong +27% earnings increase on +7% sales revenues for the Mar '22 quarter versus the year ago period, its 3rd strong quarterly comparison above the +25% minimum guideline (C criteria). Annual earnings growth (A criteria) has been strong.
>>> FEATURED STOCK ARTICLE : Cigna Rises Near All-Time High - 5/6/2022 |
View all notes |
Set NEW NOTE alert |
Company Profile |
SEC
News |
Chart |
Request a new note
C
A
S
I |
IMKTA
-
NASDAQ
Ingles Markets Inc Cl A
RETAIL - Grocery Stores
|
$92.70
|
-0.51
-0.55% |
$93.95
|
116,434
97.84% of 50 DAV
50 DAV is 119,000
|
$101.98
-9.10%
|
4/11/2022
|
$96.25
|
PP = $95.75
|
|
MB = $100.54
|
Most Recent Note - 5/16/2022 5:14:27 PM
G - Color code is changed to green after it quietly inched below its 50 DMA line ($92.73). Today's 4th consecutive loss with below average volume nearly tested the prior low ($90.53 on 5/05/22) defining important near-term support. More damaging losses would raise concerns and trigger a more worrisome technical sell signal. Reported Mar '22 quarterly earnings +40% on +16% sales revenues versus the year ago period.
>>> FEATURED STOCK ARTICLE : Ingles Markets Perched Near High With Earnings News Due - 5/4/2022 |
View all notes |
Set NEW NOTE alert |
Company Profile |
SEC
News |
Chart |
Request a new note
C
A
S
I |
PAG
-
NYSE
Penske Automotive Grp
Retail/Whlsle-Automobile
|
$115.54
|
-0.40
-0.35% |
$116.58
|
281,487
81.35% of 50 DAV
50 DAV is 346,000
|
$114.57
0.85%
|
5/13/2022
|
$114.88
|
PP = $114.57
|
|
MB = $120.30
|
Most Recent Note - 5/16/2022 5:19:37 PM
Y - Volume was below average today as it stubbornly held its ground. On the prior session it hit a new all-time high with a big gain and strong close above the pivot point backed by +89% above average volume triggering a technical buy signal. New buying efforts may only be considered after a solid follow-through day confirms a new market uptrend (M criteria) under the fact-based investment system. Follow this closely in the daily market commentaries. Reported earnings +113% on +21% sales revenues for the Mar '22 quarter versus the year ago period. Recent quarterly earnings were well above the +25% minimum guideline (C criteria). Annual earnings (A criteria) history has been strong. See the latest FSU analysis for more details and an annotated graph.
>>> FEATURED STOCK ARTICLE : Breakout With Volume-Driven Gain to New High - 5/13/2022 |
View all notes |
Set NEW NOTE alert |
Company Profile |
SEC
News |
Chart |
Request a new note
C
A
S
I |
WCC
-
NYSE
Wesco International Inc
WHOLESALE - Electronics Wholesale
|
$122.03
|
-2.64
-2.12% |
$125.45
|
484,940
99.37% of 50 DAV
50 DAV is 488,000
|
$144.43
-15.51%
|
4/21/2022
|
$135.54
|
PP = $139.10
|
|
MB = $146.06
|
Most Recent Note - 5/16/2022 5:21:22 PM
G - Quietly sputtering below its 50 and 200 DMA lines again. Prior lows in the $115 area define important near-term support to watch, meanwhile a rebound above the 50 DMA line ($126) is needed for its outlook to improve. Members were cautioned - "New buying efforts may only be considered after a solid follow-through day confirms a new market uptrend (M criteria)." Reported Mar '22 quarterly earnings +154% on +22% sales revenues versus the year ago period. Volume and volatility often increase near earnings news.
>>> FEATURED STOCK ARTICLE : Approaching Prior Highs Where it Met Resistance - 4/21/2022 |
View all notes |
Set NEW NOTE alert |
Company Profile |
SEC
News |
Chart |
Request a new note
C
A
S
I |
Symbol/Exchange
Company Name
Industry Group |
PRICE |
CHANGE
(%Change) |
Day High |
Volume
(% DAV)
(% 50 day avg vol) |
52 Wk Hi
% From Hi |
Featured
Date |
Price
Featured |
Pivot Featured |
|
Max Buy |
IMXI
-
NASDAQ
International Money Exp
Financial Svcs-Specialty
|
$19.11
|
-0.50
-2.55% |
$19.74
|
217,574
50.25% of 50 DAV
50 DAV is 433,000
|
$22.86
-16.40%
|
3/8/2022
|
$18.64
|
PP = $19.06
|
|
MB = $20.01
|
Most Recent Note - 5/16/2022 5:16:06 PM
G - Fell further below its 50-day moving average (DMA) line ($20.139) with lighter volume behind today's loss. Testing prior highs which help define important near term support to watch. Only a prompt rebound above the 50 DMA line would help its outlook improve. More damaging losses would raise concerns and trigger a more worrisome technical sell signal.
>>> FEATURED STOCK ARTICLE : Fell Below 50-Day Moving Average Line Testing Prior Highs - 5/12/2022 |
View all notes |
Set NEW NOTE alert |
Company Profile |
SEC
News |
Chart |
Request a new note
C
A
S
I |
|
|
|
THESE ARE NOT BUY RECOMMENDATIONS!
Comments contained in the body of this report are technical
opinions only. The material herein has been obtained
from sources believed to be reliable and accurate, however,
its accuracy and completeness cannot be guaranteed.
This site is not an investment advisor, hence it does
not endorse or recommend any securities or other investments.
Any recommendation contained in this report may not
be suitable for all investors and it is not to be deemed
an offer or solicitation on our part with respect to
the purchase or sale of any securities. All trademarks,
service marks and trade names appearing in this report
are the property of their respective owners, and are
likewise used for identification purposes only.
This report is a service available
only to active Paid Premium Members.
You may opt-out of receiving report notifications
at any time. Questions or comments may be submitted
by writing to Premium Membership Services 665 S.E. 10 Street, Suite 201 Deerfield Beach, FL 33441-5634 or by calling 1-800-965-8307
or 954-785-1121.
|
|
|