You are not logged in.
This means you
CAN ONLY VIEW reports that were published prior to Friday, April 4, 2025.
You
MUST UPGRADE YOUR MEMBERSHIP if you want to see any current reports.
AFTER MARKET UPDATE - TUESDAY, MAY 17TH, 2022
Previous After Market Report Next After Market Report >>>
|
|
|
|
DOW |
+431.17 |
32,654.59 |
+1.34% |
|
Volume |
1,019,940,778 |
+8% |
|
Volume |
5,057,035,700 |
+4% |
|
NASDAQ |
+321.73 |
11,984.52 |
+2.76% |
|
Advancers |
2,281 |
74% |
|
Advancers |
3,291 |
74% |
|
S&P 500 |
+80.84 |
4,088.85 |
+2.02% |
|
Decliners |
821 |
26% |
|
Decliners |
1,133 |
26% |
|
Russell 2000 |
+56.87 |
1,840.30 |
+3.19% |
|
52 Wk Highs |
50 |
|
|
52 Wk Highs |
26 |
|
|
S&P 600 |
+35.75 |
1,220.91 |
+3.02% |
|
52 Wk Lows |
171 |
|
|
52 Wk Lows |
203 |
|
|
Tuesday's gains with higher volume and an increase in leadership (new highs) marked a follow-through day that confirmed a new uptrend for the market (M criteria). New buying efforts may be considered only in stocks meeting all key criteria of the fact-based investment system.
|
 |
Follow Through Gains May Be Recognized as Confirming New Uptrend
Kenneth J. Gruneisen - Passed the CAN SLIM® Master's Exam
The Dow added 431 points, while the S&P 500 climbed 2%. The Nasdaq Composite rallied 2.8% amid strength in tech shares. Volume totals reported were higher than the prior session on the NYSE and on the Nasdaq exchange, indicating an encouraging increase in institutional buying demand. Advancers led decliners by almost a 3-1 margin on the NYSE and on the Nasdaq exchange. Leadership improved as there were 25 high-ranked companies from the Leaders List that hit new 52-week highs and were listed on the BreakOuts Page, versus 17 on the prior session. New 52-week lows totals still solidly outnumbered new 52-week highs on both the NYSE and the Nasdaq exchange. The gains for the major indices with higher volume, coupled with more leadership, marked a follow-through day confirming a new uptrend in market direction (M criteria).
Chart courtesy of www.stockcharts.com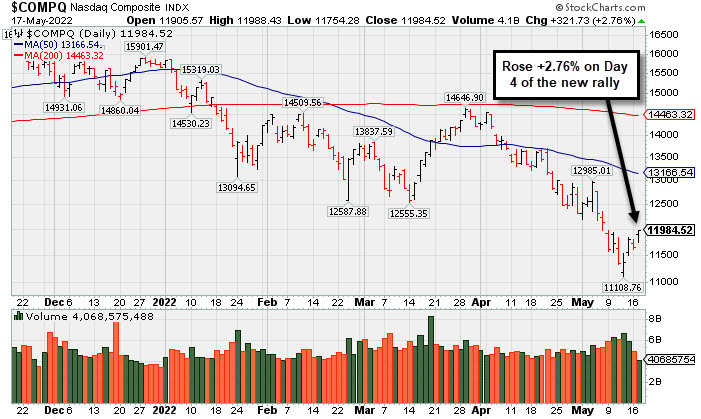 PICTURED: The Nasdaq Composite Index posted a +2.76% gain with higher volume on Tuesday, Day 4 of the new rally for the tech-heavy index. (Volume on the graph above was not updated to show the higher total at the close). At Thursday's low before a "positive reversal" it had slumped -31.5% from the November 22, 2021 record high.
U.S. stocks finished higher on Tuesday as evidence of resilient consumer spending helped spur a perceived risk on tone. Economic data was in focus, with retail sales advancing a solid 0.9% in April, while the prior month’s reading reflected a sharp upward revision.
Also aiding risk sentiment were positive updates out of China, including improving COVID-19 trends and the possibility of easing regulation on big tech shares. Across the pond, the eurozone’s first-quarter GDP (Gross Domestic Product) figure came in better than anticipated. In other data, U.S. industrial production rose a stronger-than-projected 1.1% in April, though a measure of homebuilder sentiment fell to the lowest level since June 2020 this month.
Treasuries weakened, with the two-year note yield spiking 13 basis points (0.13%) to 2.70% on hawkish remarks from Federal Reserve (Fed) Chair Jerome Powell. The Fed chief reaffirmed expectations for a series of 0.50% rate hikes in the coming months, but also stated that the central bank “won’t hesitate” to tighten policy into restrictive territory, if necessary, in order to tame inflation.
In earnings, Walmart Inc. (WMT -11.38%) sank after its profit tally fell well below analyst expectations as the big-box retailer grappled with higher costs and supply chain issues. Elsewhere, Take-Two Interactive Software Inc. (TTWO +11.78%) rose as a bottom line beat and positive analyst commentary overshadowed tepid guidance from the video game maker. In other corporate news, shares of both Paramount Global (PARA +15.35%) and Citigroup Inc. (C +7.56%) jumped after Berkshire Hathaway Inc. (BRKB +1.72%) disclosed significant stakes in the two companies.
|
 Kenneth J. Gruneisen started out as a licensed stockbroker in August 1987, a couple of months prior to the historic stock market crash that took the Dow Jones Industrial Average down -22.6% in a single day. He has published daily fact-based fundamental and technical analysis on high-ranked stocks online for two decades. Through FACTBASEDINVESTING.COM, Kenneth provides educational articles, news, market commentary, and other information regarding proven investment systems that work in good times and bad.
Comments contained in the body of this report are technical opinions only and are not necessarily those of Gruneisen Growth Corp. The material herein has been obtained from sources believed to be reliable and accurate, however, its accuracy and completeness cannot be guaranteed. Our firm, employees, and customers may effect transactions, including transactions contrary to any recommendation herein, or have positions in the securities mentioned herein or options with respect thereto. Any recommendation contained in this report may not be suitable for all investors and it is not to be deemed an offer or solicitation on our part with respect to the purchase or sale of any securities. |
|
 |
Tech, Retail, Financial, and Commodity-Linked Groups Rose
Kenneth J. Gruneisen - Passed the CAN SLIM® Master's Exam
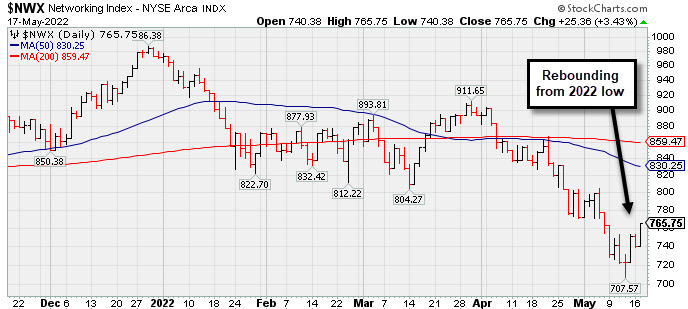
The Bank Index ($BKX +3.90%), Broker/Dealer Index ($XBD +2.59%), and Retail Index ($RLX +2.23%) all posted influential gains on Tuesday. The Semiconductor Index ($SOX +5.01%) led the tech sector while the Networking Index ($NWX +3.43%) and Biotech Index ($BTK +2.13%) also posted solid gains. Commodity-linked groups posted unanimous gains as the Gold & Silver Index ($XAU +1.20%), Oil Services Index ($OSX +1.28%), and Integrated Oil Index ($XOI +0.84%) rounded out the widely positive session.
PICTURED: The Networking Index ($NWX +3.43%) is rebounding from its 2022 low.
| Oil Services |
$OSX |
76.91 |
+0.97 |
+1.28% |
+45.88% |
| Integrated Oil |
$XOI |
1,705.79 |
+14.18 |
+0.84% |
+44.78% |
| Semiconductor |
$SOX |
3,066.50 |
+146.44 |
+5.01% |
-22.29% |
| Networking |
$NWX |
765.75 |
+25.36 |
+3.43% |
-21.14% |
| Broker/Dealer |
$XBD |
402.53 |
+10.15 |
+2.59% |
-17.32% |
| Retail |
$RLX |
3,125.94 |
+68.16 |
+2.23% |
-26.04% |
| Gold & Silver |
$XAU |
127.32 |
+1.51 |
+1.20% |
-3.87% |
| Bank |
$BKX |
110.23 |
+4.13 |
+3.90% |
-16.63% |
| Biotech |
$BTK |
4,624.00 |
+96.65 |
+2.13% |
-16.21% |
|
|
|
 |
Stalled After Recent Breakout But Remains Near High
Kenneth J. Gruneisen - Passed the CAN SLIM® Master's Exam
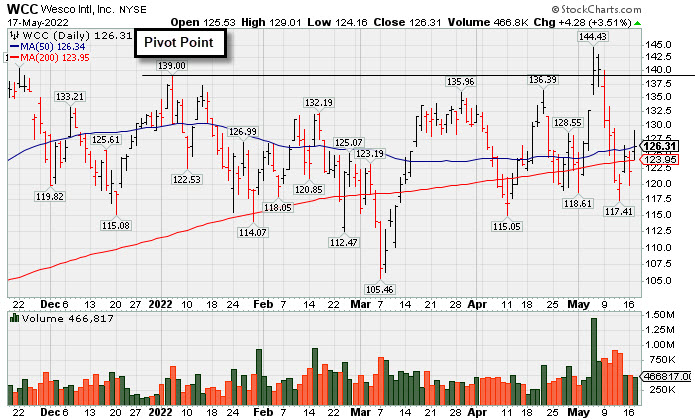
Wesco International Inc (WCC +$4.28 or +3.51% to $126.31) is sputtering near its 50-day moving average after briefly undercutting its 200 DMA line again. Prior lows in the $115 area define important near-term support to watch. Subsequent volume-driven gains for new highs would be a reassuring sign of fresh institutional buying demand which could lead to a meaningful price advance.
Recently it reported Mar '22 quarterly earnings +154% on +22% sales revenues versus the year ago period. The Electronic - Parts firm reported strong Mar, Jun, Sep, and Dec '21 quarterly results versus the year ago periods, well above the +25% minimum guideline. Annual earnings growth has been steady. It has an Earnings Per Share Rating of 97. It was highlighted in the 4/21/22 mid-day report in yellow with pivot point cited based on its 1/05/22 high plus 10 cents (read here). It was shown that evening with an annotated graph under the headline, "Approaching Prior Highs Where it Met Resistance". Subsequent gains above the pivot point triggered a technical buy signal, but it immediately stalled and negated the breakout.
There is a small supply of only 50.7 million shares outstanding (S criteria) which can contribute to greater price volatility in the event of institutional buying or selling. The number of top-rated funds owning its shares rose from 489 in Jun '21 to 558 in Mar '22, a reassuring sign concerning the I criteria. Its current Up/Down Volume Ratio of 1.1 is an unbiased indication of near neutral activity concerning accumulation/distribution over the past 50 days.
|
|
|
Color Codes Explained :
Y - Better candidates highlighted by our
staff of experts.
G - Previously featured
in past reports as yellow but may no longer be buyable under the
guidelines.
***Last / Change / Volume data in this table is the closing quote data***
Symbol/Exchange
Company Name
Industry Group |
PRICE |
CHANGE
(%Change) |
Day High |
Volume
(% DAV)
(% 50 day avg vol) |
52 Wk Hi
% From Hi |
Featured
Date |
Price
Featured |
Pivot Featured |
|
Max Buy |
 LLY
-
NYSE
LLY
-
NYSE
Eli Lilly & Co
Medical-Diversified
|
$301.40
|
+2.02
0.67% |
$303.40
|
2,545,829
85.20% of 50 DAV
50 DAV is 2,988,000
|
$314.00
-4.01%
|
5/16/2022
|
$302.46
|
PP = $314.10
|
|
MB = $329.81
|
Most Recent Note - 5/16/2022 5:10:17 PM
Y - Challenged its 52-week high today but finished near the middle of its intra-day range after highlighted in yellow in the earlier mid-day report with pivot point cited based on its 4/07/22 high plus 10 cents. Found support near prior highs and its 50 DMA line ($289) during a 6-week consolidation. Reported Mar '22 quarterly earnings +63% on +15% sales revenues versus the year ago period. Three of the past 4 quarterly comparisons were above the +25% minimum earnings guideline (C criteria). See the latest FSU analysis for more details and a new annotated graph.
>>> FEATURED STOCK ARTICLE : Eli Lilly & Co Challenges All-Time High - 5/16/2022 |
View all notes |
Set NEW NOTE alert |
Company Profile |
SEC
News |
Chart |
Request a new note
C
A
S
I |
CI
-
NYSE
Cigna Corp
Medical-Managed Care
|
$271.35
|
+4.86
1.82% |
$271.71
|
1,427,133
93.83% of 50 DAV
50 DAV is 1,521,000
|
$269.97
0.51%
|
5/6/2022
|
$263.52
|
PP = $269.97
|
|
MB = $283.47
|
Most Recent Note - 5/16/2022 5:06:09 PM
Y - Today's gain with average volume halted a streak of 5 consecutive small losses. It is perched within close striking distance of its all-time high. Subsequent gains above the pivot point backed by at least +40% above average volume may trigger a technical buy signal. Reported a strong +27% earnings increase on +7% sales revenues for the Mar '22 quarter versus the year ago period, its 3rd strong quarterly comparison above the +25% minimum guideline (C criteria). Annual earnings growth (A criteria) has been strong.
>>> FEATURED STOCK ARTICLE : Cigna Rises Near All-Time High - 5/6/2022 |
View all notes |
Set NEW NOTE alert |
Company Profile |
SEC
News |
Chart |
Request a new note
C
A
S
I |
IMKTA
-
NASDAQ
Ingles Markets Inc Cl A
RETAIL - Grocery Stores
|
$91.68
|
-1.02
-1.10% |
$93.27
|
102,459
86.10% of 50 DAV
50 DAV is 119,000
|
$101.98
-10.10%
|
4/11/2022
|
$96.25
|
PP = $95.75
|
|
MB = $100.54
|
Most Recent Note - 5/16/2022 5:14:27 PM
G - Color code is changed to green after it quietly inched below its 50 DMA line ($92.73). Today's 4th consecutive loss with below average volume nearly tested the prior low ($90.53 on 5/05/22) defining important near-term support. More damaging losses would raise concerns and trigger a more worrisome technical sell signal. Reported Mar '22 quarterly earnings +40% on +16% sales revenues versus the year ago period.
>>> FEATURED STOCK ARTICLE : Ingles Markets Perched Near High With Earnings News Due - 5/4/2022 |
View all notes |
Set NEW NOTE alert |
Company Profile |
SEC
News |
Chart |
Request a new note
C
A
S
I |
PAG
-
NYSE
Penske Automotive Grp
Retail/Whlsle-Automobile
|
$117.97
|
+2.43
2.10% |
$119.47
|
296,957
86.83% of 50 DAV
50 DAV is 342,000
|
$116.72
1.07%
|
5/13/2022
|
$114.88
|
PP = $114.57
|
|
MB = $120.30
|
 Most Recent Note - 5/17/2022 5:52:54 PM
Y - Volume was below average behind today's gain for a new all-time high. It stubbornly held its ground after a big gain and strong close above the pivot point on 5/13/22 backed by +89% above average volume triggered a technical buy signal. Reported earnings +113% on +21% sales revenues for the Mar '22 quarter versus the year ago period. Recent quarterly earnings were well above the +25% minimum guideline (C criteria). Annual earnings (A criteria) history has been strong.
>>> FEATURED STOCK ARTICLE : Breakout With Volume-Driven Gain to New High - 5/13/2022 |
View all notes |
Set NEW NOTE alert |
Company Profile |
SEC
News |
Chart |
Request a new note
C
A
S
I |
WCC
-
NYSE
Wesco International Inc
WHOLESALE - Electronics Wholesale
|
$126.31
|
+4.28
3.51% |
$129.01
|
465,111
95.31% of 50 DAV
50 DAV is 488,000
|
$144.43
-12.55%
|
4/21/2022
|
$135.54
|
PP = $139.10
|
|
MB = $146.06
|
Most Recent Note - 5/17/2022 5:47:28 PM
G - Rebounded near its 50 DMA line today after briefly undercutting its 200 DMA line again. Prior lows in the $115 area define important near-term support to watch. Reported Mar '22 quarterly earnings +154% on +22% sales revenues versus the year ago period. See the latest FSU analysis for more details and a new annotated graph.
>>> FEATURED STOCK ARTICLE : Stalled After Recent Breakout But Remains Near High - 5/17/2022 |
View all notes |
Set NEW NOTE alert |
Company Profile |
SEC
News |
Chart |
Request a new note
C
A
S
I |
Symbol/Exchange
Company Name
Industry Group |
PRICE |
CHANGE
(%Change) |
Day High |
Volume
(% DAV)
(% 50 day avg vol) |
52 Wk Hi
% From Hi |
Featured
Date |
Price
Featured |
Pivot Featured |
|
Max Buy |
IMXI
-
NASDAQ
International Money Exp
Financial Svcs-Specialty
|
$19.57
|
+0.46
2.41% |
$19.68
|
313,951
72.34% of 50 DAV
50 DAV is 434,000
|
$22.86
-14.39%
|
3/8/2022
|
$18.64
|
PP = $19.06
|
|
MB = $20.01
|
Most Recent Note - 5/17/2022 5:50:36 PM
G - Posted a gain today with a higher volume total but still below average. Only a prompt rebound above the 50 DMA line ($20.18) would help its outlook improve. Recently testing prior highs which help define important near term support to watch. More damaging losses would raise concerns and trigger a more worrisome technical sell signal.
>>> FEATURED STOCK ARTICLE : Fell Below 50-Day Moving Average Line Testing Prior Highs - 5/12/2022 |
View all notes |
Set NEW NOTE alert |
Company Profile |
SEC
News |
Chart |
Request a new note
C
A
S
I |
|
|
|
THESE ARE NOT BUY RECOMMENDATIONS!
Comments contained in the body of this report are technical
opinions only. The material herein has been obtained
from sources believed to be reliable and accurate, however,
its accuracy and completeness cannot be guaranteed.
This site is not an investment advisor, hence it does
not endorse or recommend any securities or other investments.
Any recommendation contained in this report may not
be suitable for all investors and it is not to be deemed
an offer or solicitation on our part with respect to
the purchase or sale of any securities. All trademarks,
service marks and trade names appearing in this report
are the property of their respective owners, and are
likewise used for identification purposes only.
This report is a service available
only to active Paid Premium Members.
You may opt-out of receiving report notifications
at any time. Questions or comments may be submitted
by writing to Premium Membership Services 665 S.E. 10 Street, Suite 201 Deerfield Beach, FL 33441-5634 or by calling 1-800-965-8307
or 954-785-1121.
|
|
|