You are not logged in.
This means you
CAN ONLY VIEW reports that were published prior to Thursday, April 3, 2025.
You
MUST UPGRADE YOUR MEMBERSHIP if you want to see any current reports.
AFTER MARKET UPDATE - FRIDAY, MAY 13TH, 2022
Previous After Market Report Next After Market Report >>>
|
|
|
|
DOW |
+466.36 |
32,196.66 |
+1.47% |
|
Volume |
1,111,592,269 |
-17% |
|
Volume |
5,865,114,600 |
-12% |
|
NASDAQ |
+434.04 |
11,805.00 |
+3.82% |
|
Advancers |
2,481 |
79% |
|
Advancers |
3,156 |
72% |
|
S&P 500 |
+93.81 |
4,023.89 |
+2.39% |
|
Decliners |
671 |
21% |
|
Decliners |
1,225 |
28% |
|
Russell 2000 |
+53.28 |
1,792.67 |
+3.06% |
|
52 Wk Highs |
12 |
|
|
52 Wk Highs |
13 |
|
|
S&P 600 |
+27.89 |
1,189.33 |
+2.40% |
|
52 Wk Lows |
202 |
|
|
52 Wk Lows |
316 |
|
|
The market remains in a correction (M criteria). Reducing market exposure and raising cash is prudent until a new confirmed rally is noted.
|
 |
Major Indices Posted Gains With Lighter Volume Totals
Kenneth J. Gruneisen - Passed the CAN SLIM® Master's Exam
The Dow added 466 points to snap a six-day losing streak. The blue chip index pared its five-session decline to 2.1%, but still weathered its seventh straight weekly drop—its worst such stretch since 2001. The S&P 500 climbed 2.4%, while the Nasdaq Composite rallied 3.8%. Still, both benchmarks logged a sixth consecutive weekly slide (-2.4% and -2.8%, respectively), something the S&P 500 has not suffered since June 2011. Volume totals reported were lighter than the prior session on the NYSE and on the Nasdaq exchange, revealing lackluster buying demand from the institutional crowd. Advancers led decliners by almost a 4-1 margin on the NYSE and almost 3-1 on the Nasdaq exchange. There were 6 high-ranked companies from the Leaders List that hit new 52-week highs and were listed on the BreakOuts Page, versus 1 on the prior session. New 52-week lows totals contracted yet still solidly outnumbered short lists of new 52-week highs on both the NYSE and the Nasdaq exchange. The major indices are still in a market correction (M criteria). Followers of the fact-based investment system know to watch for a follow-through day on Day 4-7 of a new rally attempt which could signal a new confirmed uptrend.
Chart courtesy of www.stockcharts.com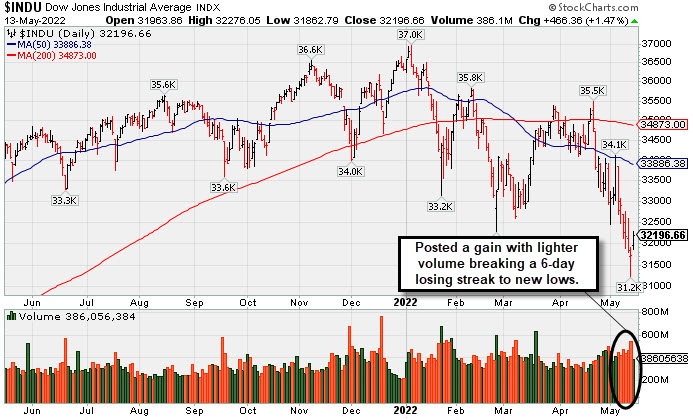 PICTURED: The Dow Jones Industrial Average posted a gain with lighter volume on Friday, breaking a streak of 6 consecutive losses as it slumped to a new 2022 low. It is down -12.9% from the January 5, 2022 record high.
U.S. stocks staged a relief rally on Friday, consolidating amid a downbeat week. As has been the case lately, the bounce was widely attributed to oversold conditions after the S&P 500 yesterday came within a hair’s breadth of bear market territory (defined as a 20% drawdown from a recent peak).
Comments from Federal Reserve chair Jerome Powell seemed to aid risk sentiment. He reiterated that the U.S. central bank would likely raise rates by 0.50% in both the upcoming June and July meetings, and echoed earlier remarks that a 0.75% increase was not being “actively considered.” Treasuries trimmed their weekly advance, with the 10-year note yield rising for the first time in five sessions, up seven basis points (0.07%) to 2.94%.
All 11 S&P 500 sectors climbed more than 1%, with the Consumer Discretionary group pacing the gains. U.S.-based casinos with operations in Macau outperformed as strict covid restrictions in Shanghai were set to ease. In other corporate news, Twitter Inc. (TWTR -9.7%) fell after Elon Musk stated his $44 billion takeover is “temporarily on hold,” though noted that he is “still committed” to the deal.
|
 Kenneth J. Gruneisen started out as a licensed stockbroker in August 1987, a couple of months prior to the historic stock market crash that took the Dow Jones Industrial Average down -22.6% in a single day. He has published daily fact-based fundamental and technical analysis on high-ranked stocks online for two decades. Through FACTBASEDINVESTING.COM, Kenneth provides educational articles, news, market commentary, and other information regarding proven investment systems that work in good times and bad.
Comments contained in the body of this report are technical opinions only and are not necessarily those of Gruneisen Growth Corp. The material herein has been obtained from sources believed to be reliable and accurate, however, its accuracy and completeness cannot be guaranteed. Our firm, employees, and customers may effect transactions, including transactions contrary to any recommendation herein, or have positions in the securities mentioned herein or options with respect thereto. Any recommendation contained in this report may not be suitable for all investors and it is not to be deemed an offer or solicitation on our part with respect to the purchase or sale of any securities. |
|
 |
Tech, Retail, Financial, and Commodity-Linked Groups Rebounded
Kenneth J. Gruneisen - Passed the CAN SLIM® Master's Exam
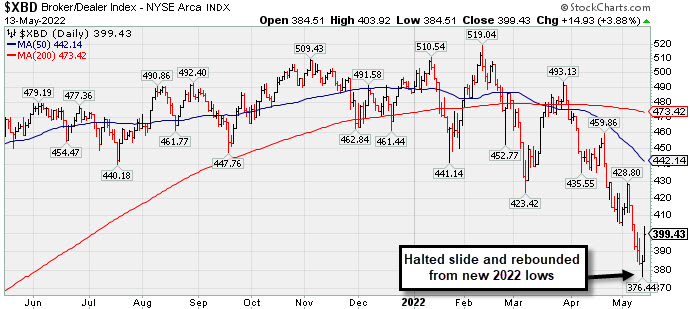
The tech sector bounced back as the Semiconductor Index ($SOX +5.06%), Networking Index ($NWX +3.90%), and Biotech Index ($BTK +3.07%) each posted solid gains. The Retail Index ($RLX +3.69%), Broker/Dealer Index ($XBD +3.88%), and Bank Index ($BKX +1.08%) posted influential gains. Commodity-linked groups also had a positive bias as the Gold & Silver Index ($XAU +2.19%), Oil Services Index ($OSX +4.64%), and Integrated Oil Index ($XOI +3.69%) posted unanimous gains.
PICTURED: The Broker/Dealer Index ($XBD +3.88%) halted its slide and rebounded from new 2022 lows.
| Oil Services |
$OSX |
73.38 |
+3.25 |
+4.64% |
+39.18% |
| Integrated Oil |
$XOI |
1,659.04 |
+58.98 |
+3.69% |
+40.81% |
| Semiconductor |
$SOX |
2,970.37 |
+143.16 |
+5.06% |
-24.73% |
| Networking |
$NWX |
751.20 |
+28.19 |
+3.90% |
-22.64% |
| Broker/Dealer |
$XBD |
399.43 |
+14.93 |
+3.88% |
-17.96% |
| Retail |
$RLX |
3,091.01 |
+110.03 |
+3.69% |
-26.87% |
| Gold & Silver |
$XAU |
124.87 |
+2.68 |
+2.19% |
-5.72% |
| Bank |
$BKX |
107.31 |
+1.15 |
+1.08% |
-18.84% |
| Biotech |
$BTK |
4,521.58 |
+134.51 |
+3.07% |
-18.06% |
|
|
|
 |
Breakout With Volume-Driven Gain to New High
Kenneth J. Gruneisen - Passed the CAN SLIM® Master's Exam
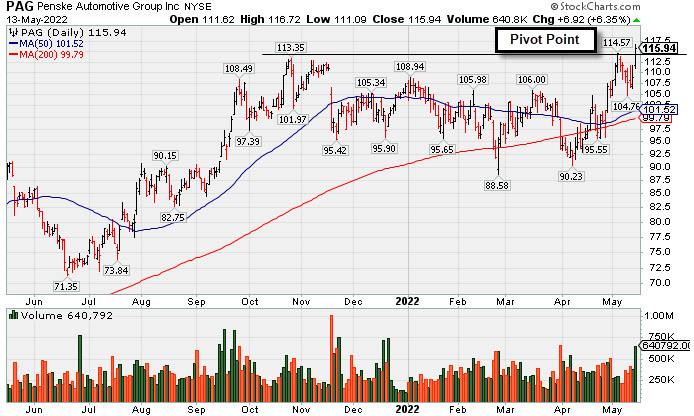
Penske Automotive Grp (PAG +$6.92 or +6.35% to $115.94) finished strong today after highlighted in yellow in the mid-day report (read here) with pivot point cited based on its 5/04/22 high after a 6-month saucer-with-handle base. It hit a new all-time high today. The gain and close above the pivot point was backed by +89% above average volume triggering a technical buy signal. However, members were reminded - "New buying efforts may only be considered after a solid follow-through day confirms a new market uptrend (M criteria) under the fact-based investment system. Follow this closely in the daily market commentaries."
PAG reported earnings +113% on +21% sales revenues for the Mar '22 quarter versus the year ago period. Recent quarterly earnings were well above the +25% minimum guideline (C criteria). Annual earnings (A criteria) history has been strong. It has an Earnings Per Share Rating of 97, well above the 80+ minimum for buy candidates.
There are 27.6 million shares in the public float (S criteria) which can contribute to greater price volatility in the event of institutional buying or selling. The number of top-rated funds owning its shares rose from 420 in Jun '21 to 502 in Mar '22, a reassuring sign concerning the I criteria. Its current Up/Down Volume Ratio of 0.9 indicates modest distributional pressure over the past 50 days. The Retail/Wholesale-Automobile group is currently ranked 117th of the 197 Industry Groups, however several other high-ranked stocks in the group have been showing confirming strength and leadership (L criteria). |
|
|
Color Codes Explained :
Y - Better candidates highlighted by our
staff of experts.
G - Previously featured
in past reports as yellow but may no longer be buyable under the
guidelines.
***Last / Change / Volume data in this table is the closing quote data***
Symbol/Exchange
Company Name
Industry Group |
PRICE |
CHANGE
(%Change) |
Day High |
Volume
(% DAV)
(% 50 day avg vol) |
52 Wk Hi
% From Hi |
Featured
Date |
Price
Featured |
Pivot Featured |
|
Max Buy |
 CI
-
NYSE
CI
-
NYSE
Cigna Corp
Medical-Managed Care
|
$259.19
|
-0.84
-0.32% |
$261.98
|
1,520,105
100.47% of 50 DAV
50 DAV is 1,513,000
|
$269.97
-3.99%
|
5/6/2022
|
$263.52
|
PP = $269.97
|
|
MB = $283.47
|
Most Recent Note - 5/11/2022 6:18:36 PM
Y - Pulled back today for a 3rd consecutive small loss on lighter volume while perched within close striking distance of its all-time high. Subsequent gains above the pivot point backed by at least +40% above average volume may trigger a technical buy signal. Reported a strong +27% earnings increase on +7% sales revenues for the Mar '22 quarter versus the year ago period, its 3rd strong quarterly comparison above the +25% minimum guideline (C criteria). Annual earnings growth (A criteria) has been strong.
>>> FEATURED STOCK ARTICLE : Cigna Rises Near All-Time High - 5/6/2022 |
View all notes |
Set NEW NOTE alert |
Company Profile |
SEC
News |
Chart |
Request a new note
C
A
S
I |
IMKTA
-
NASDAQ
Ingles Markets Inc Cl A
RETAIL - Grocery Stores
|
$93.21
|
-0.57
-0.61% |
$94.55
|
112,853
94.83% of 50 DAV
50 DAV is 119,000
|
$101.98
-8.60%
|
4/11/2022
|
$96.25
|
PP = $95.75
|
|
MB = $100.54
|
Most Recent Note - 5/11/2022 6:19:58 PM
Y - Reversed an early gain today and closed near the session low. Its 50 DMA line ($92.73) and prior lows define important near-term support. More damaging losses would raise concerns and trigger a technical sell signal. Reported Mar '22 quarterly earnings +40% on +16% sales revenues versus the year ago period.
>>> FEATURED STOCK ARTICLE : Ingles Markets Perched Near High With Earnings News Due - 5/4/2022 |
View all notes |
Set NEW NOTE alert |
Company Profile |
SEC
News |
Chart |
Request a new note
C
A
S
I |
PAG
-
NYSE
Penske Automotive Grp
Retail/Whlsle-Automobile
|
$115.94
|
+6.92
6.35% |
$116.72
|
642,159
189.43% of 50 DAV
50 DAV is 339,000
|
$114.57
1.20%
|
5/13/2022
|
$114.88
|
PP = $114.57
|
|
MB = $120.30
|
 Most Recent Note - 5/13/2022 5:55:55 PM
Y - Finished strong today after highlighted in yellow with pivot point cited based on its 5/04/22 high after a 6-month saucer-with-handle base. Hit a new all-time high with a big gain and strong close above the pivot point backed by +89% above average volume triggering a technical buy signal. New buying efforts may only be considered after a solid follow-through day confirms a new market uptrend (M criteria) under the fact-based investment system. Follow this closely in the daily market commentaries. Reported earnings +113% on +21% sales revenues for the Mar '22 quarter versus the year ago period. Recent quarterly earnings were well above the +25% minimum guideline (C criteria). Annual earnings (A criteria) history has been strong. See the latest FSU analysis for more details and a new annotated graph.
>>> FEATURED STOCK ARTICLE : Breakout With Volume-Driven Gain to New High - 5/13/2022 |
View all notes |
Set NEW NOTE alert |
Company Profile |
SEC
News |
Chart |
Request a new note
C
A
S
I |
WCC
-
NYSE
Wesco International Inc
WHOLESALE - Electronics Wholesale
|
$124.67
|
+4.60
3.83% |
$126.39
|
489,524
100.93% of 50 DAV
50 DAV is 485,000
|
$144.43
-13.68%
|
4/21/2022
|
$135.54
|
PP = $139.10
|
|
MB = $146.06
|
Most Recent Note - 5/11/2022 6:17:30 PM
G - Color code is changed to green after slumping below its 50 and 200 DMA lines raising concerns with today's 3rd consecutive volume-driven loss. Prior lows in the $115 define near-term support, meanwhile a rebound above the 50 DMA line is needed for its outlook to improve. Members were cautioned - "New buying efforts may only be considered after a solid follow-through day confirms a new market uptrend (M criteria)." Reported Mar '22 quarterly earnings +154% on +22% sales revenues versus the year ago period. Volume and volatility often increase near earnings news.
>>> FEATURED STOCK ARTICLE : Approaching Prior Highs Where it Met Resistance - 4/21/2022 |
View all notes |
Set NEW NOTE alert |
Company Profile |
SEC
News |
Chart |
Request a new note
C
A
S
I |
IMXI
-
NASDAQ
International Money Exp
Financial Svcs-Specialty
|
$19.61
|
+0.23
1.19% |
$19.87
|
241,709
56.08% of 50 DAV
50 DAV is 431,000
|
$22.86
-14.22%
|
3/8/2022
|
$18.64
|
PP = $19.06
|
|
MB = $20.01
|
Most Recent Note - 5/12/2022 6:19:59 PM
G - Fell today and closed below its 50-day moving average (DMA) line ($19.99) while testing prior highs which help define important near term support to watch. Only a prompt rebound above the 50 DMA line would help its outlook. More damaging losses would raise concerns and trigger a more worrisome technical sell signal. See the latest FSU analysis for more details and a new annotated graph.
>>> FEATURED STOCK ARTICLE : Fell Below 50-Day Moving Average Line Testing Prior Highs - 5/12/2022 |
View all notes |
Set NEW NOTE alert |
Company Profile |
SEC
News |
Chart |
Request a new note
C
A
S
I |
Symbol/Exchange
Company Name
Industry Group |
PRICE |
CHANGE
(%Change) |
Day High |
Volume
(% DAV)
(% 50 day avg vol) |
52 Wk Hi
% From Hi |
Featured
Date |
Price
Featured |
Pivot Featured |
|
Max Buy |
|
|
|
THESE ARE NOT BUY RECOMMENDATIONS!
Comments contained in the body of this report are technical
opinions only. The material herein has been obtained
from sources believed to be reliable and accurate, however,
its accuracy and completeness cannot be guaranteed.
This site is not an investment advisor, hence it does
not endorse or recommend any securities or other investments.
Any recommendation contained in this report may not
be suitable for all investors and it is not to be deemed
an offer or solicitation on our part with respect to
the purchase or sale of any securities. All trademarks,
service marks and trade names appearing in this report
are the property of their respective owners, and are
likewise used for identification purposes only.
This report is a service available
only to active Paid Premium Members.
You may opt-out of receiving report notifications
at any time. Questions or comments may be submitted
by writing to Premium Membership Services 665 S.E. 10 Street, Suite 201 Deerfield Beach, FL 33441-5634 or by calling 1-800-965-8307
or 954-785-1121.
|
|
|