You are not logged in.
This means you
CAN ONLY VIEW reports that were published prior to Tuesday, July 9, 2024.
You
MUST UPGRADE YOUR MEMBERSHIP if you want to see any current reports.
AFTER MARKET UPDATE - FRIDAY, APRIL 26TH, 2024
Previous After Market Report Next After Market Report >>>
|
|
|
|
DOW |
+153.86 |
38,239.66 |
+0.40% |
|
Volume |
885,485,256 |
-10% |
|
Volume |
4,716,046,600 |
-1% |
|
NASDAQ |
+316.14 |
15,927.90 |
+2.03% |
|
Advancers |
1,819 |
66% |
|
Advancers |
2,639 |
64% |
|
S&P 500 |
+51.54 |
5,099.96 |
+1.02% |
|
Decliners |
941 |
34% |
|
Decliners |
1,512 |
36% |
|
Russell 2000 |
+20.88 |
2,002.00 |
+1.05% |
|
52 Wk Highs |
72 |
|
|
52 Wk Highs |
59 |
|
|
S&P 600 |
+9.85 |
1,284.03 |
+0.77% |
|
52 Wk Lows |
20 |
|
|
52 Wk Lows |
93 |
|
|
Since Wednesday April 10th members of FACTBASEDINVESTING.COM were cautioned as a shift in conditions (M criteria) signaled a market "correction". Use greater caution, raise cash and reduce exposure by selling any weakening stocks on a case-by-case basis. New buying efforts will be avoided by disciplined investors until a solid follow-through day is noted confirming a new uptrend.
|
 |
Majoe Indices Rose With Lighter Volume Totals
Kenneth J. Gruneisen - Passed the CAN SLIM® Master's Exam
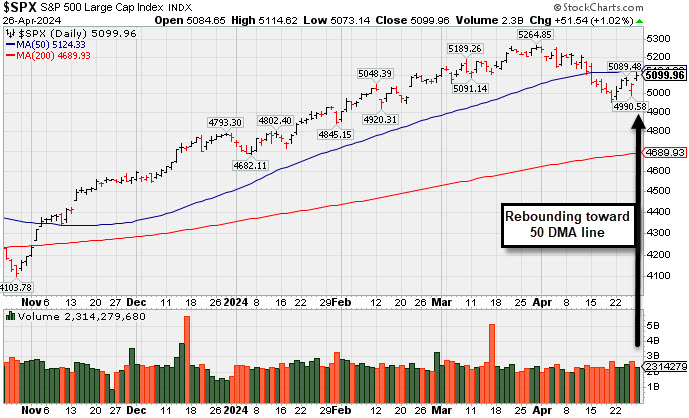
On Friday's session the Nasdaq Composite Index rose +2.03% while the S&P 500 Index rose +1.02%. The Dow Jones Industrial Average rose +0.40%. Volume reported was lighter than the prior session totals on the NYSE and on the Nasdaq exchange, revealing lackluster buying demand from the institutional crowd. Breadth was positive as advancers led decliners by almost a 2-1 margin on the NYSE and by a 5-3 margin on the Nasdaq exchange. There were 41 high-ranked companies from the Leaders List that hit new 52-week highs and were listed on the BreakOuts Page versus 17 on the prior session. New 52-week highs outnumbered new 52-week lows on the NYSE but new lows still outnumbered new highs on the Nasdaq exchange. The major indices recently signaled a market correction (M criteria). Greater caution is important for all investors until a follow-through day signals a new confirmed uptrend.
PICTURED: The S&P 500 Index remains below its 50-day moving average (DMA) line. The window remains open for a follow-through day a as long as the Day 1 low is not violated.
A big earnings-related gain in Alphabet (GOOG +9.97%) provided a boost to the broader market. Microsoft (MSFT +1.82%) posted a smaller gain after earnings. Intel (INTC -9.20%) was an exception after reporting disappointing quarterly results, meanwhile NVIDIA (NVDA +6.18%) jumped.
Six of the S&P 500 sectors closed higher and five fell. The communication services sector led while the information technology and consumer discretionary sectors were the next best performers. The energy sector was among the weakest performers with a loss in Exxon Mobil (XOM -2.78%) after its earnings report.
The March Personal Income and Spending report showed solid spending activity but stalled progress on inflation. The final reading of the University of Michigan's Consumer Sentiment survey for April (actual 77.2) showed a weakening from the preliminary reading and an uptick in inflation expectations.
The 10-yr note yield declined four basis points to 4.67% and the 2-yr note yield settled unchanged at 5.00%.
|
 Kenneth J. Gruneisen started out as a licensed stockbroker in August 1987, a couple of months prior to the historic stock market crash that took the Dow Jones Industrial Average down -22.6% in a single day. He has published daily fact-based fundamental and technical analysis on high-ranked stocks online for two decades. Through FACTBASEDINVESTING.COM, Kenneth provides educational articles, news, market commentary, and other information regarding proven investment systems that work in good times and bad.
Comments contained in the body of this report are technical opinions only and are not necessarily those of Gruneisen Growth Corp. The material herein has been obtained from sources believed to be reliable and accurate, however, its accuracy and completeness cannot be guaranteed. Our firm, employees, and customers may effect transactions, including transactions contrary to any recommendation herein, or have positions in the securities mentioned herein or options with respect thereto. Any recommendation contained in this report may not be suitable for all investors and it is not to be deemed an offer or solicitation on our part with respect to the purchase or sale of any securities. |
|
 |
Retail, Tech, and Broker/Dealer Index Led Group Gainers
Kenneth J. Gruneisen - Passed the CAN SLIM® Master's Exam
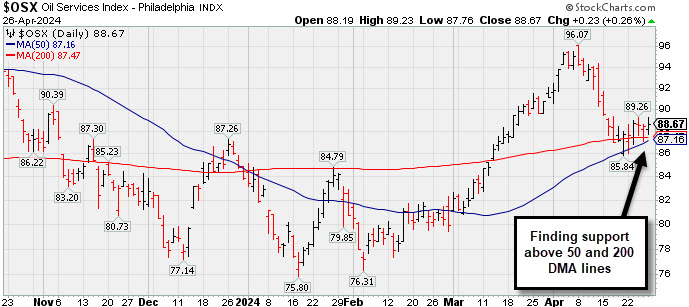
The Retail Index ($RLX +2.36%), Broker/Dealer Index ($XBD +1.03%), and Bank Index ($BKX +0.28%) each rose and had a positive impact on the major indices. The tech sector also had a positive bias as the Semiconductor Index ($SOX +2.61%) outpaced the Networking Index ($NWX +1.47%) and the Biotech Index ($BTK +0.76%). The Gold & Silver Index ($XAU +1.06) outpaced the Oil Services Index ($OSX +0.26%) while the Integrated Oil Index ($XOI -0.38%) ended slightly lower.
![]() PICTURED: The Oil Services Index ($OSX +0.26%) has recently been finding support above its 50-day and 200-day moving average (DMA) lines which have nearly converged.
| Oil Services |
$OSX |
88.67 |
+0.23 |
+0.26% |
+5.71% |
| Integrated Oil |
$XOI |
2,196.45 |
-8.48 |
-0.38% |
+17.93% |
| Semiconductor |
$SOX |
4,735.29 |
+120.25 |
+2.61% |
+13.41% |
| Networking |
$NWX |
752.54 |
+10.90 |
+1.47% |
-9.64% |
| Broker/Dealer |
$XBD |
599.85 |
+6.11 |
+1.03% |
+7.64% |
| Retail |
$RLX |
4,338.01 |
+100.11 |
+2.36% |
+11.55% |
| Gold & Silver |
$XAU |
138.68 |
+1.46 |
+1.06% |
+10.33% |
| Bank |
$BKX |
102.68 |
+0.29 |
+0.28% |
+6.93% |
| Biotech |
$BTK |
4,939.03 |
+37.03 |
+0.76% |
-8.85% |
|
|
|
 |
Trading in Tight Range Near High
Kenneth J. Gruneisen - Passed the CAN SLIM® Master's Exam
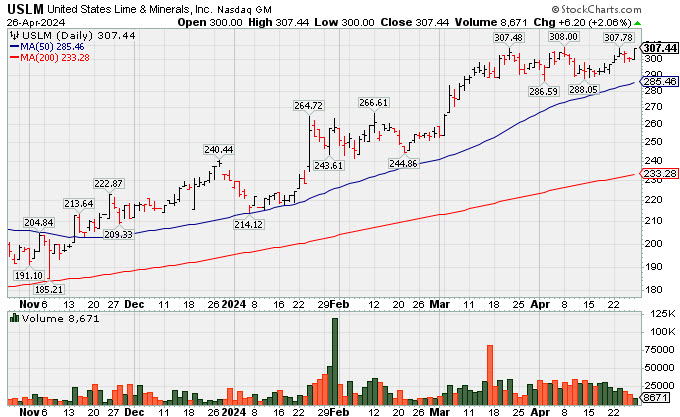
U.S. Lime & Minerals (USLM +$6.20 or +2.06% to $307.44) has been consolidating in a tight range near its all-time high. Its 50-day moving average (DMA) line ($285) and prior lows define near-term support to watch. During the ongoing market correction (M criteria) greater caution is important for all investors. New buying efforts should be avoided until a follow-through day signals a new confirmed uptrend.
USLM has a highest possible Earnings Per Share Rating of 99. It reported Dec '23 quarterly earnings +57% on +13% sales revenues versus the year ago period. Its prior quarterly and annual earnings (C and A criteria) history has been strong, a good match with the fact-based investment system's guidelines. The thinly traded firm has only 5.7 million shares outstanding (S criteria), which can contribute to greater price volatility in the event of institutional buying or selling.
USLM was highlighted in yellow in the 2/09/24 mid-day report (read here) and last shown in this FSU section on 4/05/24 with an annotated graph under the headline, "Gain With Light Volume for Best Ever Close". The number of top-rated funds owning its shares rose from 192 in Mar '23 to 227 in Mar '24, a reassuring sign concerning the I criteria. Its current Up/Down Volume Ratio of 1.2 is an unbiased indication its shares have been under accumulation over the past 50 days. |
|
|
Color Codes Explained :
Y - Better candidates highlighted by our
staff of experts.
G - Previously featured
in past reports as yellow but may no longer be buyable under the
guidelines.
***Last / Change / Volume data in this table is the closing quote data***
Symbol/Exchange
Company Name
Industry Group |
PRICE |
CHANGE
(%Change) |
Day High |
Volume
(% DAV)
(% 50 day avg vol) |
52 Wk Hi
% From Hi |
Featured
Date |
Price
Featured |
Pivot Featured |
|
Max Buy |
 NVO
-
NYSE
NVO
-
NYSE
Novo Nordisk ADR
Medical-Ethical Drugs
|
$126.85
|
+1.06
0.84% |
$127.90
|
3,209,180
67.56% of 50 DAV
50 DAV is 4,750,000
|
$138.28
-8.27%
|
3/1/2024
|
$124.23
|
PP = $124.97
|
|
MB = $131.22
|
Most Recent Note - 4/24/2024 5:13:30 PM
G - Slumped below its 50 DMA line ($126) which may now act as resistance. A rebound above the 50 DMA line is needed for its outlook to improve. See the latest FSU analysis for more details and a new annotated graph.
>>> FEATURED STOCK ARTICLE : Fell Below 50-Day Moving Average Which May Act as Resistance - 4/24/2024 |
View all notes |
Set NEW NOTE alert |
Company Profile |
SEC
News |
Chart |
Request a new note
C
A
S
I |
AXON
-
NASDAQ
Axon Enterprise
Security/Sfty
|
$308.23
|
+1.99
0.65% |
$311.87
|
288,392
54.62% of 50 DAV
50 DAV is 528,000
|
$329.87
-6.56%
|
4/5/2024
|
$309.90
|
PP = $325.73
|
|
MB = $342.02
|
Most Recent Note - 4/23/2024 5:59:01 PM
Y - Posted a gain today with near-average volume and closed just above its 50 DMA line ($301). Color code was changed to yellow with new pivot point cited based on its 3/04/24 high plus 10 cents. A gain above the pivot point backed by at least +40% above average volume is needed to trigger a proper technical buy signal. Fundamentals remain strong.
>>> FEATURED STOCK ARTICLE : Volume Totals Cooling While Building a New Base - 4/8/2024 |
View all notes |
Set NEW NOTE alert |
Company Profile |
SEC
News |
Chart |
Request a new note
C
A
S
I |
TDG
-
NYSE
TransDigm Group
Aerospace/Defense
|
$1,259.15
|
+2.57
0.20% |
$1,269.51
|
139,583
71.22% of 50 DAV
50 DAV is 196,000
|
$1,265.25
-0.48%
|
4/12/2024
|
$1,224.21
|
PP = $1,246.32
|
|
MB = $1,308.64
|
Most Recent Note - 4/23/2024 5:54:37 PM
Y - Posted a solid gain today with +22% above average volume for a best-ever close. Color code was changed to yellow after holding its ground in a tight range near its all-time high. New pivot point was cited based on its 4/04/24 high plus 10 cents. Subsequent gains above the pivot point backed by at least +40% above average volume are needed to trigger a proper new technical buy signal. Its 50 DMA line ($1,193) defines near-term support to watch.
>>> FEATURED STOCK ARTICLE : Volume Totals Cooling While Perched Near High - 4/9/2024 |
View all notes |
Set NEW NOTE alert |
Company Profile |
SEC
News |
Chart |
Request a new note
C
A
S
I |
PCAR
-
NASDAQ
Paccar
Trucks and Parts-Hvy Duty
|
$111.96
|
-0.66
-0.59% |
$112.83
|
2,624,195
113.45% of 50 DAV
50 DAV is 2,313,000
|
$125.50
-10.79%
|
1/23/2024
|
$100.35
|
PP = $98.57
|
|
MB = $103.50
|
Most Recent Note - 4/24/2024 5:17:09 PM
G - Halted its slide after a recently noted slump below its 50 DMA line ($116) triggered a technical sell signal. A prompt rebound above the 50 DMA line is needed for its outlook to improve. Fundamentals remain strong.
>>> FEATURED STOCK ARTICLE : Pulling Back From High and Slumping Toward 50-Day Moving Average - 4/12/2024 |
View all notes |
Set NEW NOTE alert |
Company Profile |
SEC
News |
Chart |
Request a new note
C
A
S
I |
HUBB
-
NYSE
Hubbell
Electrical-Power/Equipmt
|
$407.53
|
+5.26
1.31% |
$410.37
|
359,099
89.11% of 50 DAV
50 DAV is 403,000
|
$429.61
-5.14%
|
1/30/2024
|
$343.26
|
PP = $336.83
|
|
MB = $353.67
|
Most Recent Note - 4/24/2024 5:15:39 PM
G - Posted a 3rd consecutive gain today with below-average volume after finding prompt support near its 50 DMA line ($392.82).
>>> FEATURED STOCK ARTICLE : Closed Just Below 50-Day Moving Average With Quiet Loss - 4/19/2024 |
View all notes |
Set NEW NOTE alert |
Company Profile |
SEC
News |
Chart |
Request a new note
C
A
S
I |
Symbol/Exchange
Company Name
Industry Group |
PRICE |
CHANGE
(%Change) |
Day High |
Volume
(% DAV)
(% 50 day avg vol) |
52 Wk Hi
% From Hi |
Featured
Date |
Price
Featured |
Pivot Featured |
|
Max Buy |
USLM
-
NASDAQ
U.S. Lime & Minerals
Bldg-Cement/Concrt/Ag
|
$307.44
|
+6.20
2.06% |
$307.44
|
8,650
39.32% of 50 DAV
50 DAV is 22,000
|
$308.00
-0.18%
|
2/9/2024
|
$254.68
|
PP = $265.09
|
|
MB = $278.34
|
 Most Recent Note - 4/26/2024 4:28:41 PM
G - Posted a gain with light volume today for a best-ever close and perched within close striking distance of its all-time high. Its 50 DMA line ($285) and recent lows define near-term support to watch. See the latest FSU analysis for more details and a new annotated graph.
>>> FEATURED STOCK ARTICLE : Trading in Tight Range Near High - 4/26/2024 |
View all notes |
Set NEW NOTE alert |
Company Profile |
SEC
News |
Chart |
Request a new note
C
A
S
I |
PAY
-
NYSE
Paymentus Holdings
Finance-CrdtCard/PmtPr
|
$20.78
|
+0.68
3.38% |
$21.00
|
218,091
54.39% of 50 DAV
50 DAV is 401,000
|
$25.21
-17.57%
|
3/5/2024
|
$19.97
|
PP = $18.89
|
|
MB = $19.83
|
Most Recent Note - 4/26/2024 5:07:32 PM
G - Posted a gain today with below-average volume, finding support above its 50 DMA line ($19.93). Prior highs in the $18 range define the next support. More damaging losses would raise greater concerns.
>>> FEATURED STOCK ARTICLE : Prior Highs Define Important Near-Term Support - 4/22/2024 |
View all notes |
Set NEW NOTE alert |
Company Profile |
SEC
News |
Chart |
Request a new note
C
A
S
I |
HUBS
-
NYSE
HubSpot
Comp Sftwr-Spec Enterprs
|
$631.13
|
-4.97
-0.78% |
$642.09
|
480,006
88.89% of 50 DAV
50 DAV is 540,000
|
$693.85
-9.04%
|
4/4/2024
|
$686.66
|
PP = $660.10
|
|
MB = $693.11
|
Most Recent Note - 4/25/2024 4:54:07 PM
Y - Pulled back again today with near average volume, testing support at its 50 DMA line ($627) and recent lows. Stalled after highlighted yellow in the 4/04/24 mid-day report with pivot point cited based on its 2/09/24 high plus 10 cents. Fundamentals remain strong. See the latest FSU analysis for more details and an annotated graph.
>>> FEATURED STOCK ARTICLE : HUBS Testing 50-day Moving Average Line Again - 4/25/2024 |
View all notes |
Set NEW NOTE alert |
Company Profile |
SEC
News |
Chart |
Request a new note
C
A
S
I |
|
|
|
THESE ARE NOT BUY RECOMMENDATIONS!
Comments contained in the body of this report are technical
opinions only. The material herein has been obtained
from sources believed to be reliable and accurate, however,
its accuracy and completeness cannot be guaranteed.
This site is not an investment advisor, hence it does
not endorse or recommend any securities or other investments.
Any recommendation contained in this report may not
be suitable for all investors and it is not to be deemed
an offer or solicitation on our part with respect to
the purchase or sale of any securities. All trademarks,
service marks and trade names appearing in this report
are the property of their respective owners, and are
likewise used for identification purposes only.
This report is a service available
only to active Paid Premium Members.
You may opt-out of receiving report notifications
at any time. Questions or comments may be submitted
by writing to Premium Membership Services 665 S.E. 10 Street, Suite 201 Deerfield Beach, FL 33441-5634 or by calling 1-800-965-8307
or 954-785-1121.
|
|
|