You are not logged in.
This means you
CAN ONLY VIEW reports that were published prior to Monday, April 14, 2025.
You
MUST UPGRADE YOUR MEMBERSHIP if you want to see any current reports.
AFTER MARKET UPDATE - MONDAY, APRIL 29TH, 2024
Previous After Market Report Next After Market Report >>>
|
|
|
|
DOW |
+146.43 |
38,386.09 |
+0.38% |
|
Volume |
869,867,942 |
-2% |
|
Volume |
4,995,665,700 |
+6% |
|
NASDAQ |
+55.18 |
15,983.08 |
+0.35% |
|
Advancers |
1,970 |
71% |
|
Advancers |
2,633 |
62% |
|
S&P 500 |
+16.21 |
5,116.17 |
+0.32% |
|
Decliners |
811 |
29% |
|
Decliners |
1,584 |
38% |
|
Russell 2000 |
+14.03 |
2,016.03 |
+0.70% |
|
52 Wk Highs |
71 |
|
|
52 Wk Highs |
81 |
|
|
S&P 600 |
+8.49 |
1,292.52 |
+0.66% |
|
52 Wk Lows |
9 |
|
|
52 Wk Lows |
72 |
|
|
Since Wednesday April 10th members of FACTBASEDINVESTING.COM were cautioned as a shift in conditions (M criteria) signaled a market "correction". Use greater caution, raise cash and reduce exposure by selling any weakening stocks on a case-by-case basis. New buying efforts will be avoided by disciplined investors until a solid follow-through day is noted confirming a new uptrend.
|
 |
Major Indices Posted Modest Gains Without Conviction
Kenneth J. Gruneisen - Passed the CAN SLIM® Master's Exam
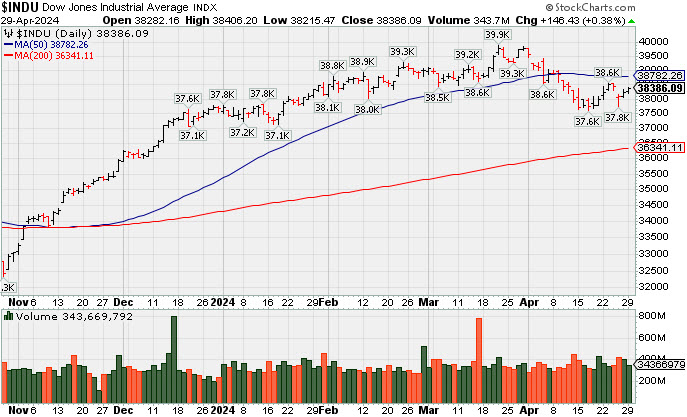
The major indices each ended Monday's session with a modest gain. Volume reported was mixed, lighter than the prior session total on the NYSE and higher on the Nasdaq exchange. Breadth was positive as advancers led decliners by almost a 5-2 margin on the NYSE and by a 5-3 margin on the Nasdaq exchange. There were 31 high-ranked companies from the Leaders List that hit new 52-week highs and were listed on the BreakOuts Page versus 41 on the prior session. New 52-week highs outnumbered new 52-week lows on the NYSE and on the Nasdaq exchange. The major indices recently signaled a market correction (M criteria). Greater caution is important for all investors until a follow-through day signals a new confirmed uptrend.
PICTURED: The S&P 500 Index remains below its 50-day moving average (DMA) line. The window remains open for a follow-through day a as long as the Day 1 low is not violated.
Stocks slumped after the U.S. Treasury announced that borrowing in Q2 is expected to reach $243 billion, $41 billion higher than estimated at the end of Q4. Losses in mega cap names including Meta Platforms (META -2.41%), Alphabet (GOOG -3.33%), and Microsoft (MSFT -1.00%) weighed on the major indices. Apple (AAPL +2.48%) rose after an analyst upgrade, and Tesla (TSLA +15.3%) rallied after it won temporary approval in China for its self-driving service.
Two of the eleven S&P 500 sectors closed with losses. Communication services (-2.1%) and financials (-0.2%) fell. The consumer discretionary sector (+2.0%) logged the biggest gain.
This week more than 170 S&P 500 companies will be reporting their March quarter results. An FOMC decision and press conference is due on Wednesday. The April ISM Manufacturing Index will be released on Wednesday and the April Employment Report will be released on Friday.
|
 Kenneth J. Gruneisen started out as a licensed stockbroker in August 1987, a couple of months prior to the historic stock market crash that took the Dow Jones Industrial Average down -22.6% in a single day. He has published daily fact-based fundamental and technical analysis on high-ranked stocks online for two decades. Through FACTBASEDINVESTING.COM, Kenneth provides educational articles, news, market commentary, and other information regarding proven investment systems that work in good times and bad.
Comments contained in the body of this report are technical opinions only and are not necessarily those of Gruneisen Growth Corp. The material herein has been obtained from sources believed to be reliable and accurate, however, its accuracy and completeness cannot be guaranteed. Our firm, employees, and customers may effect transactions, including transactions contrary to any recommendation herein, or have positions in the securities mentioned herein or options with respect thereto. Any recommendation contained in this report may not be suitable for all investors and it is not to be deemed an offer or solicitation on our part with respect to the purchase or sale of any securities. |
|
 |
Tech, Retail, and Commodity-Linked Groups Rose
Kenneth J. Gruneisen - Passed the CAN SLIM® Master's Exam
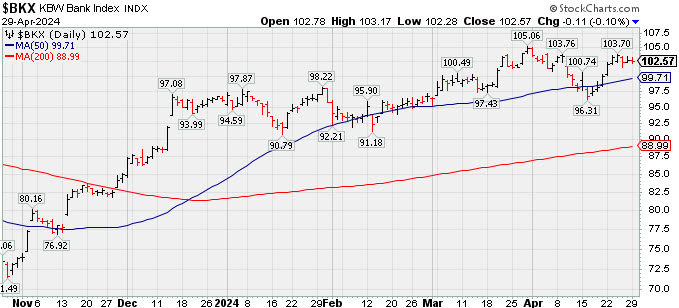
The Retail Index ($RLX +0.55%) and Broker/Dealer Index ($XBD +0.64%) both posted gains while the Bank Index ($BKX -0.10%) ended slightly lower. The tech sector had a positive bias as the Semiconductor Index ($SOX +0.64%) and the Networking Index ($NWX +0.54%) both posted small gains and the Biotech Index ($BTK +1.43%) posted a larger gain. The Gold & Silver Index ($XAU +0.80), Oil Services Index ($OSX +0.27%) and the Integrated Oil Index ($XOI +0.34%) each posted a modest gain.
![]() PICTURED: The Bank Index ($BKX -0.10%) recently has been consolidating above its 50-day moving average (DMA) line, perched within close striking distance of its 2024 high.
| Oil Services |
$OSX |
88.91 |
+0.24 |
+0.27% |
+6.00% |
| Integrated Oil |
$XOI |
2,203.92 |
+7.47 |
+0.34% |
+18.33% |
| Semiconductor |
$SOX |
4,765.79 |
+30.51 |
+0.64% |
+14.14% |
| Networking |
$NWX |
756.57 |
+4.03 |
+0.54% |
-9.15% |
| Broker/Dealer |
$XBD |
603.69 |
+3.83 |
+0.64% |
+8.33% |
| Retail |
$RLX |
4,361.68 |
+23.67 |
+0.55% |
+12.16% |
| Gold & Silver |
$XAU |
139.78 |
+1.10 |
+0.80% |
+11.21% |
| Bank |
$BKX |
102.57 |
-0.11 |
-0.10% |
+6.82% |
| Biotech |
$BTK |
5,009.45 |
+70.43 |
+1.43% |
-7.55% |
|
|
|
 |
Found Support Near 50-Day Moving Average After Recent Stall
Kenneth J. Gruneisen - Passed the CAN SLIM® Master's Exam
Axon Enterprise Inc's (AXON +$5.07 or +1.64% to $313.30) posted a 6th consecutive small gain today with below-average volume. It recently found prompt support near its 50-day moving average (DMA) line ($304.32). It sputtered after briefly rising above the new pivot point cited based on its 3/04/24 high plus 10 cents. Subsequent gains and a strong close above the pivot point backed by at least +40% above average volume may trigger a technical buy signal.
AXON was highlighted in yellow in the 11/08/23 mid-day report (read here) with pivot point cited based on its 10/17/23 high after a cup-with-handle base. It was last shown in detail in this FSU section on 4/08/24 with an annotated graph under the headline, "Volume Totals Cooling While Building a New Base".
Keep in mind it is due to report Mar '24 quarterly results on 5/06/24. Volkume and volatility often increase near earnings news. AXON reported Dec '23 quarterly earnings +60% on +29% sales revenues versus the year-ago period, its 5th strong quarter well above the +25% minimum earnings guideline (C criteria). Annual earnings had a slight downturn in FY '22 after years of strong growth.
The company has a small supply of only 75.3 million shares outstanding (S criteria) which can contribute to greater price volatility in the event of institutional buying or selling. The number of top-rated funds owning its shares rose from 978 in Mar '23 to 1,533 in Mar '24, a reassuring sign concerning the I criteria. AXON has a Timeliness Rating of A and an Accumulation/Distribution Rating of C-. Charts courtesy www.stockcharts.com 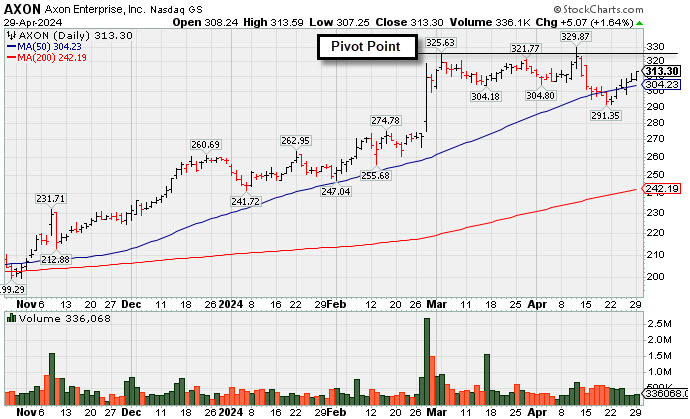
Symbol/Exchange
Company Name
Industry Group | PRICE | CHANGE
(%Change) | Day High | Volume
(% DAV)
(% 50 day avg vol) | 52 Wk Hi
% From Hi | Featured
Date | Price
Featured | Pivot Featured | | Max Buy |  NVO - NYSE NVO - NYSE
Novo Nordisk ADR
Medical-Ethical Drugs | $126.88 | +0.03
0.02% | $127.97 | 1,874,494
39.86% of 50 DAV
50 DAV is 4,703,000 | $138.28
-8.24%
| 3/1/2024 | $124.23 | PP = $124.97 | | MB = $131.22 | Most Recent Note - 4/24/2024 5:13:30 PM
G - Slumped below its 50 DMA line ($126) which may now act as resistance. A rebound above the 50 DMA line is needed for its outlook to improve. See the latest FSU analysis for more details and a new annotated graph.
>>> FEATURED STOCK ARTICLE : Fell Below 50-Day Moving Average Which May Act as Resistance - 4/24/2024 | View all notes | Set NEW NOTE alert | Company Profile | SEC News | Chart | Request a new note C A S I | AXON - NASDAQ
Axon Enterprise
Security/Sfty | $313.30 | +5.07
1.64% | $313.59 | 336,044
63.77% of 50 DAV
50 DAV is 527,000 | $329.87
-5.02%
| 4/5/2024 | $309.90 | PP = $325.73 | | MB = $342.02 |  Most Recent Note - 4/29/2024 5:08:35 PM Most Recent Note - 4/29/2024 5:08:35 PM
Y - Posted a 6th consecutive small gain with below-average volume. It recently found prompt support near its 50 DMA line ($304). A gain and strong close above the pivot point backed by at least +40% above average volume is needed to trigger a proper technical buy signal. Fundamentals remain strong. See the latest FSU analysis for more details and a new annotated graph.
>>> FEATURED STOCK ARTICLE : Found Support Near 50-Day Moving Average After Recent Stall - 4/29/2024 | View all notes | Set NEW NOTE alert | Company Profile | SEC News | Chart | Request a new note C A S I | TDG - NYSE
TransDigm Group
Aerospace/Defense | $1,258.72 | -0.43
-0.03% | $1,269.12 | 123,132
63.47% of 50 DAV
50 DAV is 194,000 | $1,269.51
-0.85%
| 4/12/2024 | $1,224.21 | PP = $1,246.32 | | MB = $1,308.64 | Most Recent Note - 4/29/2024 6:06:46 PM
Y - Volume totals are cooling while holding its ground at its all-time high. New pivot point was cited based on its 4/04/24 high plus 10 cents. Subsequent gains above the pivot point backed by at least +40% above average volume are needed to trigger a proper new technical buy signal. Its 50 DMA line ($1,203) defines near-term support to watch.
>>> FEATURED STOCK ARTICLE : Volume Totals Cooling While Perched Near High - 4/9/2024 | View all notes | Set NEW NOTE alert | Company Profile | SEC News | Chart | Request a new note C A S I | PCAR - NASDAQ
Paccar
Trucks and Parts-Hvy Duty | $113.64 | +1.68
1.50% | $114.17 | 3,733,300
160.37% of 50 DAV
50 DAV is 2,328,000 | $125.50
-9.45%
| 1/23/2024 | $100.35 | PP = $98.57 | | MB = $103.50 | Most Recent Note - 4/24/2024 5:17:09 PM
G - Halted its slide after a recently noted slump below its 50 DMA line ($116) triggered a technical sell signal. A prompt rebound above the 50 DMA line is needed for its outlook to improve. Fundamentals remain strong.
>>> FEATURED STOCK ARTICLE : Pulling Back From High and Slumping Toward 50-Day Moving Average - 4/12/2024 | View all notes | Set NEW NOTE alert | Company Profile | SEC News | Chart | Request a new note C A S I | HUBB - NYSE
Hubbell
Electrical-Power/Equipmt | $407.19 | -0.34
-0.08% | $411.86 | 540,604
134.14% of 50 DAV
50 DAV is 403,000 | $429.61
-5.22%
| 1/30/2024 | $343.26 | PP = $336.83 | | MB = $353.67 | Most Recent Note - 4/24/2024 5:15:39 PM
G - Posted a 3rd consecutive gain today with below-average volume after finding prompt support near its 50 DMA line ($392.82).
>>> FEATURED STOCK ARTICLE : Closed Just Below 50-Day Moving Average With Quiet Loss - 4/19/2024 | View all notes | Set NEW NOTE alert | Company Profile | SEC News | Chart | Request a new note C A S I | Symbol/Exchange
Company Name
Industry Group | PRICE | CHANGE
(%Change) | Day High | Volume
(% DAV)
(% 50 day avg vol) | 52 Wk Hi
% From Hi | Featured
Date | Price
Featured | Pivot Featured | | Max Buy | USLM - NASDAQ
U.S. Lime & Minerals
Bldg-Cement/Concrt/Ag | $309.00 | +1.56
0.51% | $309.83 | 12,263
55.74% of 50 DAV
50 DAV is 22,000 | $308.00
0.32%
| 2/9/2024 | $254.68 | PP = $265.09 | | MB = $278.34 | Most Recent Note - 4/26/2024 4:28:41 PM
G - Posted a gain with light volume today for a best-ever close and perched within close striking distance of its all-time high. Its 50 DMA line ($285) and recent lows define near-term support to watch. See the latest FSU analysis for more details and a new annotated graph.
>>> FEATURED STOCK ARTICLE : Trading in Tight Range Near High - 4/26/2024 | View all notes | Set NEW NOTE alert | Company Profile | SEC News | Chart | Request a new note C A S I | PAY - NYSE
Paymentus Holdings
Finance-CrdtCard/PmtPr | $20.58 | -0.20
-0.96% | $20.97 | 234,993
58.02% of 50 DAV
50 DAV is 405,000 | $25.21
-18.37%
| 3/5/2024 | $19.97 | PP = $18.89 | | MB = $19.83 | Most Recent Note - 4/26/2024 5:07:32 PM
G - Posted a gain today with below-average volume, finding support above its 50 DMA line ($19.93). Prior highs in the $18 range define the next support. More damaging losses would raise greater concerns.
>>> FEATURED STOCK ARTICLE : Prior Highs Define Important Near-Term Support - 4/22/2024 | View all notes | Set NEW NOTE alert | Company Profile | SEC News | Chart | Request a new note C A S I | HUBS - NYSE
HubSpot
Comp Sftwr-Spec Enterprs | $636.16 | +5.03
0.80% | $644.66 | 363,784
68.12% of 50 DAV
50 DAV is 534,000 | $693.85
-8.31%
| 4/4/2024 | $686.66 | PP = $660.10 | | MB = $693.11 | Most Recent Note - 4/25/2024 4:54:07 PM
Y - Pulled back again today with near average volume, testing support at its 50 DMA line ($627) and recent lows. Stalled after highlighted yellow in the 4/04/24 mid-day report with pivot point cited based on its 2/09/24 high plus 10 cents. Fundamentals remain strong. See the latest FSU analysis for more details and an annotated graph.
>>> FEATURED STOCK ARTICLE : HUBS Testing 50-day Moving Average Line Again - 4/25/2024 | View all notes | Set NEW NOTE alert | Company Profile | SEC News | Chart | Request a new note C A S I |
|
|
|
Color Codes Explained :
Y - Better candidates highlighted by our
staff of experts.
G - Previously featured
in past reports as yellow but may no longer be buyable under the
guidelines.
***Last / Change / Volume data in this table is the closing quote data***
|
|
|
THESE ARE NOT BUY RECOMMENDATIONS!
Comments contained in the body of this report are technical
opinions only. The material herein has been obtained
from sources believed to be reliable and accurate, however,
its accuracy and completeness cannot be guaranteed.
This site is not an investment advisor, hence it does
not endorse or recommend any securities or other investments.
Any recommendation contained in this report may not
be suitable for all investors and it is not to be deemed
an offer or solicitation on our part with respect to
the purchase or sale of any securities. All trademarks,
service marks and trade names appearing in this report
are the property of their respective owners, and are
likewise used for identification purposes only.
This report is a service available
only to active Paid Premium Members.
You may opt-out of receiving report notifications
at any time. Questions or comments may be submitted
by writing to Premium Membership Services 665 S.E. 10 Street, Suite 201 Deerfield Beach, FL 33441-5634 or by calling 1-800-965-8307
or 954-785-1121.
|
|
|