You are not logged in.
This means you
CAN ONLY VIEW reports that were published prior to Sunday, April 6, 2025.
You
MUST UPGRADE YOUR MEMBERSHIP if you want to see any current reports.
AFTER MARKET UPDATE - WEDNESDAY, APRIL 24TH, 2024
Previous After Market Report Next After Market Report >>>
|
|
|
|
DOW |
-42.77 |
38,460.92 |
-0.11% |
|
Volume |
931,747,880 |
+3% |
|
Volume |
4,770,213,000 |
-5% |
|
NASDAQ |
+16.11 |
15,712.75 |
+0.10% |
|
Advancers |
1,185 |
43% |
|
Advancers |
1,816 |
44% |
|
S&P 500 |
+1.08 |
5,071.63 |
+0.02% |
|
Decliners |
1,554 |
57% |
|
Decliners |
2,322 |
56% |
|
Russell 2000 |
-7.22 |
1,995.43 |
-0.36% |
|
52 Wk Highs |
53 |
|
|
52 Wk Highs |
55 |
|
|
S&P 600 |
-3.41 |
1,284.75 |
-0.26% |
|
52 Wk Lows |
29 |
|
|
52 Wk Lows |
119 |
|
|
Since Wednesday April 10th members of FACTBASEDINVESTING.COM were cautioned as a shift in conditions (M criteria) signaled a market "correction". Use greater caution, raise cash and reduce exposure by selling any weakening stocks on a case-by-case basis. New buying efforts will be avoided by disciplined investors until a solid follow-through day is noted confirming a new uptrend.
|
 |
Breadth Negative and Indices Little Changed as Leadership Improves
Kenneth J. Gruneisen - Passed the CAN SLIM® Master's Exam
The S&P 500 Index finished nearly unchanged and the Nasdaq Composite Index gained 0.1%, meanwhile, the Dow Jones Industrial Average (-0.1%) and Russell 2000 (-0.4%) both ended lower. Volume reported was higher than the prior session total on the NYSE but lighter on the Nasdaq exchange. Breadth was negative as decliners led advancers by about a 4-3 margin on the NYSE and on the Nasdaq exchange. There were 31 high-ranked companies from the Leaders List that hit new 52-week highs and were listed on the BreakOuts Page versus 29 on the prior session. New 52-week highs outnumbered new 52-week lows on the NYSE but new 52-week lows still outnumbered new highs on the Nasdaq exchange. The major indices recently signaled a market correction (M criteria). Greater caution is important for all investors until a follow-through day signals a new confirmed uptrend.
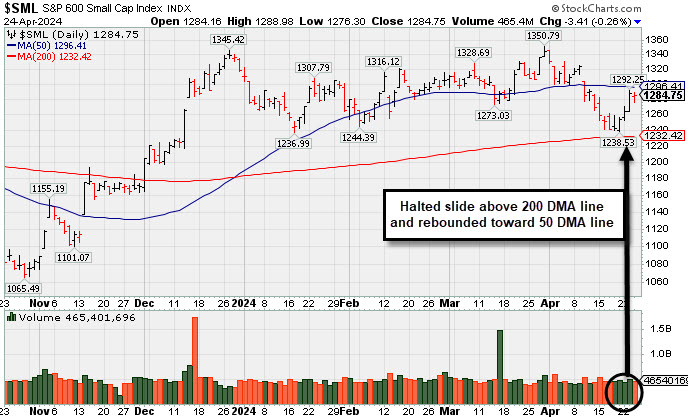
PICTURED: The S&P 600 Small Cap Index paused after 4 consecutive gains, finding support above its 200-day moving average (DMA) line and rebounding toward its 50-day moving average (DMA) line.
The release of the Durable Orders report for March beat expectations. A positive response to earnings boosted Tesla (TSLA +12.06%) as the company acknowledgment that production of affordable models will begin in early 2025, if not late 2024, despite missing earnings and revenue estimates. Texas Instruments (TXN +5.64%) rose after suggesting that some industrial customers are nearing the end of an inventory correction cycle. Boeing (BA -2.87%) and Humana (HUM -3.66%) both fell following their quarterly results.
Seven of the S&P 500 sectors closed with a gain. Consumer staples (+0.9%) was the leading sector, meanwhile, the industrial sector saw the largest decline, down -0.8%.
The 10-yr note yield settled five basis points higher at 4.65% and the 2-yr note yield rose two basis points to 4.94%. A record-sized $70 billion 5-yr note offering met weaker demand than Tuesday's 2-yr note sale.
|
 Kenneth J. Gruneisen started out as a licensed stockbroker in August 1987, a couple of months prior to the historic stock market crash that took the Dow Jones Industrial Average down -22.6% in a single day. He has published daily fact-based fundamental and technical analysis on high-ranked stocks online for two decades. Through FACTBASEDINVESTING.COM, Kenneth provides educational articles, news, market commentary, and other information regarding proven investment systems that work in good times and bad.
Comments contained in the body of this report are technical opinions only and are not necessarily those of Gruneisen Growth Corp. The material herein has been obtained from sources believed to be reliable and accurate, however, its accuracy and completeness cannot be guaranteed. Our firm, employees, and customers may effect transactions, including transactions contrary to any recommendation herein, or have positions in the securities mentioned herein or options with respect thereto. Any recommendation contained in this report may not be suitable for all investors and it is not to be deemed an offer or solicitation on our part with respect to the purchase or sale of any securities. |
|
 |
Financial and Tech Indexes Rose but Retail Index Fell
Kenneth J. Gruneisen - Passed the CAN SLIM® Master's Exam
The Bank Index ($BKX +0.39%) and the Broker/Dealer Index ($XBD +0.61%) both posted modest gains, but the Retail Index ($RLX -1.32%) slumped and had a negative impact on the major indices. The tech sector had a positive bias as the Semiconductor Index ($SOX +1.06%) and Networking Index ($NWX +0.74%) both posted gains but the Biotech Index ($BTK -0.03%) finished flat. Commodity-linked groups were indecisive as the Gold & Silver Index ($XAU +0.15%), Integrated Oil Index ($XOI +0.09%), and the Oil Services Index ($OSX -0.24%) were little changed.
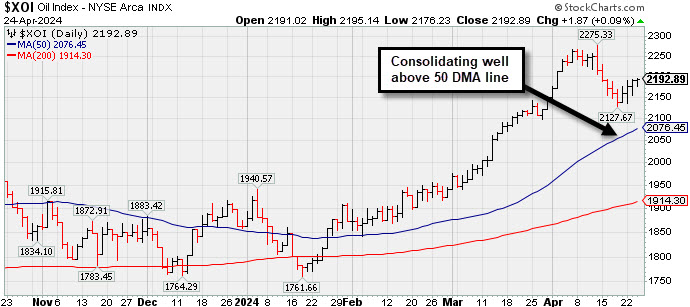
![]() PICTURED: The Integrated Oil Index ($XOI +0.09%) has recently been consolidating well above its 50-day moving average (DMA) line.
| Oil Services |
$OSX |
88.51 |
-0.22 |
-0.24% |
+5.51% |
| Integrated Oil |
$XOI |
2,192.89 |
+1.87 |
+0.09% |
+17.74% |
| Semiconductor |
$SOX |
4,526.20 |
+47.40 |
+1.06% |
+8.40% |
| Networking |
$NWX |
748.97 |
+5.51 |
+0.74% |
-10.07% |
| Broker/Dealer |
$XBD |
595.72 |
+3.62 |
+0.61% |
+6.90% |
| Retail |
$RLX |
4,288.23 |
-57.30 |
-1.32% |
+10.27% |
| Gold & Silver |
$XAU |
133.05 |
+0.20 |
+0.15% |
+5.86% |
| Bank |
$BKX |
103.56 |
+0.40 |
+0.39% |
+7.86% |
| Biotech |
$BTK |
4,988.38 |
-1.41 |
-0.03% |
-7.94% |
|
|
|
 |
Fell Below 50-Day Moving Average Which May Act as Resistance
Kenneth J. Gruneisen - Passed the CAN SLIM® Master's Exam
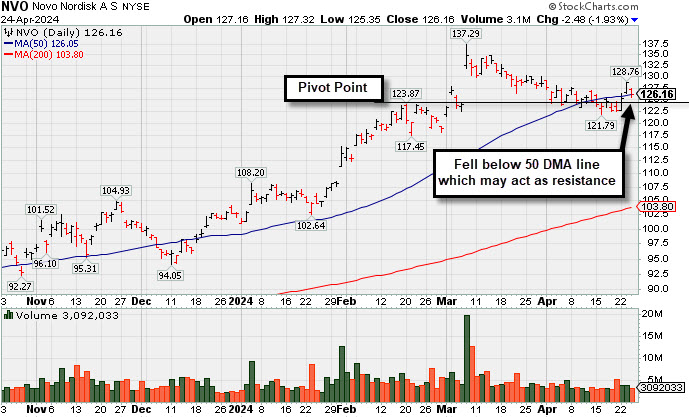
Novo Nordisk (NVO -$2.48 or -1.93% to $126.16) pulled back and closed just below its 50-day moving average (DMA) line ($126.55) which may now act as resistance. The next near-term support to watch is prior lows in the $118 area. Its color code was changed to yellow while testing near the pivot point of the previously noted "3-weeks tight" base.
Keep in mind that this Denmark-based Medical - Ethical Drugs firm is due to report Mar '24 quarterly results on 5/02/24. Volume and volatility often increase near earnings news. NVO reported Dec '23 quarterly earnings +68% on +41% sales revenues versus the year-ago period, its 4th strong quarter well above the +25% minimum earnings guideline (C criteria). Annual earnings growth has been strong and steady. It has a 98 Earnings Per Share Rating, well above the 80+ minimum for buy candidates.
The number of top-rated funds owning its shares rose from 372 in Dec '22 to 532 in Mar '24, a reassuring sign concerning the I criteria. Its current Up/Down Volume Ratio of 0.8 is an unbiased indication its shares have been under distributional pressure over the past 50 days. It has a Timeliness Rating of B and an Accumulation/Distribution Rating of B+.
Symbol/Exchange
Company Name
Industry Group | PRICE | CHANGE
(%Change) | Day High | Volume
(% DAV)
(% 50 day avg vol) | 52 Wk Hi
% From Hi | Featured
Date | Price
Featured | Pivot Featured | | Max Buy |  NVO - NYSE NVO - NYSE
Novo Nordisk ADR
Medical-Ethical Drugs | $126.16 | -2.48
-1.93% | $127.32 | 3,092,009
64.52% of 50 DAV
50 DAV is 4,792,000 | $138.28
-8.76%
| 3/1/2024 | $124.23 | PP = $124.97 | | MB = $131.22 |  Most Recent Note - 4/24/2024 5:13:30 PM Most Recent Note - 4/24/2024 5:13:30 PM
G - Slumped below its 50 DMA line ($126) which may now act as resistance. A rebound above the 50 DMA line is needed for its outlook to improve. See the latest FSU analysis for more details and a new annotated graph.
>>> FEATURED STOCK ARTICLE : Fell Below 50-Day Moving Average Which May Act as Resistance - 4/24/2024 | View all notes | Set NEW NOTE alert | Company Profile | SEC News | Chart | Request a new note C A S I | AXON - NASDAQ
Axon Enterprise
Security/Sfty | $302.41 | +0.85
0.28% | $308.12 | 492,314
93.24% of 50 DAV
50 DAV is 528,000 | $329.87
-8.32%
| 4/5/2024 | $309.90 | PP = $325.73 | | MB = $342.02 | Most Recent Note - 4/23/2024 5:59:01 PM
Y - Posted a gain today with near-average volume and closed just above its 50 DMA line ($301). Color code was changed to yellow with new pivot point cited based on its 3/04/24 high plus 10 cents. A gain above the pivot point backed by at least +40% above average volume is needed to trigger a proper technical buy signal. Fundamentals remain strong.
>>> FEATURED STOCK ARTICLE : Volume Totals Cooling While Building a New Base - 4/8/2024 | View all notes | Set NEW NOTE alert | Company Profile | SEC News | Chart | Request a new note C A S I | TDG - NYSE
TransDigm Group
Aerospace/Defense | $1,241.62 | -0.78
-0.06% | $1,255.59 | 218,686
111.57% of 50 DAV
50 DAV is 196,000 | $1,248.39
-0.54%
| 4/12/2024 | $1,224.21 | PP = $1,246.32 | | MB = $1,308.64 | Most Recent Note - 4/23/2024 5:54:37 PM
Y - Posted a solid gain today with +22% above average volume for a best-ever close. Color code was changed to yellow after holding its ground in a tight range near its all-time high. New pivot point was cited based on its 4/04/24 high plus 10 cents. Subsequent gains above the pivot point backed by at least +40% above average volume are needed to trigger a proper new technical buy signal. Its 50 DMA line ($1,193) defines near-term support to watch.
>>> FEATURED STOCK ARTICLE : Volume Totals Cooling While Perched Near High - 4/9/2024 | View all notes | Set NEW NOTE alert | Company Profile | SEC News | Chart | Request a new note C A S I | PCAR - NASDAQ
Paccar
Trucks and Parts-Hvy Duty | $113.74 | +0.42
0.37% | $114.83 | 2,597,639
114.84% of 50 DAV
50 DAV is 2,262,000 | $125.50
-9.37%
| 1/23/2024 | $100.35 | PP = $98.57 | | MB = $103.50 | Most Recent Note - 4/24/2024 5:17:09 PM
G - Halted its slide after a recently noted slump below its 50 DMA line ($116) triggered a technical sell signal. A prompt rebound above the 50 DMA line is needed for its outlook to improve. Fundamentals remain strong.
>>> FEATURED STOCK ARTICLE : Pulling Back From High and Slumping Toward 50-Day Moving Average - 4/12/2024 | View all notes | Set NEW NOTE alert | Company Profile | SEC News | Chart | Request a new note C A S I | HUBB - NYSE
Hubbell
Electrical-Power/Equipmt | $398.55 | +0.55
0.14% | $408.00 | 335,232
83.39% of 50 DAV
50 DAV is 402,000 | $429.61
-7.23%
| 1/30/2024 | $343.26 | PP = $336.83 | | MB = $353.67 | Most Recent Note - 4/24/2024 5:15:39 PM
G - Posted a 3rd consecutive gain today with below-average volume after finding prompt support near its 50 DMA line ($392.82).
>>> FEATURED STOCK ARTICLE : Closed Just Below 50-Day Moving Average With Quiet Loss - 4/19/2024 | View all notes | Set NEW NOTE alert | Company Profile | SEC News | Chart | Request a new note C A S I | Symbol/Exchange
Company Name
Industry Group | PRICE | CHANGE
(%Change) | Day High | Volume
(% DAV)
(% 50 day avg vol) | 52 Wk Hi
% From Hi | Featured
Date | Price
Featured | Pivot Featured | | Max Buy | USLM - NASDAQ
U.S. Lime & Minerals
Bldg-Cement/Concrt/Ag | $304.00 | -0.28
-0.09% | $305.50 | 18,369
79.87% of 50 DAV
50 DAV is 23,000 | $308.00
-1.30%
| 2/9/2024 | $254.68 | PP = $265.09 | | MB = $278.34 | Most Recent Note - 4/23/2024 6:01:02 PM
G - Posted a 3rd consecutive gain today challenging its all-time high. Its 50 DMA line ($282.71) defines near-term support to watch.
>>> FEATURED STOCK ARTICLE : Gain With Light Volume for Best Ever Close - 4/5/2024 | View all notes | Set NEW NOTE alert | Company Profile | SEC News | Chart | Request a new note C A S I | PAY - NYSE
Paymentus Holdings
Finance-CrdtCard/PmtPr | $20.62 | +0.44
2.18% | $20.66 | 331,108
83.82% of 50 DAV
50 DAV is 395,000 | $25.21
-18.21%
| 3/5/2024 | $19.97 | PP = $18.89 | | MB = $19.83 | Most Recent Note - 4/24/2024 5:18:52 PM
G - Posted a 3rd consecutive gain today with ever-increasing (but below-average) volume, finding support near its 50 DMA line ($19.75). Prior highs in the $18 range define the next support. More damaging losses would raise greater concerns.
>>> FEATURED STOCK ARTICLE : Prior Highs Define Important Near-Term Support - 4/22/2024 | View all notes | Set NEW NOTE alert | Company Profile | SEC News | Chart | Request a new note C A S I | HUBS - NYSE
HubSpot
Comp Sftwr-Spec Enterprs | $651.74 | -0.04
-0.01% | $664.02 | 399,494
73.17% of 50 DAV
50 DAV is 546,000 | $693.85
-6.07%
| 4/4/2024 | $686.66 | PP = $660.10 | | MB = $693.11 | Most Recent Note - 4/23/2024 6:03:00 PM
Y - Posted a solid gain today with +25% above average volume, finding support at its 50 DMA line ($626). Stalled after highlighted yellow in the 4/04/24 mid-day report with pivot point cited based on its 2/09/24 high plus 10 cents. Fundamentals remain strong. Faces some resistance due to old overhead supply up to the $866 level.
>>> FEATURED STOCK ARTICLE : Encountered Distributional Pressure and Finished Below Pivot Point - 4/4/2024 | View all notes | Set NEW NOTE alert | Company Profile | SEC News | Chart | Request a new note C A S I |
|
|
|
Color Codes Explained :
Y - Better candidates highlighted by our
staff of experts.
G - Previously featured
in past reports as yellow but may no longer be buyable under the
guidelines.
***Last / Change / Volume data in this table is the closing quote data***
Symbol/Exchange
Company Name
Industry Group |
PRICE |
CHANGE
(%Change) |
Day High |
Volume
(% DAV)
(% 50 day avg vol) |
52 Wk Hi
% From Hi |
Featured
Date |
Price
Featured |
Pivot Featured |
|
Max Buy |
 NVO
-
NYSE
NVO
-
NYSE
Novo Nordisk ADR
Medical-Ethical Drugs
|
$128.64
|
+3.38
2.70% |
$128.76
|
3,697,696
76.65% of 50 DAV
50 DAV is 4,824,000
|
$138.28
-6.97%
|
3/1/2024
|
$124.23
|
PP = $124.97
|
|
MB = $131.22
|
Most Recent Note - 4/22/2024 11:36:58 PM
G - Consolidating just below its 50 DMA line ($126) which may now act as resistance. A rebound above the 50 DMA line is needed for its outlook to improve.
>>> FEATURED STOCK ARTICLE : Volume Cools While Consolidating Above 50-Day Moving Average Line - 4/3/2024 |
View all notes |
Set NEW NOTE alert |
Company Profile |
SEC
News |
Chart |
Request a new note
C
A
S
I |
AXON
-
NASDAQ
Axon Enterprise
Security/Sfty
|
$301.56
|
+7.76
2.64% |
$302.57
|
461,277
88.20% of 50 DAV
50 DAV is 523,000
|
$329.87
-8.58%
|
4/5/2024
|
$309.90
|
PP = $325.73
|
|
MB = $342.02
|
 Most Recent Note - 4/23/2024 5:59:01 PM
Y - Posted a gain today with near-average volume and closed just above its 50 DMA line ($301). Color code was changed to yellow with new pivot point cited based on its 3/04/24 high plus 10 cents. A gain above the pivot point backed by at least +40% above average volume is needed to trigger a proper technical buy signal. Fundamentals remain strong.
>>> FEATURED STOCK ARTICLE : Volume Totals Cooling While Building a New Base - 4/8/2024 |
View all notes |
Set NEW NOTE alert |
Company Profile |
SEC
News |
Chart |
Request a new note
C
A
S
I |
TDG
-
NYSE
TransDigm Group
Aerospace/Defense
|
$1,242.40
|
+41.47
3.45% |
$1,244.66
|
241,372
122.52% of 50 DAV
50 DAV is 197,000
|
$1,248.39
-0.48%
|
4/12/2024
|
$1,224.21
|
PP = $1,246.32
|
|
MB = $1,308.64
|
Most Recent Note - 4/23/2024 5:54:37 PM
Y - Posted a solid gain today with +22% above average volume for a best-ever close. Color code was changed to yellow after holding its ground in a tight range near its all-time high. New pivot point was cited based on its 4/04/24 high plus 10 cents. Subsequent gains above the pivot point backed by at least +40% above average volume are needed to trigger a proper new technical buy signal. Its 50 DMA line ($1,193) defines near-term support to watch.
>>> FEATURED STOCK ARTICLE : Volume Totals Cooling While Perched Near High - 4/9/2024 |
View all notes |
Set NEW NOTE alert |
Company Profile |
SEC
News |
Chart |
Request a new note
C
A
S
I |
PCAR
-
NASDAQ
Paccar
Trucks and Parts-Hvy Duty
|
$113.32
|
+0.74
0.66% |
$113.66
|
2,399,673
106.94% of 50 DAV
50 DAV is 2,244,000
|
$125.50
-9.71%
|
1/23/2024
|
$100.35
|
PP = $98.57
|
|
MB = $103.50
|
Most Recent Note - 4/19/2024 12:06:30 PM
G - Violated its 50 DMA line ($115) this week triggering a technical sell signal and it is on track today for a 6th consecutive loss. A prompt rebound above the 50 DMA line is needed for its outlook to improve. Fundamentals remain strong.
>>> FEATURED STOCK ARTICLE : Pulling Back From High and Slumping Toward 50-Day Moving Average - 4/12/2024 |
View all notes |
Set NEW NOTE alert |
Company Profile |
SEC
News |
Chart |
Request a new note
C
A
S
I |
HUBB
-
NYSE
Hubbell
Electrical-Power/Equipmt
|
$398.00
|
+7.44
1.90% |
$400.48
|
255,026
63.28% of 50 DAV
50 DAV is 403,000
|
$429.61
-7.36%
|
1/30/2024
|
$343.26
|
PP = $336.83
|
|
MB = $353.67
|
Most Recent Note - 4/19/2024 6:40:48 PM
G - Closed below its 50 DMA line ($390) with a loss today on near-average volume raising concerns. Slumped for 8 losses in the span of 10 sessions after a noted "negative reversal" at its all-time high on 4/04/24. See the latest FSU analysis for more details and a new annotated graph.
>>> FEATURED STOCK ARTICLE : Closed Just Below 50-Day Moving Average With Quiet Loss - 4/19/2024 |
View all notes |
Set NEW NOTE alert |
Company Profile |
SEC
News |
Chart |
Request a new note
C
A
S
I |
Symbol/Exchange
Company Name
Industry Group |
PRICE |
CHANGE
(%Change) |
Day High |
Volume
(% DAV)
(% 50 day avg vol) |
52 Wk Hi
% From Hi |
Featured
Date |
Price
Featured |
Pivot Featured |
|
Max Buy |
USLM
-
NASDAQ
U.S. Lime & Minerals
Bldg-Cement/Concrt/Ag
|
$304.28
|
+3.92
1.31% |
$307.78
|
22,966
99.85% of 50 DAV
50 DAV is 23,000
|
$308.00
-1.21%
|
2/9/2024
|
$254.68
|
PP = $265.09
|
|
MB = $278.34
|
Most Recent Note - 4/23/2024 6:01:02 PM
G - Posted a 3rd consecutive gain today challenging its all-time high. Its 50 DMA line ($282.71) defines near-term support to watch.
>>> FEATURED STOCK ARTICLE : Gain With Light Volume for Best Ever Close - 4/5/2024 |
View all notes |
Set NEW NOTE alert |
Company Profile |
SEC
News |
Chart |
Request a new note
C
A
S
I |
PAY
-
NYSE
Paymentus Holdings
Finance-CrdtCard/PmtPr
|
$20.18
|
+0.82
4.24% |
$20.18
|
218,309
55.55% of 50 DAV
50 DAV is 393,000
|
$25.21
-19.95%
|
3/5/2024
|
$19.97
|
PP = $18.89
|
|
MB = $19.83
|
Most Recent Note - 4/23/2024 5:57:26 PM
G - Posted a solid gain today, finding support near its 50 DMA line ($19.68). Prior highs in the $18 range define the next support. More damaging losses would raise greater concerns. See the latest FSU analysis for more details and an annotated graph.
>>> FEATURED STOCK ARTICLE : Prior Highs Define Important Near-Term Support - 4/22/2024 |
View all notes |
Set NEW NOTE alert |
Company Profile |
SEC
News |
Chart |
Request a new note
C
A
S
I |
HUBS
-
NYSE
HubSpot
Comp Sftwr-Spec Enterprs
|
$651.78
|
+18.74
2.96% |
$656.80
|
680,621
125.34% of 50 DAV
50 DAV is 543,000
|
$693.85
-6.06%
|
4/4/2024
|
$686.66
|
PP = $660.10
|
|
MB = $693.11
|
Most Recent Note - 4/23/2024 6:03:00 PM
Y - Posted a solid gain today with +25% above average volume, finding support at its 50 DMA line ($626). Stalled after highlighted yellow in the 4/04/24 mid-day report with pivot point cited based on its 2/09/24 high plus 10 cents. Fundamentals remain strong. Faces some resistance due to old overhead supply up to the $866 level.
>>> FEATURED STOCK ARTICLE : Encountered Distributional Pressure and Finished Below Pivot Point - 4/4/2024 |
View all notes |
Set NEW NOTE alert |
Company Profile |
SEC
News |
Chart |
Request a new note
C
A
S
I |
|
|
|
THESE ARE NOT BUY RECOMMENDATIONS!
Comments contained in the body of this report are technical
opinions only. The material herein has been obtained
from sources believed to be reliable and accurate, however,
its accuracy and completeness cannot be guaranteed.
This site is not an investment advisor, hence it does
not endorse or recommend any securities or other investments.
Any recommendation contained in this report may not
be suitable for all investors and it is not to be deemed
an offer or solicitation on our part with respect to
the purchase or sale of any securities. All trademarks,
service marks and trade names appearing in this report
are the property of their respective owners, and are
likewise used for identification purposes only.
This report is a service available
only to active Paid Premium Members.
You may opt-out of receiving report notifications
at any time. Questions or comments may be submitted
by writing to Premium Membership Services 665 S.E. 10 Street, Suite 201 Deerfield Beach, FL 33441-5634 or by calling 1-800-965-8307
or 954-785-1121.
|
|
|