You are not logged in.
This means you
CAN ONLY VIEW reports that were published prior to Monday, April 7, 2025.
You
MUST UPGRADE YOUR MEMBERSHIP if you want to see any current reports.
AFTER MARKET UPDATE - FRIDAY, APRIL 12TH, 2024
Previous After Market Report Next After Market Report >>>
|
|
|
|
DOW |
-475.84 |
37,983.24 |
-1.24% |
|
Volume |
934,795,607 |
+8% |
|
Volume |
4,603,587,300 |
-4% |
|
NASDAQ |
-267.10 |
16,175.09 |
-1.62% |
|
Advancers |
454 |
16% |
|
Advancers |
985 |
23% |
|
S&P 500 |
-75.65 |
5,123.41 |
-1.46% |
|
Decliners |
2,323 |
84% |
|
Decliners |
3,277 |
77% |
|
Russell 2000 |
-39.43 |
2,003.17 |
-1.93% |
|
52 Wk Highs |
52 |
|
|
52 Wk Highs |
50 |
|
|
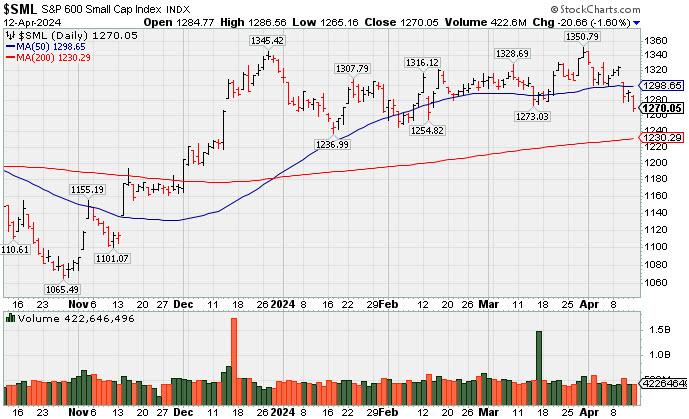
S&P 600 |
-20.66 |
1,270.05 |
-1.60% |
|
52 Wk Lows |
64 |
|
|
52 Wk Lows |
212 |
|
|
Continued distributional action has signaled a shift in (M criteria) conditions from an "uptrend under pressure" to a market "correction". Use greater caution, raise cash and reduce exposure by selling any weakening stocks on a case-by-case basis.
|
 |
Breadth Negative as Major Indices Suffer More Damaging Losses
Kenneth J. Gruneisen - Passed the CAN SLIM® Master's Exam
The Dow Jones Industrial Average logged a 1.2% decline, the S&P 500 fell 1.5%, the Nasdaq Composite slid 1.6%, and the Russell 2000 closed with a 1.9% loss. Volume reported was mixed, higher than the prior session total on the NYSE and lighter on the Nasdaq exchange. Breadth was clearly negative as decliners led advancers by a 5-1 margin on the NYSE and by a 3-1 margin on the Nasdaq exchange. There were 14 high-ranked companies from the Leaders List that hit new 52-week highs and were listed on the BreakOuts Page, versus the total of 19 on the prior session. New 52-week lows totals expanded and outnumbered new 52-week highs on the NYSE and on the Nasdaq exchange. The major indices have shown distributional action indicative of a market correction (M criteria). Greater caution is important for all investors. Always stand ready to protect against losses.
PICTURED: The S&P 600 Small Cap Index is slumping below its 50-day moving average (DMA) line.
Heightened geopolitical uncertainty contributed to the market's sell-off. Concerns were related to reports that Iran could soon attack Israel. Oil prices moved higher ($85.58/bbl, +0.58, +0.7%) on worries about supply disruptions. Global growth concerns were also raised as China reported weaker-than-expected exports (-7.5% yr/yr) and imports (-1.9% yr/yr) for March.
All 11 S&P 500 sectors registered declines ranging from -0.7% (utilities) to -1.8% (materials). The Q1 earnings reporting period started on a weak note as JP Morgan Chase (JPM -6.47%) CEO Jamie Dimon made cautious-sounding macro comments. Citigroup (C -1.70%) and Wells Fargo (WFC -0.39%) also logged declines after their earnings results. The 2-yr note yield fell nine basis points to 4.88%. The 10-yr note yield declined eight basis points to 4.50%.
|
 Kenneth J. Gruneisen started out as a licensed stockbroker in August 1987, a couple of months prior to the historic stock market crash that took the Dow Jones Industrial Average down -22.6% in a single day. He has published daily fact-based fundamental and technical analysis on high-ranked stocks online for two decades. Through FACTBASEDINVESTING.COM, Kenneth provides educational articles, news, market commentary, and other information regarding proven investment systems that work in good times and bad.
Comments contained in the body of this report are technical opinions only and are not necessarily those of Gruneisen Growth Corp. The material herein has been obtained from sources believed to be reliable and accurate, however, its accuracy and completeness cannot be guaranteed. Our firm, employees, and customers may effect transactions, including transactions contrary to any recommendation herein, or have positions in the securities mentioned herein or options with respect thereto. Any recommendation contained in this report may not be suitable for all investors and it is not to be deemed an offer or solicitation on our part with respect to the purchase or sale of any securities. |
|
 |
Retail, Financial, Tech, and Commodity-Linked Groups Fell
Kenneth J. Gruneisen - Passed the CAN SLIM® Master's Exam
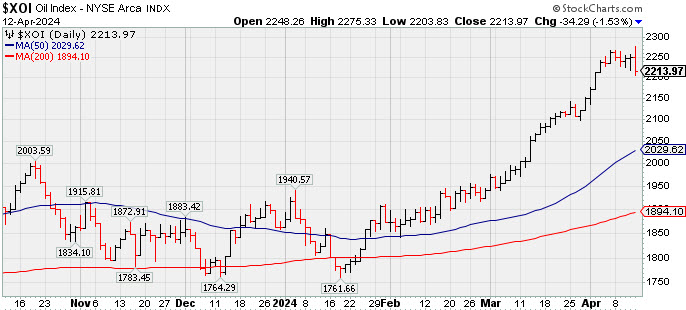
The Broker/Dealer Index ($XBD -1.69%), Bank Index ($BKX -1.46%), and the Retail Index ($RLX -1.49%) each lost ground. The tech sector had a negative bias as the Semiconductor Index ($SOX -3.29%) outpaced the Networking Index ($NWX -3.12%) and the Biotech Index ($BTK -2.06%) to the downside. The Gold & Silver Index ($XAU -1.86%), Integrated Oil Index ($XOI -1.53%), and the Oil Services Index ($OSX -2.52%) rounded out the widel negative session with losses.
![]() PICTURED: The Integrated Oil Index ($XOI -1.53%) is consolidating near its 2024 high.
| Oil Services |
$OSX |
90.79 |
-2.35 |
-2.52% |
+8.24% |
| Integrated Oil |
$XOI |
2,213.97 |
-34.29 |
-1.53% |
+18.87% |
| Semiconductor |
$SOX |
4,745.05 |
-161.32 |
-3.29% |
+13.64% |
| Networking |
$NWX |
753.17 |
-24.24 |
-3.12% |
-9.56% |
| Broker/Dealer |
$XBD |
584.04 |
-10.05 |
-1.69% |
+4.80% |
| Retail |
$RLX |
4,453.93 |
-67.39 |
-1.49% |
+14.53% |
| Gold & Silver |
$XAU |
136.11 |
-2.58 |
-1.86% |
+8.29% |
| Bank |
$BKX |
98.08 |
-1.45 |
-1.46% |
+2.15% |
| Biotech |
$BTK |
5,065.66 |
-106.77 |
-2.06% |
-6.52% |
|
|
|
 |
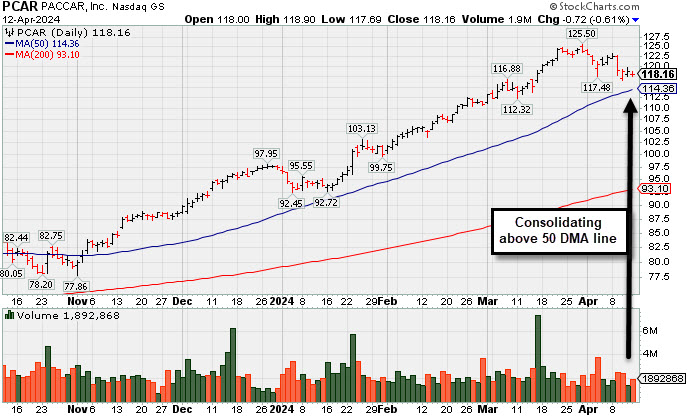
Pulling Back From High and Slumping Toward 50-Day Moving Average
Kenneth J. Gruneisen - Passed the CAN SLIM® Master's Exam
Paccar (PCAR -$0.72 or -0.61% to $118.16) has been pulling back from its all-time high after getting very extended from any sound base. Its 50-day moving average (DMA) line ($114.41) defines near-term support to watch. Fundamentals remain strong.
Bullish action has continued after it reported Dec '23 quarterly earnings +53% on +11% sales revenues versus the year-ago period, its 9th quarterly comparison with better than the +25% minimum earnings guideline (C criteria). There was a downturn in FY' 20 annual earnings (A criteria) like many companies during the pandemic. PCAR has a 95 Earnings Per Share rating.
PCAR was highlighted in yellow in the 1/23/24 mid-day report (read here). Its gain backed by +153% above average volume for a new 52-week high cleared the pivot point based on its 12/13/23 high plus 10 cents triggering a technical buy signal. It was last shown in detail on 3/21/24 with an annotated graph under the headline, "Hit New High With 5th Consecutive Gain".
The number of top-rated funds owning its shares rose from 2,052 in Mar '23 to 2,215 in Mar '24, a reassuring sign concerning the I criteria. Its current Up/Down Volume Ratio of 1.5 is an unbiased indication its shares have been under accumulation over the past 50 days. It has a Timeliness rating of A and an Accumulation/Distribution rating of C+. |
|
|
Color Codes Explained :
Y - Better candidates highlighted by our
staff of experts.
G - Previously featured
in past reports as yellow but may no longer be buyable under the
guidelines.
***Last / Change / Volume data in this table is the closing quote data***
Symbol/Exchange
Company Name
Industry Group |
PRICE |
CHANGE
(%Change) |
Day High |
Volume
(% DAV)
(% 50 day avg vol) |
52 Wk Hi
% From Hi |
Featured
Date |
Price
Featured |
Pivot Featured |
|
Max Buy |
 ANET
-
NYSE
ANET
-
NYSE
Arista Networks
Computer-Networking
|
$271.22
|
-25.36
-8.55% |
$296.58
|
5,734,165
212.46% of 50 DAV
50 DAV is 2,699,000
|
$307.74
-11.87%
|
3/18/2024
|
$188.84
|
PP = $292.76
|
|
MB = $307.40
|
 Most Recent Note - 4/12/2024 11:56:44 AM
G - Slumping further after a damaging gap down today violating its 50 DMA line ($281.55) and an upward trendline connecting its October-March lows triggering technical sell signals. Color code was changed to green. A rebound above the 50 DMA line is needed for its outlook to improve.
>>> FEATURED STOCK ARTICLE : Consolidating Abover Recent Highs and Above 50-Day Average - 3/26/2024 |
View all notes |
Set NEW NOTE alert |
Company Profile |
SEC
News |
Chart |
Request a new note
C
A
S
I |
NVO
-
NYSE
Novo Nordisk ADR
Medical-Ethical Drugs
|
$124.51
|
-0.89
-0.71% |
$127.06
|
3,210,320
60.01% of 50 DAV
50 DAV is 5,350,000
|
$138.28
-9.96%
|
3/1/2024
|
$124.23
|
PP = $124.97
|
|
MB = $131.22
|
Most Recent Note - 4/12/2024 10:32:29 AM
Y - Finding support at its 50 DMA line ($125.51) this week while volume totals have been cooling. More damaging losses below the recent low ($123.24 on 4/10/24) would raise concerns and trigger a technical sell signal.
>>> FEATURED STOCK ARTICLE : Volume Cools While Consolidating Above 50-Day Moving Average Line - 4/3/2024 |
View all notes |
Set NEW NOTE alert |
Company Profile |
SEC
News |
Chart |
Request a new note
C
A
S
I |
AXON
-
NASDAQ
Axon Enterprise
Security/Sfty
|
$310.88
|
-13.21
-4.08% |
$323.50
|
547,968
107.44% of 50 DAV
50 DAV is 510,000
|
$329.87
-5.76%
|
4/5/2024
|
$309.90
|
PP = $325.73
|
|
MB = $342.02
|
Most Recent Note - 4/12/2024 10:35:33 AM
Y - Pausing today after touching a new high on the prior session with a 5th consecutive gain marked by ever-increasing volume. Color code was changed to yellow with new pivot point cited based on its 3/04/24 high plus 10 cents. A gain above the pivot point backed by at least +40% above average volume is needed to trigger a proper technical buy signal. Its 50-day moving average (DMA) line ($296) defines near-term support to watch. Fundamentals remain strong.
>>> FEATURED STOCK ARTICLE : Volume Totals Cooling While Building a New Base - 4/8/2024 |
View all notes |
Set NEW NOTE alert |
Company Profile |
SEC
News |
Chart |
Request a new note
C
A
S
I |
TDG
-
NYSE
TransDigm Group
Aerospace/Defense
|
$1,220.38
|
-14.55
-1.18% |
$1,231.86
|
185,692
87.18% of 50 DAV
50 DAV is 213,000
|
$1,246.22
-2.07%
|
4/12/2024
|
$1,224.21
|
PP = $1,246.32
|
|
MB = $1,308.64
|
Most Recent Note - 4/12/2024 10:41:16 AM
Y - Color code is changed to yellow after holding its ground in a tight range near its all-time high. New pivot point is cited based on its 4/04/24 high plus 10 cents. Subsequent gains above the pivot point backed by at least +40% above average volume are needed to trigger a proper new technical buy signal. Its 50 DMA line ($1,182) defines near-term support to watch.
>>> FEATURED STOCK ARTICLE : Volume Totals Cooling While Perched Near High - 4/9/2024 |
View all notes |
Set NEW NOTE alert |
Company Profile |
SEC
News |
Chart |
Request a new note
C
A
S
I |
CRWD
-
NASDAQ
CrowdStrike Holdings
Computer Sftwr-Security
|
$309.06
|
-8.74
-2.75% |
$314.87
|
2,169,144
56.53% of 50 DAV
50 DAV is 3,837,000
|
$365.00
-15.33%
|
1/2/2024
|
$246.42
|
PP = $261.91
|
|
MB = $275.01
|
Most Recent Note - 4/12/2024 10:28:12 AM
G - Still lingering below its 50 DMA ($39) with volume totals cooling. A rebound above the 50 DMA line is needed for its outlook to improve. It has not formed a sound base. Fundamentals remain strong after it reported Jan '24 quarterly earnings +102% on +33% sales revenues versus the year-ago period.
>>> FEATURED STOCK ARTICLE : 50-Day Moving Average Line Support Being Tested - 4/1/2024 |
View all notes |
Set NEW NOTE alert |
Company Profile |
SEC
News |
Chart |
Request a new note
C
A
S
I |
Symbol/Exchange
Company Name
Industry Group |
PRICE |
CHANGE
(%Change) |
Day High |
Volume
(% DAV)
(% 50 day avg vol) |
52 Wk Hi
% From Hi |
Featured
Date |
Price
Featured |
Pivot Featured |
|
Max Buy |
PCAR
-
NASDAQ
Paccar
Trucks and Parts-Hvy Duty
|
$118.16
|
-0.72
-0.61% |
$118.90
|
1,975,978
90.27% of 50 DAV
50 DAV is 2,189,000
|
$125.50
-5.85%
|
1/23/2024
|
$100.35
|
PP = $98.57
|
|
MB = $103.50
|
Most Recent Note - 4/12/2024 5:44:01 PM
G - Quietly pulled back from its all-time high after getting very extended from any sound base. Its 50 DMA line ($114.41) defines near-term support to watch. Fundamentals remain strong. See the latest FSU analysis for more details and a new annotated graph.
>>> FEATURED STOCK ARTICLE : Pulling Back From High and Slumping Toward 50-Day Moving Average - 4/12/2024 |
View all notes |
Set NEW NOTE alert |
Company Profile |
SEC
News |
Chart |
Request a new note
C
A
S
I |
HUBB
-
NYSE
Hubbell
Electrical-Power/Equipmt
|
$401.74
|
-4.49
-1.11% |
$406.09
|
405,897
95.96% of 50 DAV
50 DAV is 423,000
|
$429.61
-6.49%
|
1/30/2024
|
$343.26
|
PP = $336.83
|
|
MB = $353.67
|
Most Recent Note - 4/12/2024 10:30:00 AM
G - Pulling back today for a 5th consecutive loss, slumping after a noted "negative reversal" at its all-time high on 4/04/24. It is very extended from the previously noted base. Its 50 DMA line ($386.41) defines important support to watch.
>>> FEATURED STOCK ARTICLE : Hubbell Perched at All-Time High After 5 Weekly Gains - 3/22/2024 |
View all notes |
Set NEW NOTE alert |
Company Profile |
SEC
News |
Chart |
Request a new note
C
A
S
I |
USLM
-
NASDAQ
U.S. Lime & Minerals
Bldg-Cement/Concrt/Ag
|
$293.87
|
+0.12
0.04% |
$298.05
|
34,382
143.26% of 50 DAV
50 DAV is 24,000
|
$308.00
-4.59%
|
2/9/2024
|
$254.68
|
PP = $265.09
|
|
MB = $278.34
|
Most Recent Note - 4/12/2024 12:10:06 PM
G - Still hovering in a tight range in recent weeks near its all-time high, stubbornly holding its ground despite encountering some distributional pressure. Its 50 DMA line ($276.58) defines near-term support to watch.
>>> FEATURED STOCK ARTICLE : Gain With Light Volume for Best Ever Close - 4/5/2024 |
View all notes |
Set NEW NOTE alert |
Company Profile |
SEC
News |
Chart |
Request a new note
C
A
S
I |
NOW
-
NYSE
ServiceNow
Computer Sftwr-Enterprse
|
$768.71
|
-2.63
-0.34% |
$774.96
|
959,446
84.16% of 50 DAV
50 DAV is 1,140,000
|
$815.32
-5.72%
|
2/22/2024
|
$771.75
|
PP = $815.32
|
|
MB = $856.09
|
Most Recent Note - 4/11/2024 5:12:47 PM
Y - Posted a small gain today with below-average (lighter) volume, finding support near its 50 DMA line ($771). Prior lows in the $730 area define the next important near-term support to watch. See the latest FSU analysis for more details and a new annotated graph.
>>> FEATURED STOCK ARTICLE : Quietly Consolidating Near 50-Day Moving Average Line - 4/11/2024 |
View all notes |
Set NEW NOTE alert |
Company Profile |
SEC
News |
Chart |
Request a new note
C
A
S
I |
SNPS
-
NASDAQ
Synopsys
Computer Sftwr-Design
|
$557.35
|
-4.62
-0.82% |
$560.52
|
810,643
75.90% of 50 DAV
50 DAV is 1,068,000
|
$629.38
-11.44%
|
2/22/2024
|
$600.65
|
PP = $582.85
|
|
MB = $611.99
|
Most Recent Note - 4/12/2024 5:45:54 PM
G - Volume totals have been below average as it slumped below its 50 DMA line ($569) raising concerns. The prior low ($546.91 on 3/15/23) defines the next important support where a damaging loss would raise serious concerns and trigger a more worrisome technical sell signal.
>>> FEATURED STOCK ARTICLE : Quietly Slumped Below 50-Day Moving Average Line - 4/10/2024 |
View all notes |
Set NEW NOTE alert |
Company Profile |
SEC
News |
Chart |
Request a new note
C
A
S
I |
Symbol/Exchange
Company Name
Industry Group |
PRICE |
CHANGE
(%Change) |
Day High |
Volume
(% DAV)
(% 50 day avg vol) |
52 Wk Hi
% From Hi |
Featured
Date |
Price
Featured |
Pivot Featured |
|
Max Buy |
PAY
-
NYSE
Paymentus Holdings
Finance-CrdtCard/PmtPr
|
$20.12
|
-0.62
-2.99% |
$20.68
|
245,034
64.82% of 50 DAV
50 DAV is 378,000
|
$25.21
-20.19%
|
3/5/2024
|
$19.97
|
PP = $18.89
|
|
MB = $19.83
|
Most Recent Note - 4/12/2024 5:47:40 PM
G - Pulled back today for a 3rd consecutive loss with below-average volume, slumping near its "max buy" level. Its 50 DMA line ($19.19) defines important near-term support above prior highs in the $18 range.
>>> FEATURED STOCK ARTICLE : Consolidating After Powerful Breakout and Volume-Driven Gains - 3/27/2024 |
View all notes |
Set NEW NOTE alert |
Company Profile |
SEC
News |
Chart |
Request a new note
C
A
S
I |
HUBS
-
NYSE
HubSpot
Comp Sftwr-Spec Enterprs
|
$663.35
|
-18.67
-2.74% |
$679.30
|
469,695
89.47% of 50 DAV
50 DAV is 525,000
|
$693.85
-4.40%
|
4/4/2024
|
$686.66
|
PP = $660.10
|
|
MB = $693.11
|
Most Recent Note - 4/12/2024 5:48:54 PM
Y - Pulled back today with below-average volume. Highlighted yellow in the 4/04/24 mid-day report with pivot point cited based on its 2/09/24 high plus 10 cents. Initial support is at its prior highs and its 50 DMA line ($623). Reported Dec '23 quarterly earnings +59% on +24% sales revenues versus the year-ago period, its 6th consecutive quarterly comparison well above the +25% minimum guideline (C criteria). Annual earnings history (A criteria) has been strong. Faces some resistance due to old overhead supply up to the $866 level.
>>> FEATURED STOCK ARTICLE : Encountered Distributional Pressure and Finished Below Pivot Point - 4/4/2024 |
View all notes |
Set NEW NOTE alert |
Company Profile |
SEC
News |
Chart |
Request a new note
C
A
S
I |
|
|
|
THESE ARE NOT BUY RECOMMENDATIONS!
Comments contained in the body of this report are technical
opinions only. The material herein has been obtained
from sources believed to be reliable and accurate, however,
its accuracy and completeness cannot be guaranteed.
This site is not an investment advisor, hence it does
not endorse or recommend any securities or other investments.
Any recommendation contained in this report may not
be suitable for all investors and it is not to be deemed
an offer or solicitation on our part with respect to
the purchase or sale of any securities. All trademarks,
service marks and trade names appearing in this report
are the property of their respective owners, and are
likewise used for identification purposes only.
This report is a service available
only to active Paid Premium Members.
You may opt-out of receiving report notifications
at any time. Questions or comments may be submitted
by writing to Premium Membership Services 665 S.E. 10 Street, Suite 201 Deerfield Beach, FL 33441-5634 or by calling 1-800-965-8307
or 954-785-1121.
|
|
|