You are not logged in.
This means you
CAN ONLY VIEW reports that were published prior to Monday, March 24, 2025.
You
MUST UPGRADE YOUR MEMBERSHIP if you want to see any current reports.
AFTER MARKET UPDATE - FRIDAY, APRIL 19TH, 2024
Previous After Market Report Next After Market Report >>>
|
|
|
|
DOW |
+211.02 |
37,986.40 |
+0.56% |
|
Volume |
1,070,715,363 |
+20% |
|
Volume |
5,368,340,600 |
+7% |
|
NASDAQ |
-319.49 |
15,282.01 |
-2.05% |
|
Advancers |
1,865 |
68% |
|
Advancers |
2,156 |
52% |
|
S&P 500 |
-43.89 |
4,967.23 |
-0.88% |
|
Decliners |
866 |
32% |
|
Decliners |
2,022 |
48% |
|
Russell 2000 |
+4.70 |
1,947.66 |
+0.24% |
|
52 Wk Highs |
13 |
|
|
52 Wk Highs |
35 |
|
|
S&P 600 |
+11.11 |
1,253.80 |
+0.89% |
|
52 Wk Lows |
39 |
|
|
52 Wk Lows |
213 |
|
|
Continued distributional action recently was noted as it signaled a shift in (M criteria) conditions from an "uptrend under pressure" to a market "correction". Use greater caution, raise cash and reduce exposure by selling any weakening stocks on a case-by-case basis.
|
 |
Major Indices Ended Mixed Session Still Lacking New Leadership
Kenneth J. Gruneisen - Passed the CAN SLIM® Master's Exam
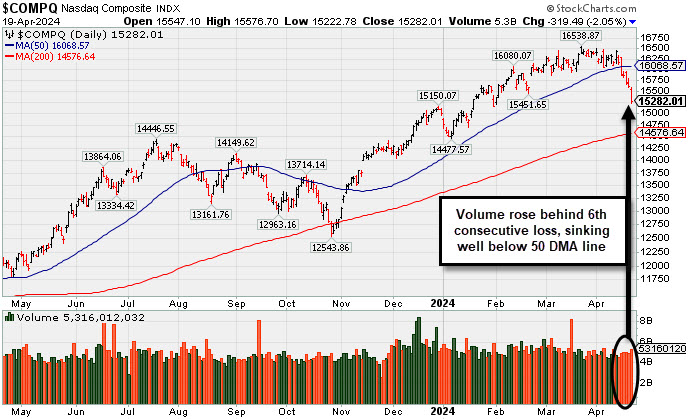
The Dow Jones Industrial Average (+0.6%) and Russell 2000 (+0.2%) posted gains on Friday, meanwhile the the Nasdaq Composite (-2.1%) slumped for big loss and the S&P 500 Index (-0.9%) closed below the 5,000 level for the first time since February. Volume reported was higher than the prior session total on the NYSE and on the Nasdaq exchange. Breadth was positive as advancers led decliners by more than a 2-1 margin on the NYSE, but advancers led by a very narrow margin on the Nasdaq exchange. Leadership remained thin as only 5 high-ranked companies from the Leaders List hit new 52-week highs and were listed on the BreakOuts Page versus 3 on the prior session. New 52-week lows totals contracted yet still outnumbered thin new 52-week highs totals on the NYSE and on the Nasdaq exchange. The major indices have shown distributional action indicative of a market correction (M criteria). Greater caution is important for all investors. Always stand ready to protect against losses.
PICTURED: The Nasdaq Composite Index fell further below its 50-day moving average (DMA) line with higher volume behind Friday's 6th consecutive loss.
Market breadth reflected modest buying activity under the surface despite recent developments in the Middle East. Reports indicated that Israel launched an attack on Iran but the immediate perception was that the strikes were "limited" and caused no major damage. There was no U.S. economic data of note Friday and no fresh economic data of note due on Monday.
Shares of NVIDIA (NVDA -10.0%) tumbled badly on no news, bringing the stock below its 50-day moving average ($840). NVDA is still up 53.9% since the start of the year. The information technology sector (-3.1%), communication services (-2.0%), and consumer discretionary (-1.2%) sectors saw the largest declines. These sectors combined represent nearly 50% of the index. Meanwhile, four of the 11 S&P 500 sectors gained at least +1.0%. Strength in bank stocks drove a 1.4% gain in the financials sector. Dow component American Express (AXP +6.23%) contributed to the financial sector's positive bias. Fellow Dow component Procter & Gamble (PG +0.54%) closed higher after reporting earnings.
|
 Kenneth J. Gruneisen started out as a licensed stockbroker in August 1987, a couple of months prior to the historic stock market crash that took the Dow Jones Industrial Average down -22.6% in a single day. He has published daily fact-based fundamental and technical analysis on high-ranked stocks online for two decades. Through FACTBASEDINVESTING.COM, Kenneth provides educational articles, news, market commentary, and other information regarding proven investment systems that work in good times and bad.
Comments contained in the body of this report are technical opinions only and are not necessarily those of Gruneisen Growth Corp. The material herein has been obtained from sources believed to be reliable and accurate, however, its accuracy and completeness cannot be guaranteed. Our firm, employees, and customers may effect transactions, including transactions contrary to any recommendation herein, or have positions in the securities mentioned herein or options with respect thereto. Any recommendation contained in this report may not be suitable for all investors and it is not to be deemed an offer or solicitation on our part with respect to the purchase or sale of any securities. |
|
 |
Financial and Commodity-Linked Groups Posted Gains
Kenneth J. Gruneisen - Passed the CAN SLIM® Master's Exam
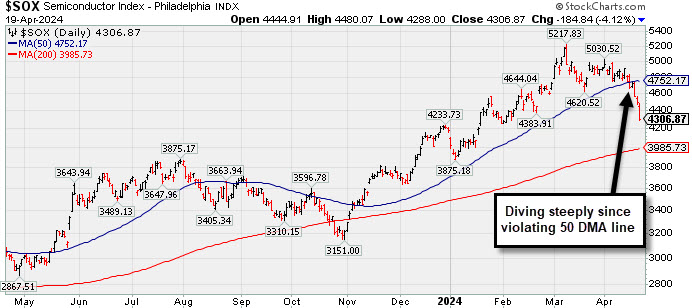
The Bank Index ($BKX +1.93%) outpaced the Broker/Dealer Index ($XBD +0.40%) as both financial indexes posted gains, meanwhile the Retail Index ($RLX -1.46%) created a drag again on the major indices. The tech sector clearly had a negative bias and was led lower by the Semiconductor Index ($SOX -4.12%) while the Networking Index ($NWX -0.48%) suffered a smaller loss and the Biotech Index ($BTK +0.08%) finished flat. Commodity-linked groups had a positive bias as the Gold & Silver Index ($XAU +0.53%), Oil Services Index ($OSX +0.61%), and the Integrated Oil Index ($XOI +1.02%) each ended Friday's session with a gain.
![]() PICTURED: The Semiconductor Index ($SOX -4.12%) is diving steeply since violating its 50-day moving average (DMA) line with recent losses. The semiconductor index has been a reliable leading indictor in the past, so the recent deterioration bodes poorly for the broader market outlook.
| Oil Services |
$OSX |
87.74 |
+0.53 |
+0.61% |
+4.60% |
| Integrated Oil |
$XOI |
2,158.48 |
+21.77 |
+1.02% |
+15.89% |
| Semiconductor |
$SOX |
4,306.87 |
-184.84 |
-4.12% |
+3.15% |
| Networking |
$NWX |
726.08 |
-3.48 |
-0.48% |
-12.82% |
| Broker/Dealer |
$XBD |
579.35 |
+2.29 |
+0.40% |
+3.96% |
| Retail |
$RLX |
4,257.73 |
-63.18 |
-1.46% |
+9.49% |
| Gold & Silver |
$XAU |
136.01 |
+0.72 |
+0.53% |
+8.21% |
| Bank |
$BKX |
100.08 |
+1.90 |
+1.93% |
+4.22% |
| Biotech |
$BTK |
4,865.67 |
+3.91 |
+0.08% |
-10.21% |
|
|
|
 |
Closed Just Below 50-Day Moving Average With Quiet Loss
Kenneth J. Gruneisen - Passed the CAN SLIM® Master's Exam
Hubbell (HUBB -$4.25 or -1.08% to $388.03) pulled back further today with below average volume. It closed just below its 50-day moving average (DMA) line ($390.70) raising concerns amid a deteriorating market environment (M criteria). It has steadily been slumping with 8 losses in the past 10 sessions after a noted "negative reversal" at its all-time high on 4/04/24.
HUBB was highlighted yellow in the earlier mid-day report (read here) with pivot point cited based on its 1/22/24 high as it rose from a cup-with-handle base. It was last shown in great detail in this FSU section on 3/22/24 with an annotated graph under the headline "Hubbell Perched at All-Time High After 5 Weekly Gains".Quarterly earnings increases have been above the +25% minimum (C criteria). Annual earnings history (A criteria) had a downturn in FY '20 like many companies during the pandemic. It has a 95 Earnings Per Share Rating, well above the 80+ minimum for buy candidates.The high-ranked Electrical-Power/Equipmt firm has 53.6 million shares outstanding (S criteria) which can contribute to greater price volatility in the event of institutional buying or selling. The number of top-rated funds owning its shares rose from 805 in Jun '22 to 1,820 in Mar '24, a reassuring sign concerning the I criteria. The current Up/Down Volume Ratio of 1.5 is an unbiased indication it has been under slight accumulation over the past 50 days. It has an A Timeliness Rating and a B Sponsorship Rating.
Chart courtesy of www.stockcharts.com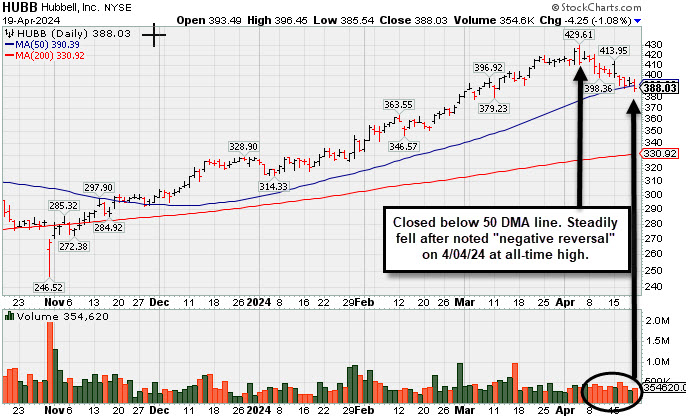 Symbol/Exchange
Company Name
Industry Group | PRICE | CHANGE
(%Change) | Day High | Volume
(% DAV)
(% 50 day avg vol) | 52 Wk Hi
% From Hi | Featured
Date | Price
Featured | Pivot Featured | | Max Buy |  NVO - NYSE NVO - NYSE
Novo Nordisk ADR
Medical-Ethical Drugs | $122.71 | -0.04
-0.03% | $124.54 | 5,176,334
106.51% of 50 DAV
50 DAV is 4,860,000 | $138.28
-11.26%
| 3/1/2024 | $124.23 | PP = $124.97 | | MB = $131.22 | Most Recent Note - 4/17/2024 3:56:57 PM
G - Color code is changed to green while sputtering below its 50 DMA line ($125.96) while volume totals have still been cooling. Losses below prior lows raised concerns and triggered a technical sell signal. A rebound above the 50 DMA line is needed for its outlook to improve.
>>> FEATURED STOCK ARTICLE : Volume Cools While Consolidating Above 50-Day Moving Average Line - 4/3/2024 | View all notes | Set NEW NOTE alert | Company Profile | SEC News | Chart | Request a new note C A S I | AXON - NASDAQ
Axon Enterprise
Security/Sfty | $293.61 | -3.99
-1.34% | $299.53 | 551,167
105.18% of 50 DAV
50 DAV is 524,000 | $329.87
-10.99%
| 4/5/2024 | $309.90 | PP = $325.73 | | MB = $342.02 | Most Recent Note - 4/17/2024 3:43:19 PM
Y - Testing its 50 DMA line ($298.68) today after 3 consecutive losses. Color code was changed to yellow with new pivot point cited based on its 3/04/24 high plus 10 cents. A gain above the pivot point backed by at least +40% above average volume is needed to trigger a proper technical buy signal. Fundamentals remain strong.
>>> FEATURED STOCK ARTICLE : Volume Totals Cooling While Building a New Base - 4/8/2024 | View all notes | Set NEW NOTE alert | Company Profile | SEC News | Chart | Request a new note C A S I | TDG - NYSE
TransDigm Group
Aerospace/Defense | $1,187.70 | -25.80
-2.13% | $1,226.33 | 231,349
112.31% of 50 DAV
50 DAV is 206,000 | $1,248.39
-4.86%
| 4/12/2024 | $1,224.21 | PP = $1,246.32 | | MB = $1,308.64 | Most Recent Note - 4/17/2024 4:03:56 PM
Y - Color code is changed to yellow after holding its ground in a tight range near its all-time high. New pivot point was cited based on its 4/04/24 high plus 10 cents. Subsequent gains above the pivot point backed by at least +40% above average volume are needed to trigger a proper new technical buy signal. Its 50 DMA line ($1,187) defines near-term support to watch.
>>> FEATURED STOCK ARTICLE : Volume Totals Cooling While Perched Near High - 4/9/2024 | View all notes | Set NEW NOTE alert | Company Profile | SEC News | Chart | Request a new note C A S I | PCAR - NASDAQ
Paccar
Trucks and Parts-Hvy Duty | $111.19 | -2.57
-2.26% | $114.34 | 4,538,444
206.76% of 50 DAV
50 DAV is 2,195,000 | $125.50
-11.40%
| 1/23/2024 | $100.35 | PP = $98.57 | | MB = $103.50 |  Most Recent Note - 4/19/2024 12:06:30 PM Most Recent Note - 4/19/2024 12:06:30 PM
G - Violated its 50 DMA line ($115) this week triggering a technical sell signal and it is on track today for a 6th consecutive loss. A prompt rebound above the 50 DMA line is needed for its outlook to improve. Fundamentals remain strong.
>>> FEATURED STOCK ARTICLE : Pulling Back From High and Slumping Toward 50-Day Moving Average - 4/12/2024 | View all notes | Set NEW NOTE alert | Company Profile | SEC News | Chart | Request a new note C A S I | HUBB - NYSE
Hubbell
Electrical-Power/Equipmt | $388.03 | -4.25
-1.08% | $396.45 | 354,620
88.21% of 50 DAV
50 DAV is 402,000 | $429.61
-9.68%
| 1/30/2024 | $343.26 | PP = $336.83 | | MB = $353.67 | Most Recent Note - 4/19/2024 6:40:48 PM
G - Closed below its 50 DMA line ($390) with a loss today on near-average volume raising concerns. Slumped for 8 losses in the span of 10 sessions after a noted "negative reversal" at its all-time high on 4/04/24. See the latest FSU analysis for more details and a new annotated graph.
>>> FEATURED STOCK ARTICLE : Closed Just Below 50-Day Moving Average With Quiet Loss - 4/19/2024 | View all notes | Set NEW NOTE alert | Company Profile | SEC News | Chart | Request a new note C A S I | Symbol/Exchange
Company Name
Industry Group | PRICE | CHANGE
(%Change) | Day High | Volume
(% DAV)
(% 50 day avg vol) | 52 Wk Hi
% From Hi | Featured
Date | Price
Featured | Pivot Featured | | Max Buy | USLM - NASDAQ
U.S. Lime & Minerals
Bldg-Cement/Concrt/Ag | $296.76 | +1.75
0.59% | $296.80 | 24,204
105.23% of 50 DAV
50 DAV is 23,000 | $308.00
-3.65%
| 2/9/2024 | $254.68 | PP = $265.09 | | MB = $278.34 | Most Recent Note - 4/17/2024 4:04:26 PM
G - Still hovering in a tight range in recent weeks near its all-time high, stubbornly holding its ground despite encountering some distributional pressure. Its 50 DMA line ($279) defines near-term support to watch.
>>> FEATURED STOCK ARTICLE : Gain With Light Volume for Best Ever Close - 4/5/2024 | View all notes | Set NEW NOTE alert | Company Profile | SEC News | Chart | Request a new note C A S I | NOW - NYSE
ServiceNow
Computer Sftwr-Enterprse | $713.91 | -17.45
-2.39% | $726.03 | 1,539,981
136.77% of 50 DAV
50 DAV is 1,126,000 | $815.32
-12.44%
| 2/22/2024 | $771.75 | PP = $815.32 | | MB = $856.09 | Most Recent Note - 4/19/2024 6:45:38 PM
Another damaging volume-driven loss since slumping below the prior low ($730) raised more serious concerns along with broader market weakness (M criteria). It will be dropped from the Featured Stocks list tonight. A rebound above the 50 DMA line ($766) is needed for its outlook to improve.
>>> FEATURED STOCK ARTICLE : Quietly Consolidating Near 50-Day Moving Average Line - 4/11/2024 | View all notes | Set NEW NOTE alert | Company Profile | SEC News | Chart | Request a new note C A S I | PAY - NYSE
Paymentus Holdings
Finance-CrdtCard/PmtPr | $19.31 | -0.27
-1.38% | $19.68 | 169,893
43.67% of 50 DAV
50 DAV is 389,000 | $25.21
-23.40%
| 3/5/2024 | $19.97 | PP = $18.89 | | MB = $19.83 | Most Recent Note - 4/18/2024 5:55:56 PM
G - Still testing its 50 DMA line ($19.46) which defines important near-term support above prior highs in the $18 range. More damaging losses would raise greater concerns.
>>> FEATURED STOCK ARTICLE : Consolidating After Powerful Breakout and Volume-Driven Gains - 3/27/2024 | View all notes | Set NEW NOTE alert | Company Profile | SEC News | Chart | Request a new note C A S I | HUBS - NYSE
HubSpot
Comp Sftwr-Spec Enterprs | $631.24 | -18.34
-2.82% | $662.52 | 810,700
152.39% of 50 DAV
50 DAV is 532,000 | $693.85
-9.02%
| 4/4/2024 | $686.66 | PP = $660.10 | | MB = $693.11 | Most Recent Note - 4/19/2024 6:42:23 PM
Y - Pulled back today testing its 50 DMA line ($625) with a loss on +52% above-average volume. Stalled after highlighted yellow in the 4/04/24 mid-day report with pivot point cited based on its 2/09/24 high plus 10 cents. Initial support is at its prior highs and its 50 DMA line ($626). Fundamentals remain strong. Faces some resistance due to old overhead supply up to the $866 level.
>>> FEATURED STOCK ARTICLE : Encountered Distributional Pressure and Finished Below Pivot Point - 4/4/2024 | View all notes | Set NEW NOTE alert | Company Profile | SEC News | Chart | Request a new note C A S I |
|
|
|
Color Codes Explained :
Y - Better candidates highlighted by our
staff of experts.
G - Previously featured
in past reports as yellow but may no longer be buyable under the
guidelines.
***Last / Change / Volume data in this table is the closing quote data***
Symbol/Exchange
Company Name
Industry Group |
PRICE |
CHANGE
(%Change) |
Day High |
Volume
(% DAV)
(% 50 day avg vol) |
52 Wk Hi
% From Hi |
Featured
Date |
Price
Featured |
Pivot Featured |
|
Max Buy |
 NVO
-
NYSE
NVO
-
NYSE
Novo Nordisk ADR
Medical-Ethical Drugs
|
$123.70
|
+0.95
0.77% |
$124.54
|
2,065,074
42.49% of 50 DAV
50 DAV is 4,860,000
|
$138.28
-10.54%
|
3/1/2024
|
$124.23
|
PP = $124.97
|
|
MB = $131.22
|
Most Recent Note - 4/17/2024 3:56:57 PM
G - Color code is changed to green while sputtering below its 50 DMA line ($125.96) while volume totals have still been cooling. Losses below prior lows raised concerns and triggered a technical sell signal. A rebound above the 50 DMA line is needed for its outlook to improve.
>>> FEATURED STOCK ARTICLE : Volume Cools While Consolidating Above 50-Day Moving Average Line - 4/3/2024 |
View all notes |
Set NEW NOTE alert |
Company Profile |
SEC
News |
Chart |
Request a new note
C
A
S
I |
AXON
-
NASDAQ
Axon Enterprise
Security/Sfty
|
$293.39
|
-4.20
-1.41% |
$299.53
|
104,198
19.89% of 50 DAV
50 DAV is 524,000
|
$329.87
-11.06%
|
4/5/2024
|
$309.90
|
PP = $325.73
|
|
MB = $342.02
|
Most Recent Note - 4/17/2024 3:43:19 PM
Y - Testing its 50 DMA line ($298.68) today after 3 consecutive losses. Color code was changed to yellow with new pivot point cited based on its 3/04/24 high plus 10 cents. A gain above the pivot point backed by at least +40% above average volume is needed to trigger a proper technical buy signal. Fundamentals remain strong.
>>> FEATURED STOCK ARTICLE : Volume Totals Cooling While Building a New Base - 4/8/2024 |
View all notes |
Set NEW NOTE alert |
Company Profile |
SEC
News |
Chart |
Request a new note
C
A
S
I |
TDG
-
NYSE
TransDigm Group
Aerospace/Defense
|
$1,210.66
|
-2.84
-0.23% |
$1,226.33
|
47,795
23.20% of 50 DAV
50 DAV is 206,000
|
$1,248.39
-3.02%
|
4/12/2024
|
$1,224.21
|
PP = $1,246.32
|
|
MB = $1,308.64
|
Most Recent Note - 4/17/2024 4:03:56 PM
Y - Color code is changed to yellow after holding its ground in a tight range near its all-time high. New pivot point was cited based on its 4/04/24 high plus 10 cents. Subsequent gains above the pivot point backed by at least +40% above average volume are needed to trigger a proper new technical buy signal. Its 50 DMA line ($1,187) defines near-term support to watch.
>>> FEATURED STOCK ARTICLE : Volume Totals Cooling While Perched Near High - 4/9/2024 |
View all notes |
Set NEW NOTE alert |
Company Profile |
SEC
News |
Chart |
Request a new note
C
A
S
I |
PCAR
-
NASDAQ
Paccar
Trucks and Parts-Hvy Duty
|
$112.18
|
-1.58
-1.39% |
$114.34
|
1,298,390
59.15% of 50 DAV
50 DAV is 2,195,000
|
$125.50
-10.61%
|
1/23/2024
|
$100.35
|
PP = $98.57
|
|
MB = $103.50
|
 Most Recent Note - 4/19/2024 12:06:30 PM
G - Violated its 50 DMA line ($115) this week triggering a technical sell signal and it is on track today for a 6th consecutive loss. A prompt rebound above the 50 DMA line is needed for its outlook to improve. Fundamentals remain strong.
>>> FEATURED STOCK ARTICLE : Pulling Back From High and Slumping Toward 50-Day Moving Average - 4/12/2024 |
View all notes |
Set NEW NOTE alert |
Company Profile |
SEC
News |
Chart |
Request a new note
C
A
S
I |
HUBB
-
NYSE
Hubbell
Electrical-Power/Equipmt
|
$390.50
|
-1.78
-0.45% |
$396.45
|
55,222
13.74% of 50 DAV
50 DAV is 402,000
|
$429.61
-9.10%
|
1/30/2024
|
$343.26
|
PP = $336.83
|
|
MB = $353.67
|
Most Recent Note - 4/17/2024 3:48:23 PM
G - Pulling back testing its 50 DMA line ($389.24) which defines important support to watch. Slumping after a noted "negative reversal" at its all-time high on 4/04/24.
>>> FEATURED STOCK ARTICLE : Hubbell Perched at All-Time High After 5 Weekly Gains - 3/22/2024 |
View all notes |
Set NEW NOTE alert |
Company Profile |
SEC
News |
Chart |
Request a new note
C
A
S
I |
Symbol/Exchange
Company Name
Industry Group |
PRICE |
CHANGE
(%Change) |
Day High |
Volume
(% DAV)
(% 50 day avg vol) |
52 Wk Hi
% From Hi |
Featured
Date |
Price
Featured |
Pivot Featured |
|
Max Buy |
USLM
-
NASDAQ
U.S. Lime & Minerals
Bldg-Cement/Concrt/Ag
|
$296.80
|
+1.79
0.61% |
$296.80
|
4,678
20.34% of 50 DAV
50 DAV is 23,000
|
$308.00
-3.64%
|
2/9/2024
|
$254.68
|
PP = $265.09
|
|
MB = $278.34
|
Most Recent Note - 4/17/2024 4:04:26 PM
G - Still hovering in a tight range in recent weeks near its all-time high, stubbornly holding its ground despite encountering some distributional pressure. Its 50 DMA line ($279) defines near-term support to watch.
>>> FEATURED STOCK ARTICLE : Gain With Light Volume for Best Ever Close - 4/5/2024 |
View all notes |
Set NEW NOTE alert |
Company Profile |
SEC
News |
Chart |
Request a new note
C
A
S
I |
NOW
-
NYSE
ServiceNow
Computer Sftwr-Enterprse
|
$714.62
|
-16.74
-2.29% |
$726.03
|
497,819
44.21% of 50 DAV
50 DAV is 1,126,000
|
$815.32
-12.35%
|
2/22/2024
|
$771.75
|
PP = $815.32
|
|
MB = $856.09
|
Most Recent Note - 4/17/2024 3:51:20 PM
G - Color code is changed to green while sputtering under its 50 DMA line ($768.48). A rebound above the 50 DMA line is needed for its outlook to improve. Prior lows in the $730 area define the next important near-term support to watch.
>>> FEATURED STOCK ARTICLE : Quietly Consolidating Near 50-Day Moving Average Line - 4/11/2024 |
View all notes |
Set NEW NOTE alert |
Company Profile |
SEC
News |
Chart |
Request a new note
C
A
S
I |
PAY
-
NYSE
Paymentus Holdings
Finance-CrdtCard/PmtPr
|
$19.49
|
-0.09
-0.46% |
$19.62
|
32,637
8.39% of 50 DAV
50 DAV is 389,000
|
$25.21
-22.69%
|
3/5/2024
|
$19.97
|
PP = $18.89
|
|
MB = $19.83
|
Most Recent Note - 4/18/2024 5:55:56 PM
G - Still testing its 50 DMA line ($19.46) which defines important near-term support above prior highs in the $18 range. More damaging losses would raise greater concerns.
>>> FEATURED STOCK ARTICLE : Consolidating After Powerful Breakout and Volume-Driven Gains - 3/27/2024 |
View all notes |
Set NEW NOTE alert |
Company Profile |
SEC
News |
Chart |
Request a new note
C
A
S
I |
HUBS
-
NYSE
HubSpot
Comp Sftwr-Spec Enterprs
|
$639.63
|
-9.95
-1.53% |
$662.52
|
310,174
58.30% of 50 DAV
50 DAV is 532,000
|
$693.85
-7.81%
|
4/4/2024
|
$686.66
|
PP = $660.10
|
|
MB = $693.11
|
Most Recent Note - 4/19/2024 11:52:14 AM
Y - Pulling back today following a solid gain on the prior session. Stalled after highlighted yellow in the 4/04/24 mid-day report with pivot point cited based on its 2/09/24 high plus 10 cents. Initial support is at its prior highs and its 50 DMA line ($626). Fundamentals remain strong. Faces some resistance due to old overhead supply up to the $866 level.
>>> FEATURED STOCK ARTICLE : Encountered Distributional Pressure and Finished Below Pivot Point - 4/4/2024 |
View all notes |
Set NEW NOTE alert |
Company Profile |
SEC
News |
Chart |
Request a new note
C
A
S
I |
|
|
|
THESE ARE NOT BUY RECOMMENDATIONS!
Comments contained in the body of this report are technical
opinions only. The material herein has been obtained
from sources believed to be reliable and accurate, however,
its accuracy and completeness cannot be guaranteed.
This site is not an investment advisor, hence it does
not endorse or recommend any securities or other investments.
Any recommendation contained in this report may not
be suitable for all investors and it is not to be deemed
an offer or solicitation on our part with respect to
the purchase or sale of any securities. All trademarks,
service marks and trade names appearing in this report
are the property of their respective owners, and are
likewise used for identification purposes only.
This report is a service available
only to active Paid Premium Members.
You may opt-out of receiving report notifications
at any time. Questions or comments may be submitted
by writing to Premium Membership Services 665 S.E. 10 Street, Suite 201 Deerfield Beach, FL 33441-5634 or by calling 1-800-965-8307
or 954-785-1121.
|
|
|