***Last / Change / Volume data in this table is the closing quote data***
Symbol/Exchange
Company Name
Industry Group |
PRICE |
CHANGE
(%Change) |
Day High |
Volume
(% DAV)
(% 50 day avg vol) |
52 Wk Hi
% From Hi |
Featured
Date |
Price
Featured |
Pivot Featured |
|
Max Buy |
MLR
-
NYSE
Miller Industries Inc
AUTOMOTIVE - Auto Parts
|
$33.37
|
-0.09
-0.27% |
$34.00
|
35,732
91.62% of 50 DAV
50 DAV is 39,000
|
$35.26
-5.36%
|
11/30/2018
|
$28.35
|
PP = $29.50
|
|
MB = $30.98
|
Most Recent Note - 4/16/2019 5:56:33 PM
G - Posted a big gain today with light volume, rallying further above its 50 DMA line ($32.22) toward the prior high. Below the 50 DMA line the prior low ($30.38 on 3/27/19) defines the next near-term support to watch. Reported earnings +17% on +13% sales revenues for the Dec '18 quarter, below the +25% minimum guideline (C criteria), raising fundamental concerns.
>>> FEATURED STOCK ARTICLE : Below 50-Day Average After Damaging Losses - 4/8/2019 |
View all notes |
Set NEW NOTE alert |
Company Profile |
SEC
News |
Chart |
Request a new note
C
A
S
I |
NSP
-
NYSE
Insperity Inc
Comml Svcs-Outsourcing
|
$124.87
|
-3.74
-2.91% |
$129.43
|
240,829
65.80% of 50 DAV
50 DAV is 366,000
|
$132.50
-5.76%
|
4/16/2019
|
$129.59
|
PP = $132.60
|
|
MB = $139.23
|
 Most Recent Note - 4/17/2019 5:36:11 PM
Y - Tested its 50 DMA line ($124.85) with today's 4th consecutive loss on lighter than average volume. A new pivot point was cited based on its 2/12/19 high plus 10 cents. Subsequent gains above the pivot point backed by at least +40% above average volume may trigger a new (or add-on) technical buy signal. Prior highs in the $118-121 area recently acted as support.
>>> FEATURED STOCK ARTICLE : Volume Totals Cooling and Consolidating Near Prior Highs - 3/14/2019 |
View all notes |
Set NEW NOTE alert |
Company Profile |
SEC
News |
Chart |
Request a new note
C
A
S
I |
ZBRA
-
NASDAQ
Zebra Tech Corp Cl A
COMPUTER HARDWARE - Computer Peripherals
|
$232.22
|
-1.99
-0.85% |
$235.98
|
320,493
69.52% of 50 DAV
50 DAV is 461,000
|
$234.53
-0.98%
|
2/14/2019
|
$198.10
|
PP = $184.85
|
|
MB = $194.09
|
Most Recent Note - 4/12/2019 12:44:24 PM
G - Hitting another new all-time high today, getting very extended from any sound base. Its 50 DMA line ($203.86) defines near-term support to watch on pullbacks.
>>> FEATURED STOCK ARTICLE : Zebra Extended From Prior Base - 3/25/2019 |
View all notes |
Set NEW NOTE alert |
Company Profile |
SEC
News |
Chart |
Request a new note
C
A
S
I |
FTNT
-
NASDAQ
Fortinet Inc
Computer Sftwr-Security
|
$92.37
|
-1.68
-1.79% |
$94.96
|
1,764,644
98.80% of 50 DAV
50 DAV is 1,786,000
|
$95.59
-3.37%
|
4/10/2019
|
$89.76
|
PP = $88.70
|
|
MB = $93.14
|
Most Recent Note - 4/15/2019 12:32:42 PM
G - Color code is changed to green after rising above its "max buy" level and hitting a new all-time high with today's 7th consecutive gain. Prior highs in the $88 area define near-term support to watch on pullbacks.
>>> FEATURED STOCK ARTICLE : Volume-Driven Gain Cleared Flat Base and Little Resistance Remains - 4/10/2019 |
View all notes |
Set NEW NOTE alert |
Company Profile |
SEC
News |
Chart |
Request a new note
C
A
S
I |
SPSC
-
NASDAQ
S P S Commerce Inc
COMPUTER SOFTWARE and SERVICES - Application Software
|
$101.25
|
-2.60
-2.50% |
$104.27
|
139,031
86.89% of 50 DAV
50 DAV is 160,000
|
$113.31
-10.64%
|
3/26/2019
|
$107.12
|
PP = $113.41
|
|
MB = $119.08
|
Most Recent Note - 4/17/2019 5:43:00 PM
G - Color code is changed to green after slumping below its 50 DMA line ($104.88) which recently acted as support. Damaging losses below the recent low ($100.28 on 4/08/19) would raise more serious concerns. A rebound above the 50 DMA line is needed for its outlook to improve. Subsequent gains above the pivot point backed by at least +40% above average volume may trigger a new (or add-on) technical buy signal.
>>> FEATURED STOCK ARTICLE : Consolidating in Orderly Fashion Above Prior Highs - 3/22/2019 |
View all notes |
Set NEW NOTE alert |
Company Profile |
SEC
News |
Chart |
Request a new note
C
A
S
I |
Symbol/Exchange
Company Name
Industry Group |
PRICE |
CHANGE
(%Change) |
Day High |
Volume
(% DAV)
(% 50 day avg vol) |
52 Wk Hi
% From Hi |
Featured
Date |
Price
Featured |
Pivot Featured |
|
Max Buy |
SSNC
-
NASDAQ
S S & C Technologies
COMPUTER SOFTWARE and SERVICES - Application Software
|
$63.97
|
-1.10
-1.69% |
$65.48
|
1,412,213
82.34% of 50 DAV
50 DAV is 1,715,000
|
$66.30
-3.51%
|
2/15/2019
|
$59.73
|
PP = $61.07
|
|
MB = $64.12
|
Most Recent Note - 4/16/2019 1:34:34 PM
G - Stubbornly holding its ground perched near its all-time high with volume totals cooling. Its 50 DMA line ($61.15) and prior low define near term support to watch on pullbacks.
>>> FEATURED STOCK ARTICLE : Hovering Near High With Volume Totals Cooling in Recent Weeks - 3/27/2019 |
View all notes |
Set NEW NOTE alert |
Company Profile |
SEC
News |
Chart |
Request a new note
C
A
S
I |
IRBT
-
NASDAQ
Irobot Corp
CONSUMER DURABLES - Electronic Equipment
|
$129.16
|
-0.52
-0.40% |
$130.90
|
437,233
52.18% of 50 DAV
50 DAV is 838,000
|
$132.88
-2.80%
|
4/16/2019
|
$130.56
|
PP = $132.98
|
|
MB = $139.63
|
Most Recent Note - 4/16/2019 1:16:48 PM
Y - Color code is changed to yellow with new pivot point cited based on its 3/05/19 high plus 10 cents. Subsequent gains above the pivot point backed by at least +40% above average volume may trigger a new (or add-on) technical buy signal. Perched within striking distance of its all-time high with volume totals cooling. Its 50 DMA line ($120) and recent low ($114.40 on 3/27/19) define important near-term support to watch on pullbacks
>>> FEATURED STOCK ARTICLE : Consolidating After Getting Extended from Double Bottom Base - 3/12/2019 |
View all notes |
Set NEW NOTE alert |
Company Profile |
SEC
News |
Chart |
Request a new note
C
A
S
I |
AUDC
-
NASDAQ
Audiocodes Ltd
ELECTRONICS - Scientific and Technical Instrum
|
$15.54
|
-0.19
-1.21% |
$15.75
|
166,755
85.96% of 50 DAV
50 DAV is 194,000
|
$16.36
-4.98%
|
3/20/2019
|
$13.66
|
PP = $15.06
|
|
MB = $15.81
|
Most Recent Note - 4/11/2019 5:13:56 PM
Y - Pulled back with light volume and its color code is changed to yellow after retreating below its "max buy" level. Prior high ($14.96) defines initial support to watch above its 50 DMA line ($13.86).
>>> FEATURED STOCK ARTICLE : Building a Base and Found Support Near 50-Day Moving Average - 3/20/2019 |
View all notes |
Set NEW NOTE alert |
Company Profile |
SEC
News |
Chart |
Request a new note
C
A
S
I |
ENV
-
NYSE
Envestnet Inc
FINANCIAL SERVICES - Diversified Investments
|
$69.18
|
-0.37
-0.53% |
$69.87
|
198,764
66.70% of 50 DAV
50 DAV is 298,000
|
$69.32
-0.20%
|
3/15/2019
|
$66.05
|
PP = $64.90
|
|
MB = $68.15
|
Most Recent Note - 4/11/2019 1:46:48 PM
G - Color code is changed to green after rallying above its "max buy" level today and hitting a new all-time high. The recent low ($63.34 on 3/27/19) and 50 DMA line define near-term support to watch on pullbacks.
>>> FEATURED STOCK ARTICLE : Volume Heavy Behind Rally to New Highs - 3/15/2019 |
View all notes |
Set NEW NOTE alert |
Company Profile |
SEC
News |
Chart |
Request a new note
C
A
S
I |
LHCG
-
NASDAQ
L H C Group Inc
HEALTH SERVICES - Home Health Care
|
$99.63
|
-0.12
-0.12% |
$103.17
|
727,519
294.54% of 50 DAV
50 DAV is 247,000
|
$115.54
-13.77%
|
1/23/2019
|
$107.29
|
PP = $107.61
|
|
MB = $112.99
|
Most Recent Note - 4/17/2019 12:48:47 PM
G - Finding prompt support at its 200 DMA line ($99.13) today after a damaging volume-driven loss on the prior session violated the prior low ($106.04 on 3/28/19). Disciplined investors always limit losses by selling any stock that falls more than -7% from their purchase price. A rebound above the 50 DMA line is needed for its outlook to improve.
>>> FEATURED STOCK ARTICLE : Sputtering Near 50-Day Moving Average Line - 4/1/2019 |
View all notes |
Set NEW NOTE alert |
Company Profile |
SEC
News |
Chart |
Request a new note
C
A
S
I |
Symbol/Exchange
Company Name
Industry Group |
PRICE |
CHANGE
(%Change) |
Day High |
Volume
(% DAV)
(% 50 day avg vol) |
52 Wk Hi
% From Hi |
Featured
Date |
Price
Featured |
Pivot Featured |
|
Max Buy |
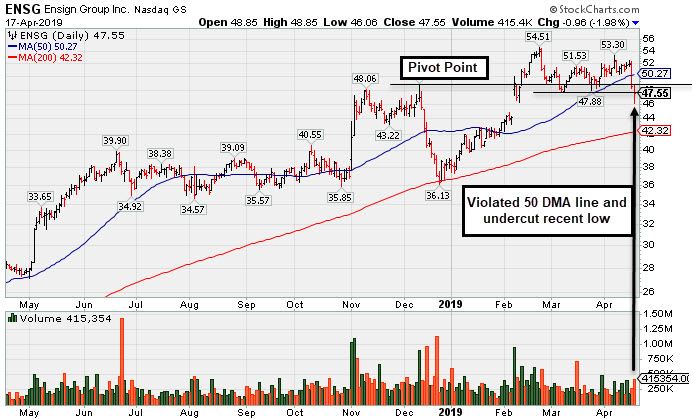
ENSG
-
NASDAQ
Ensign Group Inc
HEALTH SERVICES - Long-Term Care Facilities
|
$47.55
|
-0.96
-1.98% |
$48.85
|
415,354
129.39% of 50 DAV
50 DAV is 321,000
|
$54.56
-12.85%
|
2/7/2019
|
$48.71
|
PP = $49.06
|
|
MB = $51.51
|
Most Recent Note - 4/17/2019 5:31:07 PM
G - Undercut prior lows with a loss on higher volume today raising more concerns after it violated its 50 DMA line ($50.30) on the prior session. Only a prompt rebound above the 50 DMA line would help its outlook improve. See the latest FSU analysis for more details and a new annotated graph.
>>> FEATURED STOCK ARTICLE : Two Damaging Losses Hurt Outlook - 4/17/2019 |
View all notes |
Set NEW NOTE alert |
Company Profile |
SEC
News |
Chart |
Request a new note
C
A
S
I |
LULU
-
NASDAQ
Lululemon Athletica
MANUFACTURING - Textile Manufacturing
|
$171.23
|
+1.90
1.12% |
$171.99
|
1,628,619
70.81% of 50 DAV
50 DAV is 2,300,000
|
$173.07
-1.06%
|
3/28/2019
|
$169.20
|
PP = $164.89
|
|
MB = $173.13
|
Most Recent Note - 4/15/2019 5:59:46 PM
Y - Posted a gain today with average volume for a new all-time high, yet it remains below the "max buy" level. Stubbornly holding its ground since a "breakaway gap" on 3/28/19 triggered a technical buy signal. Bullish action came after it reported Jan '19 earnings +39% on +26% sales revenues, marking its 5th consecutive quarterly comparison above the +25% minimum guideline (C criteria).
>>> FEATURED STOCK ARTICLE : Breakway Gap Backed by More Than 6 Times Average Volume - 3/28/2019 |
View all notes |
Set NEW NOTE alert |
Company Profile |
SEC
News |
Chart |
Request a new note
C
A
S
I |
NXST
-
NASDAQ
Nexstar Media Group Cl A
MEDIA - Broadcasting - TV
|
$117.84
|
-0.12
-0.10% |
$119.93
|
313,380
55.86% of 50 DAV
50 DAV is 561,000
|
$118.38
-0.46%
|
2/26/2019
|
$94.26
|
PP = $89.76
|
|
MB = $94.25
|
Most Recent Note - 4/11/2019 1:37:08 PM
G - Perched at its all-time high, very extended from any sound base. Disciplined investors avoid chasing stocks more than +5% above the prior high. Its 50 DMA line ($100) defines near-term support to watch on pullbacks.
>>> FEATURED STOCK ARTICLE : Hitting New High and Very Extended From Prior Base - 4/4/2019 |
View all notes |
Set NEW NOTE alert |
Company Profile |
SEC
News |
Chart |
Request a new note
C
A
S
I |
ULTA
-
NASDAQ
Ulta Beauty Inc
SPECIALTY RETAIL - Specialty Retail, Other
|
$354.33
|
-0.75
-0.21% |
$359.69
|
495,529
63.21% of 50 DAV
50 DAV is 784,000
|
$356.80
-0.69%
|
3/15/2019
|
$341.27
|
PP = $322.59
|
|
MB = $338.72
|
Most Recent Note - 4/11/2019 1:44:07 PM
G - Volume totals have been cooling while stubbornly holding its ground near its all-time high after rallying above its "max buy" level. Bullish action came after it reported earnings +31% sales revenues on +10% sales revenues for the Jan '19 quarter.
>>> FEATURED STOCK ARTICLE : Consolidating Following Big "Breakaway Gap" - 3/19/2019 |
View all notes |
Set NEW NOTE alert |
Company Profile |
SEC
News |
Chart |
Request a new note
C
A
S
I |
UBNT
-
NASDAQ
Ubiquiti Networks
TELECOMMUNICATIONS - Diversified Communication Serv
|
$166.33
|
-4.74
-2.77% |
$172.80
|
535,386
136.23% of 50 DAV
50 DAV is 393,000
|
$171.49
-3.01%
|
2/8/2019
|
$121.97
|
PP = $115.54
|
|
MB = $121.32
|
Most Recent Note - 4/17/2019 5:39:55 PM
G - Reversed into the red for a loss today on higher volume after hitting another new all-time high, breaking a streak of 5 consecutive gains backed by average of lighter volume. Extended from any sound base after a big rally. Its prior high ($148.68 on 2/27/19) and its 50 DMA line ($145.87) define near-term support to watch. Fundamentals remain strong.
>>> FEATURED STOCK ARTICLE : Extended From Any Sound Bass and Wedging to New Highs - 4/12/2019 |
View all notes |
Set NEW NOTE alert |
Company Profile |
SEC
News |
Chart |
Request a new note
C
A
S
I |
Symbol/Exchange
Company Name
Industry Group |
PRICE |
CHANGE
(%Change) |
Day High |
Volume
(% DAV)
(% 50 day avg vol) |
52 Wk Hi
% From Hi |
Featured
Date |
Price
Featured |
Pivot Featured |
|
Max Buy |
ESNT
-
NYSE
Essent Group Ltd
Finance-MrtgandRel Svc
|
$45.25
|
-0.46
-1.01% |
$45.94
|
582,908
93.12% of 50 DAV
50 DAV is 626,000
|
$47.94
-5.61%
|
3/18/2019
|
$45.84
|
PP = $45.06
|
|
MB = $47.31
|
Most Recent Note - 4/16/2019 1:17:58 PM
Y - Found support above its 50 DMA line ($43.97) reassuringly on the recent pullback. Still faces some resistance due to overhead supply up to the $50 level. Fundamentals are strong.
>>> FEATURED STOCK ARTICLE : Big Breakout Gain With +350% Above Average Volume - 3/18/2019 |
View all notes |
Set NEW NOTE alert |
Company Profile |
SEC
News |
Chart |
Request a new note
C
A
S
I |
FIVE
-
NASDAQ
Five Below Inc
Retail-DiscountandVariety
|
$139.74
|
+1.96
1.42% |
$139.97
|
967,233
91.94% of 50 DAV
50 DAV is 1,052,000
|
$136.36
2.48%
|
4/11/2019
|
$132.05
|
PP = $133.75
|
|
MB = $140.44
|
Most Recent Note - 4/17/2019 5:47:13 PM
Y - Hit yet another new all-time high approaching its "max buy" level with today's 6th consecutive gain, however, the recent gains have lacked great volume conviction. Gains above the pivot point must have at least +40% above average volume to clinch a proper technical buy signal.
>>> FEATURED STOCK ARTICLE : Finished Strong After Featured Again in Mid-Day Report - 4/11/2019 |
View all notes |
Set NEW NOTE alert |
Company Profile |
SEC
News |
Chart |
Request a new note
C
A
S
I |
NOW
-
NYSE
Servicenow Inc
Computer Sftwr-Enterprse
|
$236.23
|
-3.58
-1.49% |
$242.00
|
2,479,456
145.94% of 50 DAV
50 DAV is 1,699,000
|
$251.65
-6.13%
|
1/31/2019
|
$218.14
|
PP = $206.40
|
|
MB = $216.72
|
Most Recent Note - 4/15/2019 6:01:47 PM
G - Extended from any sound base, finding support at its 50 DMA line ($238) recently. Below that important short-term average the recent low ($226.71 on 3/08/19) defines near-term support to watch. More damaging losses would raise concerns and trigger technical sell signals. See the latest FSU analysis for more details and a new annotated graph.
>>> FEATURED STOCK ARTICLE : Found Recent Support at 50-Day Moving Average - 4/15/2019 |
View all notes |
Set NEW NOTE alert |
Company Profile |
SEC
News |
Chart |
Request a new note
C
A
S
I |
PANW
-
NYSE
Palo Alto Networks
Computer Sftwr-Security
|
$239.43
|
-5.05
-2.07% |
$246.60
|
1,662,516
122.06% of 50 DAV
50 DAV is 1,362,000
|
$260.63
-8.13%
|
2/25/2019
|
$233.54
|
PP = $239.60
|
|
MB = $251.58
|
Most Recent Note - 4/17/2019 5:45:13 PM
Y - Volume was higher behind today's big loss nearly testing its 50 DMA line ($237.51) which defines important support to watch above the prior low ($233.15 on 4/04/19). Fundamentals remain strong.
>>> FEATURED STOCK ARTICLE : Consolidating Above Prior High and 50-Day Average - 4/3/2019 |
View all notes |
Set NEW NOTE alert |
Company Profile |
SEC
News |
Chart |
Request a new note
C
A
S
I |
ANET
-
NYSE
Arista Networks Inc
TELECOMMUNICATIONS - Communication Equipment
|
$328.04
|
-0.50
-0.15% |
$331.27
|
529,251
60.28% of 50 DAV
50 DAV is 878,000
|
$329.25
-0.37%
|
3/13/2019
|
$295.38
|
PP = $313.37
|
|
MB = $329.04
|
Most Recent Note - 4/15/2019 5:55:26 PM
Y - Hit a new high today with a small gain on lighter than average volume. It rebounded above its pivot point but remains below the "max buy" level previously noted.
>>> FEATURED STOCK ARTICLE : Rebounding Near High After Deep Consolidation - 3/13/2019 |
View all notes |
Set NEW NOTE alert |
Company Profile |
SEC
News |
Chart |
Request a new note
C
A
S
I |
Symbol/Exchange
Company Name
Industry Group |
PRICE |
CHANGE
(%Change) |
Day High |
Volume
(% DAV)
(% 50 day avg vol) |
52 Wk Hi
% From Hi |
Featured
Date |
Price
Featured |
Pivot Featured |
|
Max Buy |
PAYC
-
NYSE
Paycom Software Inc
COMPUTER SOFTWARE and SERVICES - Application Software
|
$186.94
|
-1.95
-1.03% |
$191.60
|
497,265
76.38% of 50 DAV
50 DAV is 651,000
|
$193.75
-3.51%
|
2/6/2019
|
$171.66
|
PP = $164.18
|
|
MB = $172.39
|
Most Recent Note - 4/16/2019 5:37:51 PM
G - It has not formed a sound new base of sufficient length but volume totals have been cooling while stubbornly holding its ground. Its 50 DMA line ($181.41) defines important near-term support to watch above prior lows. See the latest FSU analysis for more details and a new annotated graph.
>>> FEATURED STOCK ARTICLE : Paycom Software Quietly Hovering Near All-Time High - 4/16/2019 |
View all notes |
Set NEW NOTE alert |
Company Profile |
SEC
News |
Chart |
Request a new note
C
A
S
I |
PYPL
-
NASDAQ
Paypal Holdings Inc
Finance-CrdtCard/PmtPr
|
$108.81
|
+0.61
0.56% |
$108.86
|
5,321,400
82.54% of 50 DAV
50 DAV is 6,447,000
|
$109.00
-0.17%
|
1/24/2019
|
$92.56
|
PP = $93.80
|
|
MB = $98.49
|
Most Recent Note - 4/16/2019 1:28:32 PM
G - Perched at its all-time high, very extended from any sound base after gains lacking great volume conviction in recent weeks. Its 50 DMA line ($99.70) and prior highs in the $94 area define important near-term support to watch on pullbacks.
>>> FEATURED STOCK ARTICLE : Extended From Base After Gains in Recent Weeks Lacking Volume - 4/2/2019 |
View all notes |
Set NEW NOTE alert |
Company Profile |
SEC
News |
Chart |
Request a new note
C
A
S
I |
ALRM
-
NASDAQ
Alarm.com Holdings Inc
Security/Sfty
|
$67.59
|
-0.14
-0.21% |
$68.09
|
527,196
112.17% of 50 DAV
50 DAV is 470,000
|
$69.61
-2.90%
|
1/22/2019
|
$60.52
|
PP = $60.30
|
|
MB = $63.32
|
Most Recent Note - 4/11/2019 1:35:13 PM
G - Hitting new 52-week and all-time highs with today's 5th consecutive gain. Recently found prompt support near the 50 DMA line after it reported earnings +12% on +25% sales revenues for the Dec '18 quarter, below the +25% minimum earnings guideline (C criteria), raising fundamental concerns.
>>> FEATURED STOCK ARTICLE : Consolidating Near 50-Day Average Following Sub Par Report - 3/29/2019 |
View all notes |
Set NEW NOTE alert |
Company Profile |
SEC
News |
Chart |
Request a new note
C
A
S
I |
PLNT
-
NYSE
Planet Fitness Inc Cl A
Leisure-Services
|
$72.89
|
-0.66
-0.90% |
$73.91
|
1,067,802
75.52% of 50 DAV
50 DAV is 1,414,000
|
$74.60
-2.29%
|
11/7/2018
|
$57.10
|
PP = $55.45
|
|
MB = $58.22
|
Most Recent Note - 4/11/2019 1:40:09 PM
G - Holding its ground near its all-time high, very extended from any sound base. Its 50 DMA line (63.74) defines near-term support above prior highs in the $59-60 area. Fundamentals remain strong.
>>> FEATURED STOCK ARTICLE : Perched Near High Very Extended From Prior Base - 4/5/2019 |
View all notes |
Set NEW NOTE alert |
Company Profile |
SEC
News |
Chart |
Request a new note
C
A
S
I |
TEAM
-
NASDAQ
Atlassian Corp Plc Cl A
Comp Sftwr-Spec Enterprs
|
$111.19
|
-1.78
-1.58% |
$114.13
|
2,753,158
190.66% of 50 DAV
50 DAV is 1,444,000
|
$117.06
-5.01%
|
4/16/2019
|
$114.77
|
PP = $116.80
|
|
MB = $122.64
|
Most Recent Note - 4/16/2019 1:02:09 PM
Y - Color code is changed to yellow after forming an advanced "3-weeks tight" base. Pivot point cited is based on its 4/03 high plus 10 cents. Subsequent gains above the pivot point backed by at least +40% above average volume may trigger a new (or add-on) technical buy signal. Due to report financial results for the quarter ended March 31, 2019 after market close on Wednesday, April 17, 2019. Volume and volatility often increase near earnings news. Its 50 DMA line ($108.67) and recent lows define near-term support to watch. Fundamentals remain strong.
>>> FEATURED STOCK ARTICLE : Perched Near High Enduring Distributional Pressure - 4/9/2019 |
View all notes |
Set NEW NOTE alert |
Company Profile |
SEC
News |
Chart |
Request a new note
C
A
S
I |
Symbol/Exchange
Company Name
Industry Group |
PRICE |
CHANGE
(%Change) |
Day High |
Volume
(% DAV)
(% 50 day avg vol) |
52 Wk Hi
% From Hi |
Featured
Date |
Price
Featured |
Pivot Featured |
|
Max Buy |
GLOB
-
NYSE
Globant SA
Computer-Tech Services
|
$78.37
|
-2.60
-3.21% |
$81.83
|
232,625
115.16% of 50 DAV
50 DAV is 202,000
|
$82.33
-4.81%
|
2/15/2019
|
$69.35
|
PP = $70.00
|
|
MB = $73.50
|
Most Recent Note - 4/17/2019 5:33:42 PM
G - Retreated from its all-time high with today's big loss with near average volume. Near-term support is at its prior high ($74) and its 50 DMA line ($71.69) . Violations would raise concerns and trigger technical sell signals.
>>> FEATURED STOCK ARTICLE : Consolidating Near 50-Day Average Quietly Perched Near High - 3/26/2019 |
View all notes |
Set NEW NOTE alert |
Company Profile |
SEC
News |
Chart |
Request a new note
C
A
S
I |
TTD
-
NASDAQ
The Trade Desk Inc Cl A
Comml Svcs-Advertising
|
$198.79
|
-4.47
-2.20% |
$205.57
|
770,305
46.94% of 50 DAV
50 DAV is 1,641,000
|
$214.70
-7.41%
|
2/6/2019
|
$148.65
|
PP = $149.00
|
|
MB = $156.45
|
Most Recent Note - 4/16/2019 1:43:26 PM
G - Volume totals have been cooling while consolidating in an orderly fashion above its 50 DMA line ($187.53) which defines initial support to watch above the prior low ($178.30 on 3/27/19).
>>> FEATURED STOCK ARTICLE : Hit Another New All-Time High Getting Extended From Prior Base - 3/21/2019 |
View all notes |
Set NEW NOTE alert |
Company Profile |
SEC
News |
Chart |
Request a new note
C
A
S
I |