You are not logged in.
This means you
CAN ONLY VIEW reports that were published prior to Friday, April 18, 2025.
You
MUST UPGRADE YOUR MEMBERSHIP if you want to see any current reports.
AFTER MARKET UPDATE - TUESDAY, OCTOBER 16TH, 2018
Previous After Market Report Next After Market Report >>>
|
|
|
|
DOW |
+547.87 |
25,798.42 |
+2.17% |
|
Volume |
789,082,290 |
-4% |
|
Volume |
2,599,925,400 |
+22% |
|
NASDAQ |
+214.75 |
7,645.49 |
+2.89% |
|
Advancers |
2,566 |
85% |
|
Advancers |
2,462 |
80% |
|
S&P 500 |
+59.13 |
2,809.92 |
+2.15% |
|
Decliners |
464 |
15% |
|
Decliners |
612 |
20% |
|
Russell 2000 |
+43.74 |
1,596.84 |
+2.82% |
|
52 Wk Highs |
14 |
|
|
52 Wk Highs |
21 |
|
|
S&P 600 |
+26.26 |
996.79 |
+2.71% |
|
52 Wk Lows |
95 |
|
|
52 Wk Lows |
91 |
|
|
 |
Major Indices Rose With Lighter Volume Totals
Kenneth J. Gruneisen - Passed the CAN SLIM® Master's Exam
Stocks finished firmly higher Tuesday. The Dow climbed 547 points to 25798, while the S&P 500 gained 59 points to 2809. The Nasdaq Composite rallied 214 points to 7645. Volume totals reported were lighter on the NYSE and on the Nasdaq exchange versus the prior session. Breadth was positive as advancers led decliners by almost a 3-2 margin on the NYSE and 8-7 on the Nasdaq exchange. There were 5 high-ranked companies from the Leaders List that made new 52-week highs and were listed on the BreakOuts Page , versus 2 on the prior session, as market leadership remained elusive. New 52-week lows totals again outnumbered new 52-week highs on both the NYSE and Nasdaq. Recent reports have noted that the major indices (M criteria) have shown action indicative of a market correction while leadership disappeared. During market corrections investors should have a bias toward selling stocks on a case-by-case basis as technical sell signals occur, raising cash levels while reducing market exposure. The Featured Stocks Page provides the most timely analysis on high-ranked leaders. Charts used courtesy of www.stockcharts.com
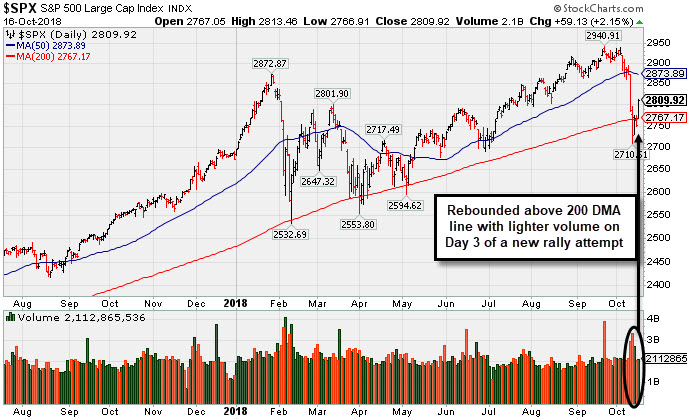
PICTURED: The S&P 500 Index rebounded above its 200-day moving average (DMA) line with a gain on lighter volume. The big gain came on Day 3 of a new rally attempt. Technically, however, the market still is in a noted "correction" under the fact-based investment system. Investors should watch for a subsequent gain or "follow-through day" to be noted, ideally between Day 4 and Day 7, with solid gains on higher volume and leadership expansion all necessary elements to confirm a new rally. New buying efforts are against the rules and discouraged until a convincing follow-through day occurs.
The major averages advanced, notching their best day since March amid a deluge of earnings reports. Small-cap stocks also saw a boost with the Russell 2000 advancing the most in nearly two years. On the data front, a report showed industrial production rose 0.3% in September, posting a fourth consecutive monthly increase. Separately, the Job Openings and Labor Turnover Survey (JOLTS) revealed job openings hit a record 7.1 million in August.
All 11 S&P 500 sectors advanced, with Tech shares surging more than 3.0%. In earnings, Goldman Sachs (GS +3.01%) and Morgan Stanley (MS +5.68%) rose after both firms topped earnings expectations. BlackRock (BLK -4.44%) fell after missing consensus revenue estimates. Elsewhere, Johnson and Johnson (JNJ +1.95%) after reporting growth in both its pharmaceutical and consumer business units. Industrial supplier WW Grainger (GWW -11.95%) gapped down below its 200 DMA line after missing operating margin and sales projections. Adobe (ADBE +9.52%) rallied after announcing expectations of 20% revenue growth in 2019.
Treasuries were modestly weaker with the yield on the 10-year note up one basis point to 3.16%. In commodities, WTI crude rose 0.1% to $71.86/barrel. COMEX gold added 0.1% to $1,227.30/ounce amid a weaker dollar. |
 Kenneth J. Gruneisen started out as a licensed stockbroker in August 1987, a couple of months prior to the historic stock market crash that took the Dow Jones Industrial Average down -22.6% in a single day. He has published daily fact-based fundamental and technical analysis on high-ranked stocks online for two decades. Through FACTBASEDINVESTING.COM, Kenneth provides educational articles, news, market commentary, and other information regarding proven investment systems that work in good times and bad.
Comments contained in the body of this report are technical opinions only and are not necessarily those of Gruneisen Growth Corp. The material herein has been obtained from sources believed to be reliable and accurate, however, its accuracy and completeness cannot be guaranteed. Our firm, employees, and customers may effect transactions, including transactions contrary to any recommendation herein, or have positions in the securities mentioned herein or options with respect thereto. Any recommendation contained in this report may not be suitable for all investors and it is not to be deemed an offer or solicitation on our part with respect to the purchase or sale of any securities. |
|
 |
Tech, Retail, Energy, and Financial Groups Rose
Kenneth J. Gruneisen - Passed the CAN SLIM® Master's Exam
The Retail Index ($RLX +2.39%) and the Broker/Dealer Index ($XBD +2.18%) both outpaced the Bank Index ($BKX +0.91%) on Tuesday. The tech sector had a positive bias as the Biotech Index ($BTK +4.42%) and the Semiconductor Index ($SOX +3.31%) both outpaced the Networking Index ($NWX +2.49%). The Integrated Oil Index ($XOI +1.11%) and the Oil Services Index ($OSX +0.72%) both rose while the Gold & Silver Index ($XAU -0.50%) edged lower.
Charts courtesy of www.stockcharts.com
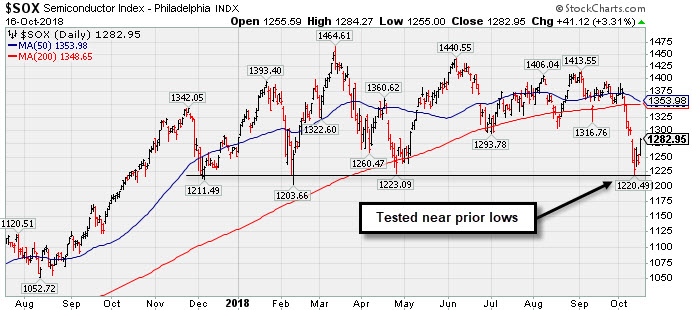 PICTURED: The Semiconductor Index ($SOX +3.31%) recently has slumped well below its 200-day moving average line (red line) and bounced near prior lows. More damaging losses would raise greater concerns, especially concerning any semiconductor related issues.
| Oil Services |
$OSX |
145.73 |
+1.04 |
+0.72% |
-2.55% |
| Integrated Oil |
$XOI |
1,495.75 |
+16.41 |
+1.11% |
+12.00% |
| Semiconductor |
$SOX |
1,282.95 |
+41.13 |
+3.31% |
+2.39% |
| Networking |
$NWX |
528.89 |
+12.83 |
+2.49% |
+7.82% |
| Broker/Dealer |
$XBD |
265.37 |
+5.65 |
+2.18% |
+0.05% |
| Retail |
$RLX |
2,275.66 |
+53.12 |
+2.39% |
+31.26% |
| Gold & Silver |
$XAU |
70.10 |
-0.35 |
-0.50% |
-17.79% |
| Bank |
$BKX |
100.88 |
+0.90 |
+0.90% |
-5.46% |
| Biotech |
$BTK |
5,069.93 |
+214.82 |
+4.42% |
+20.08% |
|
|
|
 |
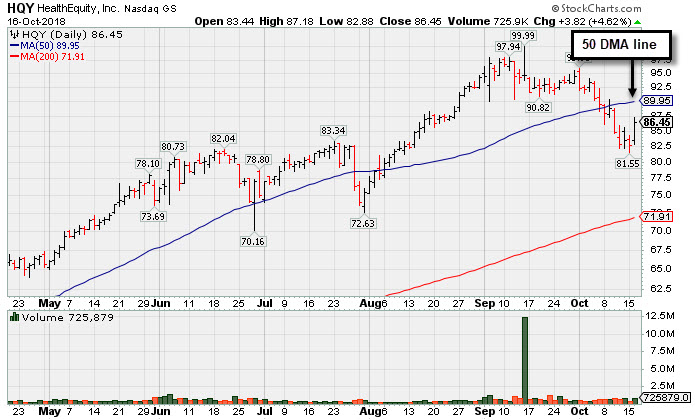
Below 50-Day Moving Average Which May Act as Resistance
Kenneth J. Gruneisen - Passed the CAN SLIM® Master's Exam
Healthequity Inc (HQY +$3.82 or +4.62% to $86.45) posted a big gain today rebounding toward its 50 DMA line ($89.95). That important short-term average may act as resistance. It found support near prior highs in the $82-83 area, but more damaging losses would raise serious concerns.
It was last shown in this FSU section on 9/10/18 with an annotated graph under the headline, "Very Extended From Any Sound Base After Streak of Gains". It reported earnings +62% on +25% sales revenues for the Jul '18 quarter versus the year ago period, continuing its strong earnings track record. Fundamentals remain strong, as the past 7 quarterly comparisons were above the +25% minimum earnings guideline (C criteria) and underpinned by strong sales revenues increases.
It has managed a bumpy climb that may have shaken out many investors since triggering a technical buy signal with a gain above the new pivot point with +90% above average volume when highlighted in the 2/20/18 mid-day report (read here).
The number of top-rated funds owning its shares rose from 369 in Dec '16 to 511 in Jun '18, a reassuring sign concerning the I criteria. Its current Up/Down Volume Ratio of 2.1 is also an unbiased indication its shares have been under accumulation over the past 50 days. It has a fairly small supply of only 62.3 million shares (S criteria) outstanding, which can contribute to greater price volatility in the event of institutional buying or selling. It currently has a Timeliness Rating of A and a Sponsorship Rating of B.
The Commercial Services - Outsourcing industry group currently has a Group Relative Strength Rating of 70, however there are other strong leaders in the group hitting new highs, a reassuring sign concerning the L criteria. It completed its $14 IPO on 7/31/14 followed by an additional Public Offering on 5/05/15 and Secondary Offerings on both 10/20/16 and 9/23/15. |
|
|
Color Codes Explained :
Y - Better candidates highlighted by our
staff of experts.
G - Previously featured
in past reports as yellow but may no longer be buyable under the
guidelines.
***Last / Change / Volume data in this table is the closing quote data***
Symbol/Exchange
Company Name
Industry Group |
PRICE |
CHANGE
(%Change) |
Day High |
Volume
(% DAV)
(% 50 day avg vol) |
52 Wk Hi
% From Hi |
Featured
Date |
Price
Featured |
Pivot Featured |
|
Max Buy |
SIVB
-
NASDAQ
S V B Financial Group
BANKING - Regional - Pacific Banks
|
$294.55
|
+7.40
2.58% |
$295.30
|
541,871
134.46% of 50 DAV
50 DAV is 403,000
|
$333.74
-11.74%
|
8/6/2018
|
$314.77
|
PP = $329.75
|
|
MB = $346.24
|
Most Recent Note - 10/12/2018 12:58:41 PM
G - Slumped below its 200 DMA ($287) with above average volume behind today's 7th consecutive loss raising greater concerns while also undercutting its 7/02/18 low ($284.42). A rebound above the 50 DMA line ($319) is needed for its outlook to improve. See the latest FSU analysis for more details and an annotated graph.
>>> FEATURED STOCK ARTICLE : Weak Action Amid Broader Market Declines - 10/11/2018 |
View all notes |
Set NEW NOTE alert |
Company Profile |
SEC
News |
Chart |
Request a new note
C
A
S
I |
GMED
-
NYSE
Globus Medical Inc Cl A
CHEMICALS - Specialty Chemicals
|
$54.28
|
+2.32
4.46% |
$54.34
|
541,684
89.83% of 50 DAV
50 DAV is 603,000
|
$57.55
-5.68%
|
9/26/2018
|
$56.11
|
PP = $57.65
|
|
MB = $60.53
|
 Most Recent Note - 10/16/2018 4:00:53 PM
Y - Halted its slide at its 200 DMA line and today's rebound above the 50 DMA line ($52.76) helped its outlook improve. Color code is changed to yellow. Subsequent gains above the pivot point backed by more than +40% above average volume are needed to trigger a proper technical buy signal.
>>> FEATURED STOCK ARTICLE : Rallying Near Pivot Point With Volume-Driven Gains - 9/26/2018 |
View all notes |
Set NEW NOTE alert |
Company Profile |
SEC
News |
Chart |
Request a new note
C
A
S
I |
ZBRA
-
NASDAQ
Zebra Tech Corp Cl A
COMPUTER HARDWARE - Computer Peripherals
|
$168.37
|
+7.57
4.71% |
$168.85
|
502,458
121.37% of 50 DAV
50 DAV is 414,000
|
$179.47
-6.18%
|
8/7/2018
|
$164.26
|
PP = $161.82
|
|
MB = $169.91
|
Most Recent Note - 10/16/2018 6:12:39 PM
G - Rebounded above the 50 DMA line ($167.93) with above average volume behind today's 4th consecutive gain, helping its outlook to improve. Still faces near-term resistance due to overhead supply up to $179.
>>> FEATURED STOCK ARTICLE : Hovering Near All-Time High With Strong Fundamentals - 9/24/2018 |
View all notes |
Set NEW NOTE alert |
Company Profile |
SEC
News |
Chart |
Request a new note
C
A
S
I |
CME
-
NASDAQ
C M E Group Inc
DIVERSIFIED SERVICES - Business/Management Services
|
$178.06
|
+4.24
2.44% |
$178.27
|
1,582,986
114.88% of 50 DAV
50 DAV is 1,378,000
|
$182.97
-2.68%
|
10/4/2018
|
$179.29
|
PP = $177.45
|
|
MB = $186.32
|
Most Recent Note - 10/15/2018 4:38:07 PM
Y - Pulled back amid broad market weakness (M criteria), undercutting prior highs in the $177 area, raising concerns. The 50 DMA line ($172) defines important near-term support.
>>> FEATURED STOCK ARTICLE : CME Group Blasted to New Record High - 10/4/2018 |
View all notes |
Set NEW NOTE alert |
Company Profile |
SEC
News |
Chart |
Request a new note
C
A
S
I |
FLT
-
NYSE
Fleetcor Technologies
DIVERSIFIED SERVICES - Business/Management Services
|
$213.89
|
+5.33
2.56% |
$214.15
|
408,799
84.29% of 50 DAV
50 DAV is 485,000
|
$230.24
-7.10%
|
9/12/2018
|
$221.01
|
PP = $226.02
|
|
MB = $237.32
|
Most Recent Note - 10/12/2018 6:01:22 PM
G - Rebounded near its 200 DMA line ($209) with today's volume-driven gain after 6 consecutive losses. A rebound above the 50 DMA line ($217) is needed for its outlook to improve. Subsequent volume-driven gains above the pivot point are needed to trigger a new (or add-on) technical buy signal.
>>> FEATURED STOCK ARTICLE : Perched Within Close Striking Distance of New Pivot Point - 9/20/2018 |
View all notes |
Set NEW NOTE alert |
Company Profile |
SEC
News |
Chart |
Request a new note
C
A
S
I |
Symbol/Exchange
Company Name
Industry Group |
PRICE |
CHANGE
(%Change) |
Day High |
Volume
(% DAV)
(% 50 day avg vol) |
52 Wk Hi
% From Hi |
Featured
Date |
Price
Featured |
Pivot Featured |
|
Max Buy |
MA
-
NYSE
Mastercard Inc Cl A
Finance-CrdtCard/PmtPr
|
$207.78
|
+7.46
3.72% |
$208.12
|
4,391,174
129.92% of 50 DAV
50 DAV is 3,380,000
|
$225.35
-7.80%
|
7/11/2018
|
$203.84
|
PP = $204.10
|
|
MB = $214.31
|
Most Recent Note - 10/12/2018 12:45:30 PM
G - Bouncing back today after damaging losses. Slumped near its 200 DMA line ($189) after volume-driven losses this week triggered technical sell signals. A rebound above the 50 DMA line ($211) is needed for its outlook to improve.
>>> FEATURED STOCK ARTICLE : Hovering Near High, Extended From Any Sound Base - 9/27/2018 |
View all notes |
Set NEW NOTE alert |
Company Profile |
SEC
News |
Chart |
Request a new note
C
A
S
I |
V
-
NYSE
Visa Inc Cl A
Finance-CrdtCard/PmtPr
|
$141.74
|
+4.51
3.29% |
$142.14
|
10,622,736
138.79% of 50 DAV
50 DAV is 7,654,000
|
$151.56
-6.48%
|
4/26/2018
|
$126.68
|
PP = $126.98
|
|
MB = $133.33
|
Most Recent Note - 10/12/2018 1:03:00 PM
G - Bouncing today after slumping near its 200 DMA line ($131) following noted technical sell signals. A rebound above the 50 DMA line ($144) is needed for its outlook to improve.
>>> FEATURED STOCK ARTICLE : Visa Near Record but Endured Distributional Pressure - 9/13/2018 |
View all notes |
Set NEW NOTE alert |
Company Profile |
SEC
News |
Chart |
Request a new note
C
A
S
I |
TPL
-
NYSE
Texas Pacific Land Trust
Real Estate Dvlpmt/Ops
|
$799.00
|
+21.32
2.74% |
$806.29
|
13,665
105.12% of 50 DAV
50 DAV is 13,000
|
$877.97
-8.99%
|
9/14/2018
|
$820.45
|
PP = $874.10
|
|
MB = $917.81
|
Most Recent Note - 10/15/2018 4:48:23 PM
G - Slumped further today after losses last week triggered technical sell signals. A rebound above the 50 DMA line ($828) is needed for its outlook to improve. The prior low ($760 on 8/15/18) defines the next important near-term support to watch.
>>> FEATURED STOCK ARTICLE : Slump Below 50-Day Moving Average Hurt Technical Stance - 10/12/2018 |
View all notes |
Set NEW NOTE alert |
Company Profile |
SEC
News |
Chart |
Request a new note
C
A
S
I |
ABMD
-
NASDAQ
Abiomed Inc
HEALTH SERVICES - Medical Instruments and Supplies
|
$386.88
|
+14.80
3.98% |
$388.11
|
459,096
79.29% of 50 DAV
50 DAV is 579,000
|
$459.75
-15.85%
|
9/25/2018
|
$441.96
|
PP = $451.03
|
|
MB = $473.58
|
Most Recent Note - 10/12/2018 5:42:27 PM
G - Posted a gain today with above average volume, breaking a streak of 9 consecutive losses. A prompt rebound above the 50 DMA line ($391) would help its outlook improve.
>>> FEATURED STOCK ARTICLE : Quick Rebound Near Prior High - 9/25/2018 |
View all notes |
Set NEW NOTE alert |
Company Profile |
SEC
News |
Chart |
Request a new note
C
A
S
I |
DPZ
-
NYSE
Dominos Pizza Inc
Retail-Restaurants
|
$259.63
|
-13.31
-4.88% |
$267.65
|
2,388,806
484.54% of 50 DAV
50 DAV is 493,000
|
$305.34
-14.97%
|
8/13/2018
|
$288.60
|
PP = $293.91
|
|
MB = $308.61
|
Most Recent Note - 10/16/2018 3:55:56 PM
G - Gapped down today for a damaging volume-driven loss. Reported earnings +54% on +22% sales revenues for the Sep '18 quarter, continuing its strong earnings track record. Volume and volatility often increase near earnings news. The prior low ($253.63 on 7/31/18) and 200 DMA line ($253) and define important near-term support to watch. See the latest FSU analysis for more details and an annotated graph.
>>> FEATURED STOCK ARTICLE : Sank Below 50 DMA Line Ahead of Earnings News - 10/15/2018 |
View all notes |
Set NEW NOTE alert |
Company Profile |
SEC
News |
Chart |
Request a new note
C
A
S
I |
Symbol/Exchange
Company Name
Industry Group |
PRICE |
CHANGE
(%Change) |
Day High |
Volume
(% DAV)
(% 50 day avg vol) |
52 Wk Hi
% From Hi |
Featured
Date |
Price
Featured |
Pivot Featured |
|
Max Buy |
FIVE
-
NASDAQ
Five Below Inc
Retail-DiscountandVariety
|
$120.19
|
+6.05
5.30% |
$120.41
|
620,296
65.23% of 50 DAV
50 DAV is 951,000
|
$136.13
-11.71%
|
7/6/2018
|
$98.90
|
PP = $104.09
|
|
MB = $109.29
|
Most Recent Note - 10/16/2018 3:58:40 PM
G - It has not formed a sound base but has rebounded above the 50 DMA line ($118.68) with today's quiet gain helping its outlook to improve. The prior high ($109.09 on 7/19/18) defines the next important support level to watch.
>>> FEATURED STOCK ARTICLE : Retreating After +138% Rally in Under 12 Months - 10/2/2018 |
View all notes |
Set NEW NOTE alert |
Company Profile |
SEC
News |
Chart |
Request a new note
C
A
S
I |
NVEE
-
NASDAQ
N V 5 Global Inc
Comml Svcs-Consulting
|
$84.79
|
+2.23
2.70% |
$85.49
|
67,701
77.82% of 50 DAV
50 DAV is 87,000
|
$92.75
-8.58%
|
6/15/2018
|
$7,070.00
|
PP = $72.00
|
|
MB = $75.60
|
Most Recent Note - 10/15/2018 4:35:29 PM
G - Posted a second consecutive small gain with lighter volume. A rebound above the 50 DMA line ($86.85) still is needed for its outlook to improve.
>>> FEATURED STOCK ARTICLE : Recently Slumped Below 50-Day Moving Average Line - 10/8/2018 |
View all notes |
Set NEW NOTE alert |
Company Profile |
SEC
News |
Chart |
Request a new note
C
A
S
I |
PANW
-
NYSE
Palo Alto Networks
Computer Sftwr-Security
|
$205.00
|
-4.20
-2.01% |
$205.91
|
3,004,625
242.50% of 50 DAV
50 DAV is 1,239,000
|
$239.50
-14.41%
|
6/12/2018
|
$206.55
|
PP = $214.69
|
|
MB = $225.42
|
Most Recent Note - 10/16/2018 6:09:57 PM
G - Gapped down and suffered a loss on heavy volume today. A rebound above the 50 DMA line ($221) is needed for its outlook to improve. Its 200 DMA line ($196) defines the next important support level to watch.
>>> FEATURED STOCK ARTICLE : Perched Near All-Time High With Volume Totals Cooling - 9/17/2018 |
View all notes |
Set NEW NOTE alert |
Company Profile |
SEC
News |
Chart |
Request a new note
C
A
S
I |
HQY
-
NASDAQ
Healthequity Inc
COMPUTER SOFTWARE and SERVICES - Healthcare Information Service
|
$86.45
|
+3.82
4.62% |
$87.18
|
724,747
93.88% of 50 DAV
50 DAV is 772,000
|
$99.99
-13.54%
|
8/13/2018
|
$82.39
|
PP = $83.44
|
|
MB = $87.61
|
Most Recent Note - 10/16/2018 4:09:40 PM
G - Posted a big gain today rebounding toward its 50 DMA line ($89.95) which may act as resistance. Found support near prior highs in the $82-83 area, but more damaging losses would raise serious concerns.
>>> FEATURED STOCK ARTICLE : Below 50-Day Moving Average Which May Act as Resistance - 10/16/2018 |
View all notes |
Set NEW NOTE alert |
Company Profile |
SEC
News |
Chart |
Request a new note
C
A
S
I |
OLLI
-
NASDAQ
Ollie's Bargain Outlet
Retail-DiscountandVariety
|
$92.03
|
+3.13
3.52% |
$92.19
|
470,320
72.25% of 50 DAV
50 DAV is 651,000
|
$97.61
-5.72%
|
7/12/2018
|
$74.43
|
PP = $77.60
|
|
MB = $81.48
|
Most Recent Note - 10/12/2018 6:07:39 PM
G - Halted its slide at its 50 DMA line ($85.09) with a gain today on average volume after volume-driven losses this week. The 50 DMA line defines near-term support well above prior highs in the $77 area. Fundamentals remain strong.
>>> FEATURED STOCK ARTICLE : Encountered Distributional Pressure After a Great Rally - 10/9/2018 |
View all notes |
Set NEW NOTE alert |
Company Profile |
SEC
News |
Chart |
Request a new note
C
A
S
I |
Symbol/Exchange
Company Name
Industry Group |
PRICE |
CHANGE
(%Change) |
Day High |
Volume
(% DAV)
(% 50 day avg vol) |
52 Wk Hi
% From Hi |
Featured
Date |
Price
Featured |
Pivot Featured |
|
Max Buy |
|
|
|
THESE ARE NOT BUY RECOMMENDATIONS!
Comments contained in the body of this report are technical
opinions only. The material herein has been obtained
from sources believed to be reliable and accurate, however,
its accuracy and completeness cannot be guaranteed.
This site is not an investment advisor, hence it does
not endorse or recommend any securities or other investments.
Any recommendation contained in this report may not
be suitable for all investors and it is not to be deemed
an offer or solicitation on our part with respect to
the purchase or sale of any securities. All trademarks,
service marks and trade names appearing in this report
are the property of their respective owners, and are
likewise used for identification purposes only.
This report is a service available
only to active Paid Premium Members.
You may opt-out of receiving report notifications
at any time. Questions or comments may be submitted
by writing to Premium Membership Services 665 S.E. 10 Street, Suite 201 Deerfield Beach, FL 33441-5634 or by calling 1-800-965-8307
or 954-785-1121.
|
|
|