You are not logged in.
This means you
CAN ONLY VIEW reports that were published prior to Thursday, April 10, 2025.
You
MUST UPGRADE YOUR MEMBERSHIP if you want to see any current reports.
AFTER MARKET UPDATE - WEDNESDAY, SEPTEMBER 21ST, 2022
Previous After Market Report Next After Market Report >>>
|
|
|
|
DOW |
-522.45 |
30,183.78 |
-1.70% |
|
Volume |
892,019,557 |
-1% |
|
Volume |
4,544,999,700 |
+13% |
|
NASDAQ |
-204.86 |
11,220.19 |
-1.79% |
|
Advancers |
823 |
27% |
|
Advancers |
1,110 |
26% |
|
S&P 500 |
-66.00 |
3,789.93 |
-1.71% |
|
Decliners |
2,173 |
73% |
|
Decliners |
3,087 |
74% |
|
Russell 2000 |
-25.35 |
1,762.16 |
-1.42% |
|
52 Wk Highs |
22 |
|
|
52 Wk Highs |
36 |
|
|
S&P 600 |
-13.01 |
1,129.28 |
-1.14% |
|
52 Wk Lows |
372 |
|
|
52 Wk Lows |
638 |
|
|
The market (M criteria) is in a correction. A caution flag has been raised by the technical damage in the major indices coupled with a shrinking list of stocks hitting new highs. Disciplined investors know to raise cash by selling weakening stocks on a case-by-case basis, and to protect that cash by avoiding any new buys until a new rally is confirmed with a follow-through day.
|
 |
Breadth Negative as Major Averages Slump Toward June Lows
Kenneth J. Gruneisen - Passed the CAN SLIM® Master's Exam
The Dow lost 522 points, while the Nasdaq Composite shed 1.8%. The S&P 500 declined 1.7%, with all sectors ending in negative territory. The volume totals reported were mixed, lighter than the prior session on the NYSE and higher on the Nasdaq exchange. Breadth was negative as decliners led advancers by almost a 3-1 margin on the NYSE and on the Nasdaq exchange. There were 5 high-ranked companies from the Leaders List that hit new 52-week highs and were listed on the BreakOuts Page, up from the total of 1 on the prior session. New 52-week lows totals again solidly outnumbered new 52-week highs on both the NYSE and the Nasdaq exchange. The market is now in a correction (M criteria).
Chart courtesy of www.stockcharts.com%20on%20Tuesday.%20Yesterday,%20the%20broad%20benchmark%20eclipsed%20the%204,300%20level%20for%20the%20first%20time%20since%20late%20April.%20The%20Nasdaq%20Composite%20fell%201.3%%20amid%20weakness%20in%20mega-cap%20tech%20shares.%20The%20volume%20totals%20reported%20were%20mixed,%20lighter%20than%20the%20prior%20session%20on%20the%20NYSE%20and%20higher%20on%20the%20Nasdaq%20exchange.%20Decliners%20led%20advancers%20by%20a%204-1%20margin%20on%20the%20NYSE%20ad%20by%20a%203-1%20margin%20on%20the%20Nasdaq%20exchange.%20There%20were%2017%20high-ranked%20companies%20from%20the%20Leaders%20List%20that%20hit%20new%2052-week%20highs%20and%20were%20listed%20on%20the%20BreakOuts%20Page,%20down%20from%20the%20total%20of%2045%20on%20the%20prior%20session.%20New%2052-week%20highs%20outnumbered%20new%2052-week%20lows%20on%20the%20NYSE,%20but%20new%20lows%20outnumbered%20new%20highs%20on%20the%20Nasdaq%20exchange.%20The%20market%20is%20in%20a%20confirmed%20uptrend%20(M%20criteria).%20Any%20sustainable%20rally%20requires%20a%20healthy%20crop%20of%20leading%20stocks%20hitting%20new%20highs,%20so%20the%20recent%20improvement%20in%20leadership%20was%20a%20reassuring%20sign.) 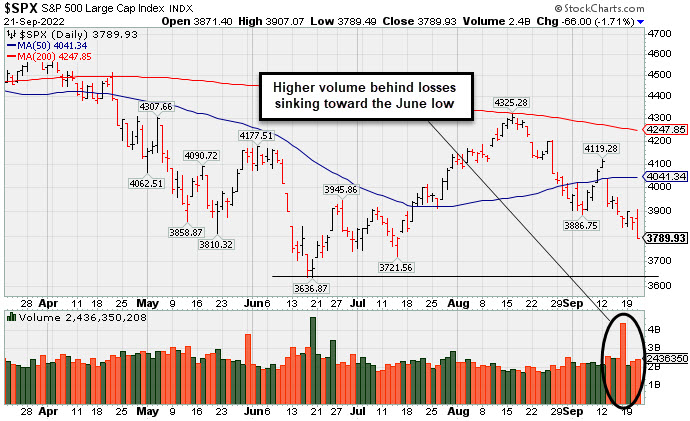 PICTURED: The S&P 500 Index fell again with higher volume. It recently slumped back below its 50-day moving average (DMA) line toward the June low.
U.S. equities finished lower Wednesday in volatile trading as investors digested the Federal Reserve’s (Fed) monetary policy decision. The Federal Open Market Committee (FOMC) has announced a third-straight 75-basis point (0.75%) rate hike to bring the benchmark rate up to 3% to 3.25%, its highest level since 2008. Fed officials anticipate the benchmark rate will rise to a steeper-than-expected 4.4% by the end of 2022 and will climb to 4.6% in 2023. The updated economic outlook showed unemployment rising to 4.4% in 2023 and holding there in 2024, while projections for economic growth ticked lower to accommodate the impact from aggressive tightening. Fed Chairman Jerome Powell held a press conference following the release where he reaffirmed they will continue to raise rates to fight inflation, even though it will cause some economic pain.
Shorter-dated Treasuries weakened, with the two-year note yield, which is more sensitive to changes in monetary policy, jumping eight basis points (0.08%) to 4.03%. The yield on the benchmark 10-year note slid five basis points (0.05%) to 3.51%, while the yield on the 30-year bond dipped eight basis points (0.08%) to 3.49%. A gauge of the U.S. dollar gained 0.9% to notch a fresh two-decade high. In commodities, West Texas Intermediate (WTI) crude dipped 0.7% to $83.35/barrel amid a stronger dollar and renewed recessionary concerns following the Fed’s rate hike decision. |
 Kenneth J. Gruneisen started out as a licensed stockbroker in August 1987, a couple of months prior to the historic stock market crash that took the Dow Jones Industrial Average down -22.6% in a single day. He has published daily fact-based fundamental and technical analysis on high-ranked stocks online for two decades. Through FACTBASEDINVESTING.COM, Kenneth provides educational articles, news, market commentary, and other information regarding proven investment systems that work in good times and bad.
Comments contained in the body of this report are technical opinions only and are not necessarily those of Gruneisen Growth Corp. The material herein has been obtained from sources believed to be reliable and accurate, however, its accuracy and completeness cannot be guaranteed. Our firm, employees, and customers may effect transactions, including transactions contrary to any recommendation herein, or have positions in the securities mentioned herein or options with respect thereto. Any recommendation contained in this report may not be suitable for all investors and it is not to be deemed an offer or solicitation on our part with respect to the purchase or sale of any securities. |
|
 |
Financial, Retail, Tech, and Energy-Linked Groups Fell
Kenneth J. Gruneisen - Passed the CAN SLIM® Master's Exam
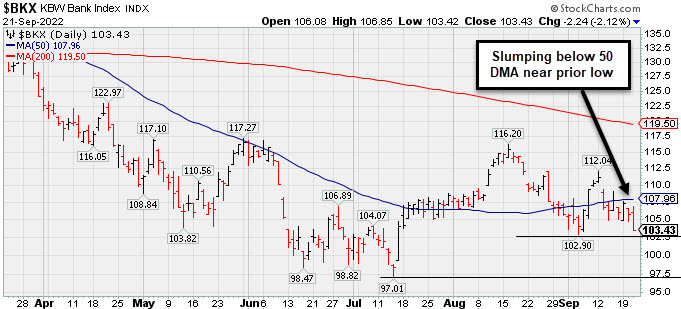
The Retail Index ($RLX -2.09%), Bank Index ($BKX -2.12%), and Broker/Dealer Index ($XBD -0.85%) each lost ground and weighed on the major averages. The tech sector saw unanimous losses from the Biotech Index ($BTK -2.53%), Networking Index ($NWX -1.15%), and the Semiconductor Index ($SOX -0.97%). The Oil Services Index ($OSX -1.96%) and Integrated Oil Index ($XOI -1.59%) both lost ground, and the Gold & Silver Index ($XAU -0.19%) also inched lower.
PICTURED: The Bank Index ($BKX -2.12%) is slumping below its 50-day moving average (DMA) line toward the prior low.
| Oil Services |
$OSX |
63.61 |
-1.27 |
-1.96% |
+20.66% |
| Integrated Oil |
$XOI |
1,572.00 |
-25.36 |
-1.59% |
+33.42% |
| Semiconductor |
$SOX |
2,514.96 |
-24.54 |
-0.97% |
-36.27% |
| Networking |
$NWX |
756.56 |
-8.83 |
-1.15% |
-22.09% |
| Broker/Dealer |
$XBD |
433.78 |
-3.71 |
-0.85% |
-10.90% |
| Retail |
$RLX |
3,064.12 |
-65.50 |
-2.09% |
-27.50% |
| Gold & Silver |
$XAU |
99.53 |
-0.19 |
-0.19% |
-24.85% |
| Bank |
$BKX |
103.43 |
-2.24 |
-2.12% |
-21.77% |
| Biotech |
$BTK |
4,574.11 |
-118.71 |
-2.53% |
-17.11% |
|
|
|
 |
Featured Stocks
Kenneth J. Gruneisen - Passed the CAN SLIM® Master's Exam
|
|
|
Color Codes Explained :
Y - Better candidates highlighted by our
staff of experts.
G - Previously featured
in past reports as yellow but may no longer be buyable under the
guidelines.
***Last / Change / Volume data in this table is the closing quote data***
Symbol/Exchange
Company Name
Industry Group |
PRICE |
CHANGE
(%Change) |
Day High |
Volume
(% DAV)
(% 50 day avg vol) |
52 Wk Hi
% From Hi |
Featured
Date |
Price
Featured |
Pivot Featured |
|
Max Buy |
 CI
-
NYSE
CI
-
NYSE
Cigna Corp
Medical-Managed Care
|
$284.95
|
-3.13
-1.09% |
$294.28
|
1,802,145
92.75% of 50 DAV
50 DAV is 1,943,000
|
$296.29
-3.83%
|
7/7/2022
|
$276.55
|
PP = $273.68
|
|
MB = $287.36
|
 Most Recent Note - 9/21/2022 2:46:19 PM
G - Found support above its 50 DMA line ($282) while consolidating near its all-time high in recent weeks. Reported earnings for the Jun '22 quarter rose +19% on +5% sales revenues versus the year ago period, breaking a streak of 3 quarterly earnings increases above the +25% minimum guideline (C criteria), raising fundamental concerns.
>>> FEATURED STOCK ARTICLE : Found Support Above 50-Day Moving Average Line This Week - 9/16/2022 |
View all notes |
Set NEW NOTE alert |
Company Profile |
SEC
News |
Chart |
Request a new note
C
A
S
I |
ESQ
-
NASDAQ
Esquire Financial Holdings
Finance-Commercial Loans
|
$38.44
|
-0.64
-1.64% |
$38.96
|
15,692
58.12% of 50 DAV
50 DAV is 27,000
|
$41.68
-7.77%
|
7/26/2022
|
$37.74
|
PP = $39.19
|
|
MB = $41.15
|
Most Recent Note - 9/20/2022 5:35:50 PM
Y - Making gradual progress after recently finding support near its 50 DMA line ($37.38). Gains back above the pivot point were a reassuring sign of fresh institutional buying. The market is in a correction (M criteria) and disciplined investors know to avoid new buying efforts until a new rally confirmed with a follow-through day. See the latest FSU analysis for more details and a new annotated graph.
>>> FEATURED STOCK ARTICLE : Thinly-Traded Esquire Still Perched Near High - 9/20/2022 |
View all notes |
Set NEW NOTE alert |
Company Profile |
SEC
News |
Chart |
Request a new note
C
A
S
I |
CSL
-
NYSE
Carlisle Cos Inc
Diversified Operations
|
$284.81
|
-4.78
-1.65% |
$293.65
|
545,188
109.26% of 50 DAV
50 DAV is 499,000
|
$318.71
-10.64%
|
7/28/2022
|
$282.31
|
PP = $275.23
|
|
MB = $288.99
|
Most Recent Note - 9/20/2022 5:38:21 PM
G - Loss today undercut the prior low $291 and violated its 50 DMA line ($292.59) raising greater concerns and triggering a technical sell signal. Only a prompt rebound above the 50 DMA line would help its outlook improve.
>>> FEATURED STOCK ARTICLE : Consolidating Near High Well Above 50-Day Moving Average - 9/14/2022 |
View all notes |
Set NEW NOTE alert |
Company Profile |
SEC
News |
Chart |
Request a new note
C
A
S
I |
ENPH
-
NASDAQ
Enphase Energy Inc
Energy-Solar
|
$304.56
|
-0.15
-0.05% |
$318.49
|
4,192,476
114.52% of 50 DAV
50 DAV is 3,661,000
|
$324.84
-6.24%
|
7/28/2022
|
$276.66
|
PP = $282.55
|
|
MB = $296.68
|
Most Recent Note - 9/20/2022 5:40:14 PM
G - Pulled back today with lighter than average volume, still hovering near its all-time high. Its 50 DMA line ($275.49) and recent lows in the $271-272 area define important near-term support. Fundamentals remain strong.
>>> FEATURED STOCK ARTICLE : High-Ranked Solar Energy Firm Hovering Near All-Time High - 9/13/2022 |
View all notes |
Set NEW NOTE alert |
Company Profile |
SEC
News |
Chart |
Request a new note
C
A
S
I |
PWR
-
NYSE
Quanta Services Inc
MATERIALS and CONSTRUCTION - General Contractors
|
$136.53
|
-2.04
-1.47% |
$142.14
|
699,717
62.81% of 50 DAV
50 DAV is 1,114,000
|
$149.33
-8.57%
|
7/28/2022
|
$141.83
|
PP = $140.14
|
|
MB = $147.15
|
Most Recent Note - 9/21/2022 7:50:16 PM
G - Color code is changed to green after slumping below its 50 DMA line ($139) with a loss today on light volume raising concerns. A rebound back above the 50 DMA line is again needed for its outlook to improve. Fundamentals remain strong.
>>> FEATURED STOCK ARTICLE : Consolidating Near Prior Highs and Above 50-Day Moving Average - 9/7/2022 |
View all notes |
Set NEW NOTE alert |
Company Profile |
SEC
News |
Chart |
Request a new note
C
A
S
I |
Symbol/Exchange
Company Name
Industry Group |
PRICE |
CHANGE
(%Change) |
Day High |
Volume
(% DAV)
(% 50 day avg vol) |
52 Wk Hi
% From Hi |
Featured
Date |
Price
Featured |
Pivot Featured |
|
Max Buy |
GFF
-
NYSE
Griffon Corporation
MATERIALS and CONSTRUCTION - General Building Materials
|
$31.25
|
-0.60
-1.88% |
$32.42
|
187,590
49.89% of 50 DAV
50 DAV is 376,000
|
$34.92
-10.51%
|
8/8/2022
|
$32.46
|
PP = $31.12
|
|
MB = $32.68
|
Most Recent Note - 9/21/2022 7:48:11 PM
Y - Fell today with light volume, slumping near its 50 DMA line ($31). Prior low in the $30 area defines the next important near-term support.
>>> FEATURED STOCK ARTICLE : Griffon Near All-Time High Making Limited Progress - 9/15/2022 |
View all notes |
Set NEW NOTE alert |
Company Profile |
SEC
News |
Chart |
Request a new note
C
A
S
I |
CLH
-
NYSE
Clean Harbors Inc
Pollution Control
|
$115.70
|
-0.85
-0.73% |
$118.78
|
349,008
98.04% of 50 DAV
50 DAV is 356,000
|
$124.49
-7.06%
|
8/10/2022
|
$111.78
|
PP = $115.10
|
|
MB = $120.86
|
Most Recent Note - 9/19/2022 5:51:59 PM
Y - Color code is changed to yellow after consolidating below its "max buy" level and recently testing the prior high in the $115 area noted as important near-term support to watch. More damaging losses would raise concerns. Fundamentals remain strong. See the latest FSU analysis for more details and a new annotated graph.
>>> FEATURED STOCK ARTICLE : Tested Support Near Prior High in the $115 Area - 9/19/2022 |
View all notes |
Set NEW NOTE alert |
Company Profile |
SEC
News |
Chart |
Request a new note
C
A
S
I |
CASY
-
NASDAQ
Caseys General Stores
RETAIL - Super/Mini Markets
|
$212.86
|
-0.80
-0.37% |
$216.09
|
164,585
66.10% of 50 DAV
50 DAV is 249,000
|
$223.90
-4.93%
|
9/8/2022
|
$217.81
|
PP = $222.40
|
|
MB = $233.52
|
Most Recent Note - 9/21/2022 2:42:26 PM
Y - Still holding its ground and volume totals have been cooling while consolidating above its 50 DMA line ($209.81). Failed to close above the pivot point and clinch a proper technical buy signal since featured on 9/08/22. Fundamentals remain strong.
>>> FEATURED STOCK ARTICLE : Casey's is Perched Within Close Range of All-Time High - 9/9/2022 |
View all notes |
Set NEW NOTE alert |
Company Profile |
SEC
News |
Chart |
Request a new note
C
A
S
I |
CPRX
-
NASDAQ
Catalyst Pharma Inc
Medical-Biomed/Biotech
|
$12.46
|
-0.34
-2.66% |
$13.08
|
2,478,209
67.29% of 50 DAV
50 DAV is 3,683,000
|
$17.22
-27.64%
|
9/8/2022
|
$15.14
|
PP = $15.17
|
|
MB = $15.93
|
Most Recent Note - 9/21/2022 2:51:05 PM
G - Today it is nearly testing its 50 DMA line ($12.39) which has been noted as near-term support to watch while abruptly retreating from its high.
>>> FEATURED STOCK ARTICLE : Hit a New High After a 4-Week Tight Pattern of Closes - 9/8/2022 |
View all notes |
Set NEW NOTE alert |
Company Profile |
SEC
News |
Chart |
Request a new note
C
A
S
I |
CCRN
-
NASDAQ
Cross Country Healthcare
DIVERSIFIED SERVICES - Staffing and Outsourcing Service
|
$29.04
|
-0.54
-1.83% |
$29.98
|
655,725
72.14% of 50 DAV
50 DAV is 909,000
|
$30.51
-4.82%
|
9/9/2022
|
$27.32
|
PP = $30.61
|
|
MB = $32.14
|
Most Recent Note - 9/21/2022 2:45:31 PM
Y - Volume totals have been cooling while stubbornly holding its ground perched within close striking distance of prior highs in the $30 area. Its 50 DMA line ($25.87) defines important support to watch on pullbacks. Recently reported insider buying is a reassuring sign.The market is in a correction (M criteria) and disciplined investors know to avoid new buying efforts until a new rally confirmed with a follow-through day.
>>> FEATURED STOCK ARTICLE : Positive Reversal While Consolidating Above 50-Day Moving Average - 9/12/2022 |
View all notes |
Set NEW NOTE alert |
Company Profile |
SEC
News |
Chart |
Request a new note
C
A
S
I |
Symbol/Exchange
Company Name
Industry Group |
PRICE |
CHANGE
(%Change) |
Day High |
Volume
(% DAV)
(% 50 day avg vol) |
52 Wk Hi
% From Hi |
Featured
Date |
Price
Featured |
Pivot Featured |
|
Max Buy |
|
|
|
THESE ARE NOT BUY RECOMMENDATIONS!
Comments contained in the body of this report are technical
opinions only. The material herein has been obtained
from sources believed to be reliable and accurate, however,
its accuracy and completeness cannot be guaranteed.
This site is not an investment advisor, hence it does
not endorse or recommend any securities or other investments.
Any recommendation contained in this report may not
be suitable for all investors and it is not to be deemed
an offer or solicitation on our part with respect to
the purchase or sale of any securities. All trademarks,
service marks and trade names appearing in this report
are the property of their respective owners, and are
likewise used for identification purposes only.
This report is a service available
only to active Paid Premium Members.
You may opt-out of receiving report notifications
at any time. Questions or comments may be submitted
by writing to Premium Membership Services 665 S.E. 10 Street, Suite 201 Deerfield Beach, FL 33441-5634 or by calling 1-800-965-8307
or 954-785-1121.
|
|
|