You are not logged in.
This means you
CAN ONLY VIEW reports that were published prior to Tuesday, April 1, 2025.
You
MUST UPGRADE YOUR MEMBERSHIP if you want to see any current reports.
AFTER MARKET UPDATE - FRIDAY, SEPTEMBER 16TH, 2022
Previous After Market Report Next After Market Report >>>
|
|
|
|
DOW |
-139.40 |
30,822.42 |
-0.45% |
|
Volume |
3,392,597,800 |
+242% |
|
Volume |
7,187,565,700 |
+50% |
|
NASDAQ |
-103.95 |
11,448.40 |
-0.90% |
|
Advancers |
805 |
27% |
|
Advancers |
1,328 |
32% |
|
S&P 500 |
-28.02 |
3,873.33 |
-0.72% |
|
Decliners |
2,175 |
73% |
|
Decliners |
2,787 |
68% |
|
Russell 2000 |
-27.04 |
1,798.19 |
-1.48% |
|
52 Wk Highs |
13 |
|
|
52 Wk Highs |
26 |
|
|
S&P 600 |
-7.48 |
1,144.98 |
-0.65% |
|
52 Wk Lows |
362 |
|
|
52 Wk Lows |
483 |
|
|
The market (M criteria) is in a correction. A caution flag has been raised by the technical damage in the major indices coupled with a shrinking list of stocks hitting new highs. Disciplined investors know to raise cash by selling weakening stocks on a case-by-case basis, and to protect that cash by avoiding any new buys until a new rally is confirmed with a follow-through day.
|
 |
Weakness Signals a More Worrisome Market Correction
Kenneth J. Gruneisen - Passed the CAN SLIM® Master's Exam
The Dow lost 139 points to end the week 4.1% lower. The S&P 500 shed 0.7%, notching a 4.8% weekly decline. Both benchmarks had their worst week since mid-June. The Nasdaq Composite fell 0.9% to finish the week 5.5% lower, its worst weekly drop since January. The volume totals reported were higher than the prior session on the NYSE and on the Nasdaq exchange, inflated by options expirations. Breadth was negative as decliners led advancers by an 11-4 margin on the NYSE and 2-1 on the Nasdaq exchange. Leadership evaporated as there were zero high-ranked companies from the Leaders List that hit new 52-week highs and were listed on the BreakOuts Page, down from the total of 5 on the prior session. New 52-week lows totals swelled and solidly outnumbered new 52-week highs on both the NYSE and the Nasdaq exchange. The market is now in a correction (M criteria).
Chart courtesy of www.stockcharts.com%20on%20Tuesday.%20Yesterday,%20the%20broad%20benchmark%20eclipsed%20the%204,300%20level%20for%20the%20first%20time%20since%20late%20April.%20The%20Nasdaq%20Composite%20fell%201.3%%20amid%20weakness%20in%20mega-cap%20tech%20shares.%20The%20volume%20totals%20reported%20were%20mixed,%20lighter%20than%20the%20prior%20session%20on%20the%20NYSE%20and%20higher%20on%20the%20Nasdaq%20exchange.%20Decliners%20led%20advancers%20by%20a%204-1%20margin%20on%20the%20NYSE%20ad%20by%20a%203-1%20margin%20on%20the%20Nasdaq%20exchange.%20There%20were%2017%20high-ranked%20companies%20from%20the%20Leaders%20List%20that%20hit%20new%2052-week%20highs%20and%20were%20listed%20on%20the%20BreakOuts%20Page,%20down%20from%20the%20total%20of%2045%20on%20the%20prior%20session.%20New%2052-week%20highs%20outnumbered%20new%2052-week%20lows%20on%20the%20NYSE,%20but%20new%20lows%20outnumbered%20new%20highs%20on%20the%20Nasdaq%20exchange.%20The%20market%20is%20in%20a%20confirmed%20uptrend%20(M%20criteria).%20Any%20sustainable%20rally%20requires%20a%20healthy%20crop%20of%20leading%20stocks%20hitting%20new%20highs,%20so%20the%20recent%20improvement%20in%20leadership%20was%20a%20reassuring%20sign.) 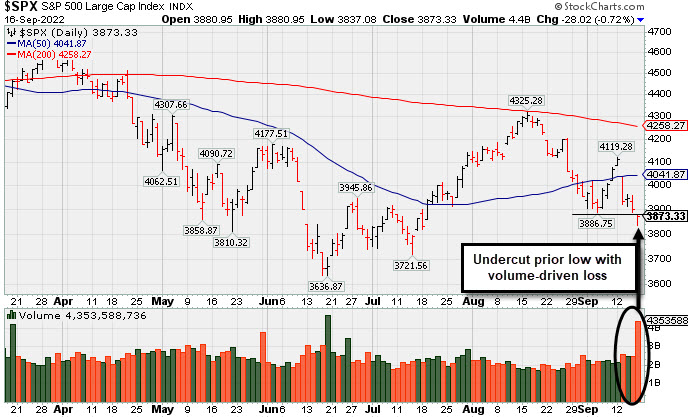 PICTURED: The S&P 500 Index undercut the prior low with a volume-driven loss and slumped back toward the June low.
U.S. equities fell on Friday as concerns about the Federal Reserve’s (Fed) aggressive monetary policy weighed on sentiment. In corporate news, FedEx Corp. (FDX -21.40%) gapped down for a considerable loss after withdrawing its full-year guidance and warning about the health of the global economy. The warning contributed to today’s sell-off, as it added to growing concerns over an impending recession.
On the data front, the University of Michigan’s preliminary September reading of expectations for one-year inflation hit their lowest level since September 2021, while expectations for long-term inflation hit their lowest print since July 2021. Treasuries were mixed, with the yield on the benchmark 10-year note steady at 3.45%, while the yield on the 30-year bond added four basis points (0.04%) to 3.51%. This week, the 10-year note yield and the 30-year bond yield climbed 13 basis points (0.13%) and six basis points (0.06%), respectively. The two-year note yield was little changed at 3.86%. The policy-sensitive two-year note yield climbed 30 basis points (0.30%) and notched its highest level since 2007. A gauge of the U.S. dollar closed 0.8% higher for the week, bolstered by the increased probability of an aggressive rate hike by the Fed. In commodities, West Texas Intermediate (WTI) crude climbed 0.3% to $85.37/barrel, but ended 1.7% lower for the week amid demand woes. |
 Kenneth J. Gruneisen started out as a licensed stockbroker in August 1987, a couple of months prior to the historic stock market crash that took the Dow Jones Industrial Average down -22.6% in a single day. He has published daily fact-based fundamental and technical analysis on high-ranked stocks online for two decades. Through FACTBASEDINVESTING.COM, Kenneth provides educational articles, news, market commentary, and other information regarding proven investment systems that work in good times and bad.
Comments contained in the body of this report are technical opinions only and are not necessarily those of Gruneisen Growth Corp. The material herein has been obtained from sources believed to be reliable and accurate, however, its accuracy and completeness cannot be guaranteed. Our firm, employees, and customers may effect transactions, including transactions contrary to any recommendation herein, or have positions in the securities mentioned herein or options with respect thereto. Any recommendation contained in this report may not be suitable for all investors and it is not to be deemed an offer or solicitation on our part with respect to the purchase or sale of any securities. |
|
 |
Financial, Retail, and Energy-Linked Groups Fell
Kenneth J. Gruneisen - Passed the CAN SLIM® Master's Exam
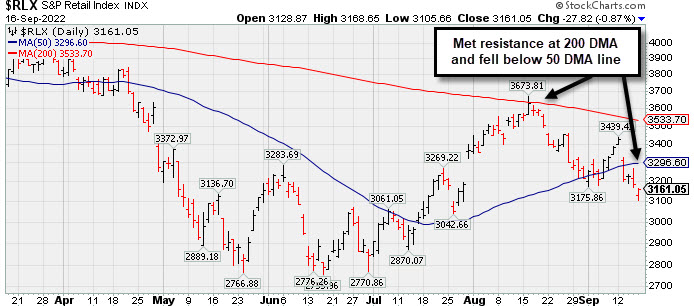
The Broker/Dealer Index ($XBD -1.77%) and Bank Index ($BKX -1.51%) both lost ground and the Retail Index ($RLX -0.87%) also created a drag on the major averages on Friday. The Semiconductor Index ($SOX +0.53%) posted a small gain while the Networking Index ($NWX -0.69%) and Biotech Index ($BTK -1.02%) both fell. Commodity-linked groups were mixed as the Oil Services Index ($OSX -3.69%) and Integrated Oil Index ($XOI -1.41%) both lost ground while the Gold & Silver Index ($XAU +0.59%) edged higher.
PICTURED: The Retail Index ($RLX -0.87%) met resistance at its 200-day moving average (DMA) line in August and slumped below its 50 DMA line with this week's losses.
| Oil Services |
$OSX |
66.38 |
-2.54 |
-3.69% |
+25.92% |
| Integrated Oil |
$XOI |
1,601.78 |
-22.89 |
-1.41% |
+35.95% |
| Semiconductor |
$SOX |
2,563.14 |
+13.60 |
+0.53% |
-35.05% |
| Networking |
$NWX |
779.34 |
-5.43 |
-0.69% |
-19.74% |
| Broker/Dealer |
$XBD |
438.70 |
-7.90 |
-1.77% |
-9.89% |
| Retail |
$RLX |
3,161.05 |
-27.82 |
-0.87% |
-25.21% |
| Gold & Silver |
$XAU |
99.76 |
+0.58 |
+0.59% |
-24.68% |
| Bank |
$BKX |
106.08 |
-1.63 |
-1.51% |
-19.77% |
| Biotech |
$BTK |
4,750.79 |
-48.78 |
-1.02% |
-13.91% |
|
|
|
 |
Found Support Above 50-Day Moving Average Line This Week
Kenneth J. Gruneisen - Passed the CAN SLIM® Master's Exam
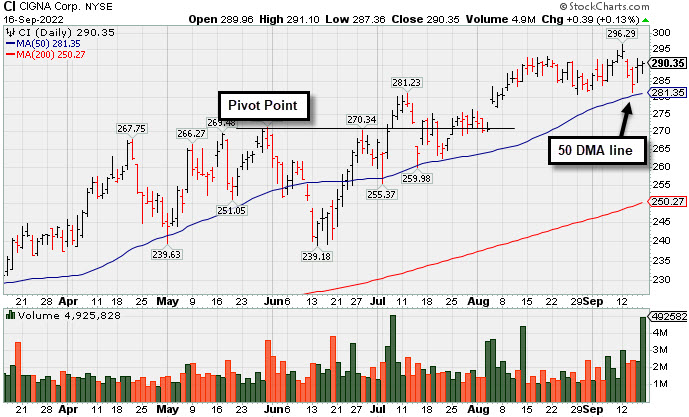
Cigna Corp (CI +$0.39 or +0.13% to $290.35) is consolidating above its 50 DMA line ($282.25) while perched near its all-time high hit this week. Earnings for the Jun '22 quarter rose +19% on +5% sales revenues versus the year ago period, breaking a streak of 3 quarterly earnings increases above the +25% minimum guideline (C criteria), raising fundamental concerns. Still, CI has a 94 Earnings Per Share Rating. Annual earnings growth (A criteria) has been strong.
The number of top-rated funds owning its shares rose from 2,628 in Dec '21 to 2,866 in Jun '22, a reassuring sign concerning the I criteria. The Medical - Managed Care group is currently ranked 23rd on the 197 Industry Groups list and has a Group Relative Strength Rating of 88 (A+), a reassuring sign concerning the L criteria. Its current Up/Down Volume Ratio of 1.5 is an unbiased indication its shares have been under accumulation over the past 50 days.
|
|
|
Color Codes Explained :
Y - Better candidates highlighted by our
staff of experts.
G - Previously featured
in past reports as yellow but may no longer be buyable under the
guidelines.
***Last / Change / Volume data in this table is the closing quote data***
Symbol/Exchange
Company Name
Industry Group |
PRICE |
CHANGE
(%Change) |
Day High |
Volume
(% DAV)
(% 50 day avg vol) |
52 Wk Hi
% From Hi |
Featured
Date |
Price
Featured |
Pivot Featured |
|
Max Buy |
 CI
-
NYSE
CI
-
NYSE
Cigna Corp
Medical-Managed Care
|
$290.35
|
+0.39
0.13% |
$291.10
|
4,982,710
256.18% of 50 DAV
50 DAV is 1,945,000
|
$296.29
-2.00%
|
7/7/2022
|
$276.55
|
PP = $273.68
|
|
MB = $287.36
|
 Most Recent Note - 9/16/2022 6:14:05 PM
G - Found support above its 50 DMA line ($282) while consolidating near its all-time high hit this week. Reported earnings for the Jun '22 quarter rose +19% on +5% sales revenues versus the year ago period, breaking a streak of 3 quarterly earnings increases above the +25% minimum guideline (C criteria), raising fundamental concerns. See the latest FSU for more detailed analysis and a new annotated graph.
>>> FEATURED STOCK ARTICLE : Found Support Above 50-Day Moving Average Line This Week - 9/16/2022 |
View all notes |
Set NEW NOTE alert |
Company Profile |
SEC
News |
Chart |
Request a new note
C
A
S
I |
ESQ
-
NASDAQ
Esquire Financial Holdings
Finance-Commercial Loans
|
$39.69
|
+0.90
2.32% |
$39.85
|
50,015
187.32% of 50 DAV
50 DAV is 26,700
|
$41.68
-4.77%
|
7/26/2022
|
$37.74
|
PP = $39.19
|
|
MB = $41.15
|
Most Recent Note - 9/16/2022 6:32:38 PM
Y - Posted a 3rd consecutive gain today, its 7th gain in the span of 8 sessions after recently finding support near its 50 DMA line ($37.25). The gain back above the pivot point was a reassuring sign of fresh institutional buying. The market is in a correction (M criteria) and disciplined investors know to avoid new buying efforts until a new rally confirmed with a follow-through day.
>>> FEATURED STOCK ARTICLE : Testing 50-Day Moving Average With 5th Straight Loss - 9/1/2022 |
View all notes |
Set NEW NOTE alert |
Company Profile |
SEC
News |
Chart |
Request a new note
C
A
S
I |
GPK
-
NYSE
Graphic Packaging Hldg
CONSUMER NON-DURABLES - Packaging and Containers
|
$21.31
|
-1.41
-6.21% |
$22.24
|
5,443,162
200.12% of 50 DAV
50 DAV is 2,720,000
|
$24.07
-11.47%
|
7/26/2022
|
$22.63
|
PP = $23.09
|
|
MB = $24.24
|
Most Recent Note - 9/16/2022 12:54:12 PM
G - Gapped down today violating its 50 DMA line ($22.32) triggering a technical sell signal and its color code is changed to green. Stalled after wedging to a new 52-week high with gains lacking great volume conviction. Only a prompt rebound above its 50 DMA line would help its outlook improve.
>>> FEATURED STOCK ARTICLE : Recently Slipped Below Pivot Point Testing 50-Day Average - 9/6/2022 |
View all notes |
Set NEW NOTE alert |
Company Profile |
SEC
News |
Chart |
Request a new note
C
A
S
I |
CSL
-
NYSE
Carlisle Cos Inc
Diversified Operations
|
$291.30
|
-9.93
-3.30% |
$297.15
|
664,034
140.39% of 50 DAV
50 DAV is 473,000
|
$318.71
-8.60%
|
7/28/2022
|
$282.31
|
PP = $275.23
|
|
MB = $288.99
|
Most Recent Note - 9/16/2022 2:46:38 PM
G - Gapped down today undercutting the prior low $291 and testing its 50 DMA line ($290.86). More damaging losses would raise greater concerns and trigger a technical sell signal,
>>> FEATURED STOCK ARTICLE : Consolidating Near High Well Above 50-Day Moving Average - 9/14/2022 |
View all notes |
Set NEW NOTE alert |
Company Profile |
SEC
News |
Chart |
Request a new note
C
A
S
I |
ENPH
-
NASDAQ
Enphase Energy Inc
Energy-Solar
|
$318.01
|
+5.83
1.87% |
$318.32
|
4,848,692
132.91% of 50 DAV
50 DAV is 3,648,000
|
$324.84
-2.10%
|
7/28/2022
|
$276.66
|
PP = $282.55
|
|
MB = $296.68
|
Most Recent Note - 9/16/2022 6:42:10 PM
G - Hovering near its all-time high holding its ground after a volume-driven breakout gain on 9/07/22 following a brief consolidation. Recent lows in the $271-272 coincide with its 50 DMA line ($271.52) defining important near-term support. Fundamentals remain strong.
>>> FEATURED STOCK ARTICLE : High-Ranked Solar Energy Firm Hovering Near All-Time High - 9/13/2022 |
View all notes |
Set NEW NOTE alert |
Company Profile |
SEC
News |
Chart |
Request a new note
C
A
S
I |
Symbol/Exchange
Company Name
Industry Group |
PRICE |
CHANGE
(%Change) |
Day High |
Volume
(% DAV)
(% 50 day avg vol) |
52 Wk Hi
% From Hi |
Featured
Date |
Price
Featured |
Pivot Featured |
|
Max Buy |
PWR
-
NYSE
Quanta Services Inc
MATERIALS and CONSTRUCTION - General Contractors
|
$137.42
|
-1.46
-1.05% |
$138.52
|
3,607,962
349.95% of 50 DAV
50 DAV is 1,031,000
|
$149.33
-7.98%
|
7/28/2022
|
$141.83
|
PP = $140.14
|
|
MB = $147.15
|
Most Recent Note - 9/16/2022 6:34:41 PM
G - Color code is changed to green after slumping below its 50 DMA line ($138.44) with volume-driven losses this week raising concerns. Fundamentals remain strong.
>>> FEATURED STOCK ARTICLE : Consolidating Near Prior Highs and Above 50-Day Moving Average - 9/7/2022 |
View all notes |
Set NEW NOTE alert |
Company Profile |
SEC
News |
Chart |
Request a new note
C
A
S
I |
GFF
-
NYSE
Griffon Corporation
MATERIALS and CONSTRUCTION - General Building Materials
|
$31.75
|
-1.02
-3.11% |
$32.33
|
670,380
180.70% of 50 DAV
50 DAV is 371,000
|
$34.92
-9.08%
|
8/8/2022
|
$32.46
|
PP = $31.12
|
|
MB = $32.68
|
Most Recent Note - 9/16/2022 2:48:26 PM
Y - Retreating from its all-time high, slumping this week toward its 50 DMA line ($30.64) and prior low in the $30 area which define important near-term support.
>>> FEATURED STOCK ARTICLE : Griffon Near All-Time High Making Limited Progress - 9/15/2022 |
View all notes |
Set NEW NOTE alert |
Company Profile |
SEC
News |
Chart |
Request a new note
C
A
S
I |
CLH
-
NYSE
Clean Harbors Inc
Pollution Control
|
$115.99
|
-4.32
-3.59% |
$118.67
|
839,543
247.65% of 50 DAV
50 DAV is 339,000
|
$124.49
-6.83%
|
8/10/2022
|
$111.78
|
PP = $115.10
|
|
MB = $120.86
|
Most Recent Note - 9/16/2022 2:44:27 PM
G - Retreating from its all-time high with today's 3rd volume-driven loss in the span of 4 sessions, testing the prior high in the $115 area noted as important near-term support to watch. Fundamentals remain strong.
>>> FEATURED STOCK ARTICLE : Quietly Consolidating Below "Max Buy" Level After Breakout - 8/29/2022 |
View all notes |
Set NEW NOTE alert |
Company Profile |
SEC
News |
Chart |
Request a new note
C
A
S
I |
CASY
-
NASDAQ
Caseys General Stores
RETAIL - Super/Mini Markets
|
$214.90
|
+0.24
0.11% |
$215.73
|
300,586
119.28% of 50 DAV
50 DAV is 252,000
|
$223.90
-4.02%
|
9/8/2022
|
$217.81
|
PP = $222.40
|
|
MB = $233.52
|
Most Recent Note - 9/16/2022 6:38:32 PM
Y - Stubbornly holding its ground. Failed to close above the pivot point and clinch a proper technical buy signal since Featured on 9/08/22. Fundamentals remain strong.
>>> FEATURED STOCK ARTICLE : Casey's is Perched Within Close Range of All-Time High - 9/9/2022 |
View all notes |
Set NEW NOTE alert |
Company Profile |
SEC
News |
Chart |
Request a new note
C
A
S
I |
CPRX
-
NASDAQ
Catalyst Pharma Inc
Medical-Biomed/Biotech
|
$13.41
|
-0.21
-1.54% |
$13.63
|
7,887,768
226.53% of 50 DAV
50 DAV is 3,482,000
|
$17.22
-22.13%
|
9/8/2022
|
$15.14
|
PP = $15.17
|
|
MB = $15.93
|
Most Recent Note - 9/16/2022 6:36:33 PM
G - Abruptly retreated from its high with 2 volume-driven losses, quickly erasing recent gains and slumping back below the pivot point raising concerns. Its 50 DMA line ($12.08) defines near-term support to watch. Highlighted in yellow with pivot point cited based on its 8/23/22 high plus 10 cents in the 9/08/22 mid-day report. Reported Jun '22 quarterly earnings +75% on +46% sales revenues versus the year ago period, its 3rd consecutive quarterly comparison above the +25% minimum earnings guideline (C criteria). Annual earnings (A criteria) growth has been strong since turning profitable in FY '19.
>>> FEATURED STOCK ARTICLE : Hit a New High After a 4-Week Tight Pattern of Closes - 9/8/2022 |
View all notes |
Set NEW NOTE alert |
Company Profile |
SEC
News |
Chart |
Request a new note
C
A
S
I |
Symbol/Exchange
Company Name
Industry Group |
PRICE |
CHANGE
(%Change) |
Day High |
Volume
(% DAV)
(% 50 day avg vol) |
52 Wk Hi
% From Hi |
Featured
Date |
Price
Featured |
Pivot Featured |
|
Max Buy |
CCRN
-
NASDAQ
Cross Country Healthcare
DIVERSIFIED SERVICES - Staffing and Outsourcing Service
|
$29.62
|
+0.33
1.13% |
$29.73
|
977,650
108.87% of 50 DAV
50 DAV is 898,000
|
$30.51
-2.92%
|
9/9/2022
|
$27.32
|
PP = $30.61
|
|
MB = $32.14
|
Most Recent Note - 9/16/2022 6:40:30 PM
Y - Posted a 3rd consecutive gain today while challenging prior highs in the $30 area. The market is in a correction (M criteria) and disciplined investors know to avoid new buying efforts until a new rally confirmed with a follow-through day. It has been consolidating above its 50 DMA line ($25.51) which defines important support to watch. Recently reported insider buying is a reassuring sign. Highlighted in yellow with pivot point cited based on its 7/21/22 high plus 10 cents in the 9/09/22 mid-day report and noted - "Subsequent gains above the pivot point backed by at least +40% above average volume may trigger a technical buy signal."
>>> FEATURED STOCK ARTICLE : Positive Reversal While Consolidating Above 50-Day Moving Average - 9/12/2022 |
View all notes |
Set NEW NOTE alert |
Company Profile |
SEC
News |
Chart |
Request a new note
C
A
S
I |
|
|
|
THESE ARE NOT BUY RECOMMENDATIONS!
Comments contained in the body of this report are technical
opinions only. The material herein has been obtained
from sources believed to be reliable and accurate, however,
its accuracy and completeness cannot be guaranteed.
This site is not an investment advisor, hence it does
not endorse or recommend any securities or other investments.
Any recommendation contained in this report may not
be suitable for all investors and it is not to be deemed
an offer or solicitation on our part with respect to
the purchase or sale of any securities. All trademarks,
service marks and trade names appearing in this report
are the property of their respective owners, and are
likewise used for identification purposes only.
This report is a service available
only to active Paid Premium Members.
You may opt-out of receiving report notifications
at any time. Questions or comments may be submitted
by writing to Premium Membership Services 665 S.E. 10 Street, Suite 201 Deerfield Beach, FL 33441-5634 or by calling 1-800-965-8307
or 954-785-1121.
|
|
|