You are not logged in.
This means you
CAN ONLY VIEW reports that were published prior to Thursday, April 10, 2025.
You
MUST UPGRADE YOUR MEMBERSHIP if you want to see any current reports.
AFTER MARKET UPDATE - TUESDAY, SEPTEMBER 20TH, 2022
Previous After Market Report Next After Market Report >>>
|
|
|
|
DOW |
-313.45 |
30,706.23 |
-1.01% |
|
Volume |
897,789,742 |
-2% |
|
Volume |
4,009,095,900 |
-3% |
|
NASDAQ |
-109.97 |
11,425.05 |
-0.95% |
|
Advancers |
518 |
17% |
|
Advancers |
1,247 |
28% |
|
S&P 500 |
-43.96 |
3,855.93 |
-1.13% |
|
Decliners |
2,570 |
83% |
|
Decliners |
3,160 |
72% |
|
Russell 2000 |
-25.34 |
1,787.50 |
-1.40% |
|
52 Wk Highs |
13 |
|
|
52 Wk Highs |
29 |
|
|
S&P 600 |
-14.35 |
1,142.29 |
-1.24% |
|
52 Wk Lows |
395 |
|
|
52 Wk Lows |
565 |
|
|
The market (M criteria) is in a correction. A caution flag has been raised by the technical damage in the major indices coupled with a shrinking list of stocks hitting new highs. Disciplined investors know to raise cash by selling weakening stocks on a case-by-case basis, and to protect that cash by avoiding any new buys until a new rally is confirmed with a follow-through day.
|
 |
Correction Continues as Major Averages Slump Toward June Lows
Kenneth J. Gruneisen - Passed the CAN SLIM® Master's Exam
The Dow lost 313 points, while the Nasdaq Composite shed 1%. The S&P 500 finished 1.1% lower with all sectors in negative territory. The recent slide in the S&P 500 has pushed it down more than 10% from its high on August 16, which was the peak of its summer rally. The volume totals reported were lighter than the prior session on the NYSE and on the Nasdaq exchange. Breadth was negative as decliners led advancers by almost a 5-1 margin on the NYSE and by nearly 3-1 on the Nasdaq exchange. Leadership remained thin as there was 1 high-ranked company from the Leaders List that hit a new 52-week high and was listed on the BreakOuts Page, matching the total of 1 on the prior session. New 52-week lows totals again solidly outnumbered new 52-week highs on both the NYSE and the Nasdaq exchange. The market is now in a correction (M criteria).
Chart courtesy of www.stockcharts.com%20on%20Tuesday.%20Yesterday,%20the%20broad%20benchmark%20eclipsed%20the%204,300%20level%20for%20the%20first%20time%20since%20late%20April.%20The%20Nasdaq%20Composite%20fell%201.3%%20amid%20weakness%20in%20mega-cap%20tech%20shares.%20The%20volume%20totals%20reported%20were%20mixed,%20lighter%20than%20the%20prior%20session%20on%20the%20NYSE%20and%20higher%20on%20the%20Nasdaq%20exchange.%20Decliners%20led%20advancers%20by%20a%204-1%20margin%20on%20the%20NYSE%20ad%20by%20a%203-1%20margin%20on%20the%20Nasdaq%20exchange.%20There%20were%2017%20high-ranked%20companies%20from%20the%20Leaders%20List%20that%20hit%20new%2052-week%20highs%20and%20were%20listed%20on%20the%20BreakOuts%20Page,%20down%20from%20the%20total%20of%2045%20on%20the%20prior%20session.%20New%2052-week%20highs%20outnumbered%20new%2052-week%20lows%20on%20the%20NYSE,%20but%20new%20lows%20outnumbered%20new%20highs%20on%20the%20Nasdaq%20exchange.%20The%20market%20is%20in%20a%20confirmed%20uptrend%20(M%20criteria).%20Any%20sustainable%20rally%20requires%20a%20healthy%20crop%20of%20leading%20stocks%20hitting%20new%20highs,%20so%20the%20recent%20improvement%20in%20leadership%20was%20a%20reassuring%20sign.) 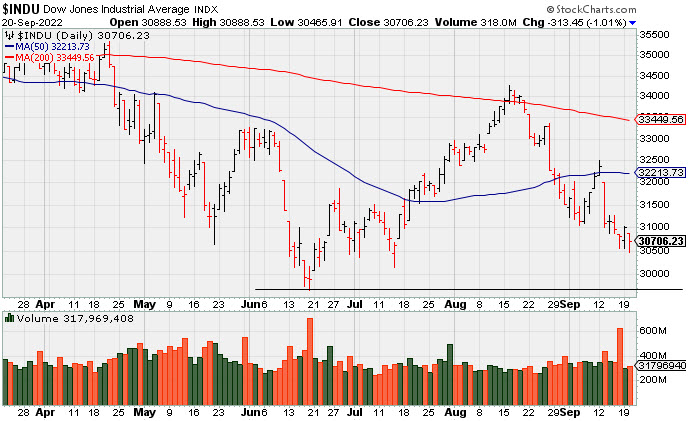 PICTURED: The Dow Jones Industrial Average fell with slightly higher volume. It recently slumped back below its 50-day moving average (DMA) line toward the June low.
U.S. equities finished lower Tuesday as investors braced for another aggressive rate hike from the Federal Reserve (Fed). Treasuries weakened along the curve, adding to turmoil in equities, as the Fed meeting came into focus. The yield on the benchmark 10-year note added seven basis points (0.07%) to 3.56% after touching 3.59% earlier in the session, its highest level since 2011. The yield on the 30-year bond climbed six basis points (0.06%) to 3.57%. The more policy-sensitive two-year note advanced one basis point (0.01%) to 3.95% after notching a fresh 15-year high of 3.98%. In commodities, West Texas Intermediate (WTI) crude fell 1.5% to $84.45/barrel amid concerns about weakening fuel demand. A gauge of the U.S. dollar gained 0.4%, further pressuring oil prices.
On the data front, housing starts climbed 12.2% month-over-month in August, far exceeding the estimated 0.3% increase, and up from July’s downwardly revised 10.9% decline. The increase is the biggest jump since March 2021. Meanwhile, building permits slowed more than expected in August, notching a 10% monthly drop and their biggest decline since April 2020. In corporate news, Ford Motor Co. declined 12.3% after the company announced a reduction in earnings expectations due to a supply shortage in vehicle parts that is forecasted to add approximately $1 billion in costs. |
 Kenneth J. Gruneisen started out as a licensed stockbroker in August 1987, a couple of months prior to the historic stock market crash that took the Dow Jones Industrial Average down -22.6% in a single day. He has published daily fact-based fundamental and technical analysis on high-ranked stocks online for two decades. Through FACTBASEDINVESTING.COM, Kenneth provides educational articles, news, market commentary, and other information regarding proven investment systems that work in good times and bad.
Comments contained in the body of this report are technical opinions only and are not necessarily those of Gruneisen Growth Corp. The material herein has been obtained from sources believed to be reliable and accurate, however, its accuracy and completeness cannot be guaranteed. Our firm, employees, and customers may effect transactions, including transactions contrary to any recommendation herein, or have positions in the securities mentioned herein or options with respect thereto. Any recommendation contained in this report may not be suitable for all investors and it is not to be deemed an offer or solicitation on our part with respect to the purchase or sale of any securities. |
|
 |
Financial, Retail, Tech, and Commodity-Linked Groups Fell
Kenneth J. Gruneisen - Passed the CAN SLIM® Master's Exam
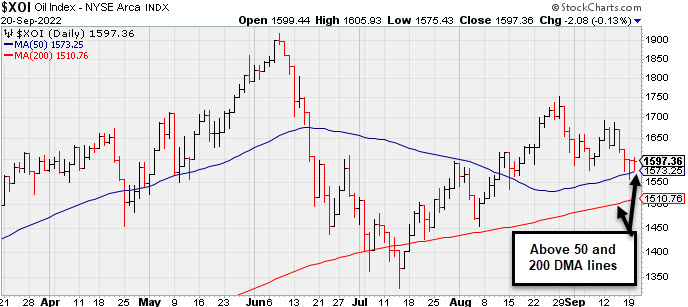
The Bank Index ($BKX -1.50%), Broker/Dealer Index ($XBD -1.26%), and Retail Index ($RLX -1.97%) suffered unanimous losses that weighed on the major market averages. The tech sector was led lower by the Semiconductor Index ($SOX -1.49%) and Networking Index ($NWX -1.59%), meanwhile the Biotech Index ($BTK -0.77%) suffered a smaller loss. The Gold & Silver Index ($XAU -2.64%) and Oil Services Index ($OSX -2.46%) both suffered large losses while the Integrated Oil Index ($XOI -0.13%) did a better job of holding its ground.
PICTURED: The Integrated Oil Index ($XOI -0.13%) is consolidating above its 50-day and 200-day moving average (DMA) lines.
| Oil Services |
$OSX |
64.89 |
-1.63 |
-2.46% |
+23.08% |
| Integrated Oil |
$XOI |
1,597.36 |
-2.08 |
-0.13% |
+35.58% |
| Semiconductor |
$SOX |
2,539.50 |
-38.45 |
-1.49% |
-35.65% |
| Networking |
$NWX |
765.39 |
-12.35 |
-1.59% |
-21.18% |
| Broker/Dealer |
$XBD |
437.49 |
-5.59 |
-1.26% |
-10.14% |
| Retail |
$RLX |
3,129.62 |
-63.02 |
-1.97% |
-25.95% |
| Gold & Silver |
$XAU |
99.72 |
-2.70 |
-2.64% |
-24.71% |
| Bank |
$BKX |
105.68 |
-1.61 |
-1.50% |
-20.08% |
| Biotech |
$BTK |
4,692.83 |
-36.59 |
-0.77% |
-14.96% |
|
|
|
 |
Thinly-Traded Esquire Still Perched Near High
Kenneth J. Gruneisen - Passed the CAN SLIM® Master's Exam
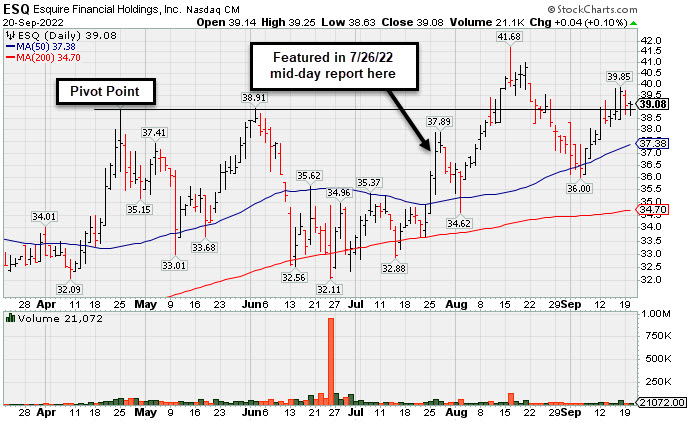
Esquire Financial Hldgs (ESQ +$0.04 or +0.10% to $39.08) made steady progress after recently finding support near its 50-day moving average (DMA) line ($37.38). The recent gains back above the pivot point were a reassuring sign of fresh institutional buying. Members have been reminded in recent market commentaries regarding the fact-based investment system's rules - "The market is in a correction (M criteria) and disciplined investors know to avoid new buying efforts until a new rally confirmed with a follow-through day."
ESQ was highlighted in yellow in the 7/26/22 mid-day report (read here) with pivot point cited based on its 4/25/22 high plus 10 cents. It was last shown in this FSU section on 9/1/22 with an annotated graph under the headline, "Testing 50-Day Moving Average With 5th Straight Loss". This thinly-traded holding company in the Finance - Commercial Loans industry group has a small supply (S criteria) of only 6.5 million shares in the public float, which can contribute to greater price volatility in the event of institutional buying or selling. It completed its $14 IPO on 6/29/17. The number of top-rated funds owning its shares rose form 64 in Sep '21 to 138 in Jun '22, a reassuring sign concerning the I criteria. Its current Up/Down Volume Ratio of 1.1 is an unbiased indication its shares have been under slight accumulation over the past 50 days.
ESQ has a 97 Earnings Per Share Rating. It reported earnings +37% on +23% sales revenues for the Jun '22 quarter versus the year-ago period, the 4th consecutive quarterly comparison with an earnings increase above the +25% minimum guideline. Its annual earnings growth (A criteria) history has been strong.
|
|
|
Color Codes Explained :
Y - Better candidates highlighted by our
staff of experts.
G - Previously featured
in past reports as yellow but may no longer be buyable under the
guidelines.
***Last / Change / Volume data in this table is the closing quote data***
Symbol/Exchange
Company Name
Industry Group |
PRICE |
CHANGE
(%Change) |
Day High |
Volume
(% DAV)
(% 50 day avg vol) |
52 Wk Hi
% From Hi |
Featured
Date |
Price
Featured |
Pivot Featured |
|
Max Buy |
 CI
-
NYSE
CI
-
NYSE
Cigna Corp
Medical-Managed Care
|
$288.08
|
-1.24
-0.43% |
$290.39
|
1,549,202
79.90% of 50 DAV
50 DAV is 1,939,000
|
$296.29
-2.77%
|
7/7/2022
|
$276.55
|
PP = $273.68
|
|
MB = $287.36
|
Most Recent Note - 9/16/2022 6:14:05 PM
G - Found support above its 50 DMA line ($282) while consolidating near its all-time high hit this week. Reported earnings for the Jun '22 quarter rose +19% on +5% sales revenues versus the year ago period, breaking a streak of 3 quarterly earnings increases above the +25% minimum guideline (C criteria), raising fundamental concerns. See the latest FSU for more detailed analysis and a new annotated graph.
>>> FEATURED STOCK ARTICLE : Found Support Above 50-Day Moving Average Line This Week - 9/16/2022 |
View all notes |
Set NEW NOTE alert |
Company Profile |
SEC
News |
Chart |
Request a new note
C
A
S
I |
ESQ
-
NASDAQ
Esquire Financial Holdings
Finance-Commercial Loans
|
$39.08
|
+0.04
0.10% |
$39.25
|
21,072
78.63% of 50 DAV
50 DAV is 26,800
|
$41.68
-6.24%
|
7/26/2022
|
$37.74
|
PP = $39.19
|
|
MB = $41.15
|
 Most Recent Note - 9/20/2022 5:35:50 PM
Y - Making gradual progress after recently finding support near its 50 DMA line ($37.38). Gains back above the pivot point were a reassuring sign of fresh institutional buying. The market is in a correction (M criteria) and disciplined investors know to avoid new buying efforts until a new rally confirmed with a follow-through day. See the latest FSU analysis for more details and a new annotated graph.
>>> FEATURED STOCK ARTICLE : Thinly-Traded Esquire Still Perched Near High - 9/20/2022 |
View all notes |
Set NEW NOTE alert |
Company Profile |
SEC
News |
Chart |
Request a new note
C
A
S
I |
GPK
-
NYSE
Graphic Packaging Hldg
CONSUMER NON-DURABLES - Packaging and Containers
|
$21.25
|
-0.68
-3.10% |
$21.69
|
2,985,643
106.71% of 50 DAV
50 DAV is 2,798,000
|
$24.07
-11.72%
|
7/26/2022
|
$22.63
|
PP = $23.09
|
|
MB = $24.24
|
Most Recent Note - 9/20/2022 5:43:23 PM
Today's loss took it further below its 50 DMA line ($22.35) after a noted big loss on 9/16/22 triggered a technical sell signal. A rebound above its 50 DMA line is needed for its outlook to improve. It will be dropped from the Featured Stocks list tonight.
>>> FEATURED STOCK ARTICLE : Recently Slipped Below Pivot Point Testing 50-Day Average - 9/6/2022 |
View all notes |
Set NEW NOTE alert |
Company Profile |
SEC
News |
Chart |
Request a new note
C
A
S
I |
CSL
-
NYSE
Carlisle Cos Inc
Diversified Operations
|
$289.59
|
-7.03
-2.37% |
$295.02
|
848,986
174.69% of 50 DAV
50 DAV is 486,000
|
$318.71
-9.14%
|
7/28/2022
|
$282.31
|
PP = $275.23
|
|
MB = $288.99
|
Most Recent Note - 9/20/2022 5:38:21 PM
G - Loss today undercut the prior low $291 and violated its 50 DMA line ($292.59) raising greater concerns and triggering a technical sell signal. Only a prompt rebound above the 50 DMA line would help its outlook improve.
>>> FEATURED STOCK ARTICLE : Consolidating Near High Well Above 50-Day Moving Average - 9/14/2022 |
View all notes |
Set NEW NOTE alert |
Company Profile |
SEC
News |
Chart |
Request a new note
C
A
S
I |
ENPH
-
NASDAQ
Enphase Energy Inc
Energy-Solar
|
$304.71
|
-11.52
-3.64% |
$317.28
|
2,619,401
71.61% of 50 DAV
50 DAV is 3,658,000
|
$324.84
-6.20%
|
7/28/2022
|
$276.66
|
PP = $282.55
|
|
MB = $296.68
|
Most Recent Note - 9/20/2022 5:40:14 PM
G - Pulled back today with lighter than average volume, still hovering near its all-time high. Its 50 DMA line ($275.49) and recent lows in the $271-272 area define important near-term support. Fundamentals remain strong.
>>> FEATURED STOCK ARTICLE : High-Ranked Solar Energy Firm Hovering Near All-Time High - 9/13/2022 |
View all notes |
Set NEW NOTE alert |
Company Profile |
SEC
News |
Chart |
Request a new note
C
A
S
I |
Symbol/Exchange
Company Name
Industry Group |
PRICE |
CHANGE
(%Change) |
Day High |
Volume
(% DAV)
(% 50 day avg vol) |
52 Wk Hi
% From Hi |
Featured
Date |
Price
Featured |
Pivot Featured |
|
Max Buy |
PWR
-
NYSE
Quanta Services Inc
MATERIALS and CONSTRUCTION - General Contractors
|
$138.57
|
-2.71
-1.92% |
$140.90
|
1,267,838
115.15% of 50 DAV
50 DAV is 1,101,000
|
$149.33
-7.21%
|
7/28/2022
|
$141.83
|
PP = $140.14
|
|
MB = $147.15
|
Most Recent Note - 9/19/2022 5:57:45 PM
Y - Color code is changed to yellow after rebounding above its 50 DMA line ($138.63) with a volume-driven gain helping its outlook improve. Fundamentals remain strong.
>>> FEATURED STOCK ARTICLE : Consolidating Near Prior Highs and Above 50-Day Moving Average - 9/7/2022 |
View all notes |
Set NEW NOTE alert |
Company Profile |
SEC
News |
Chart |
Request a new note
C
A
S
I |
GFF
-
NYSE
Griffon Corporation
MATERIALS and CONSTRUCTION - General Building Materials
|
$31.85
|
-0.72
-2.21% |
$32.18
|
357,932
95.70% of 50 DAV
50 DAV is 374,000
|
$34.92
-8.79%
|
8/8/2022
|
$32.46
|
PP = $31.12
|
|
MB = $32.68
|
Most Recent Note - 9/19/2022 5:54:25 PM
Y - Consolidating above its 50 DMA line ($30.78) and prior low in the $30 area which define important near-term support.
>>> FEATURED STOCK ARTICLE : Griffon Near All-Time High Making Limited Progress - 9/15/2022 |
View all notes |
Set NEW NOTE alert |
Company Profile |
SEC
News |
Chart |
Request a new note
C
A
S
I |
CLH
-
NYSE
Clean Harbors Inc
Pollution Control
|
$116.55
|
-1.54
-1.30% |
$117.92
|
343,228
97.51% of 50 DAV
50 DAV is 352,000
|
$124.49
-6.38%
|
8/10/2022
|
$111.78
|
PP = $115.10
|
|
MB = $120.86
|
Most Recent Note - 9/19/2022 5:51:59 PM
Y - Color code is changed to yellow after consolidating below its "max buy" level and recently testing the prior high in the $115 area noted as important near-term support to watch. More damaging losses would raise concerns. Fundamentals remain strong. See the latest FSU analysis for more details and a new annotated graph.
>>> FEATURED STOCK ARTICLE : Tested Support Near Prior High in the $115 Area - 9/19/2022 |
View all notes |
Set NEW NOTE alert |
Company Profile |
SEC
News |
Chart |
Request a new note
C
A
S
I |
CASY
-
NASDAQ
Caseys General Stores
RETAIL - Super/Mini Markets
|
$213.66
|
-2.76
-1.28% |
$216.13
|
149,657
59.62% of 50 DAV
50 DAV is 251,000
|
$223.90
-4.57%
|
9/8/2022
|
$217.81
|
PP = $222.40
|
|
MB = $233.52
|
Most Recent Note - 9/16/2022 6:38:32 PM
Y - Stubbornly holding its ground. Failed to close above the pivot point and clinch a proper technical buy signal since Featured on 9/08/22. Fundamentals remain strong.
>>> FEATURED STOCK ARTICLE : Casey's is Perched Within Close Range of All-Time High - 9/9/2022 |
View all notes |
Set NEW NOTE alert |
Company Profile |
SEC
News |
Chart |
Request a new note
C
A
S
I |
CPRX
-
NASDAQ
Catalyst Pharma Inc
Medical-Biomed/Biotech
|
$12.80
|
-0.17
-1.31% |
$13.00
|
2,591,153
70.80% of 50 DAV
50 DAV is 3,660,000
|
$17.22
-25.67%
|
9/8/2022
|
$15.14
|
PP = $15.17
|
|
MB = $15.93
|
Most Recent Note - 9/19/2022 5:53:31 PM
G - Abruptly retreated from its high with 3 consecutive losses, quickly erasing recent gains and slumping back below the pivot point raising concerns. Its 50 DMA line ($12.19) defines near-term support to watch. Highlighted in yellow with pivot point cited based on its 8/23/22 high plus 10 cents in the 9/08/22 mid-day report. Reported Jun '22 quarterly earnings +75% on +46% sales revenues versus the year ago period, its 3rd consecutive quarterly comparison above the +25% minimum earnings guideline (C criteria). Annual earnings (A criteria) growth has been strong since turning profitable in FY '19.
>>> FEATURED STOCK ARTICLE : Hit a New High After a 4-Week Tight Pattern of Closes - 9/8/2022 |
View all notes |
Set NEW NOTE alert |
Company Profile |
SEC
News |
Chart |
Request a new note
C
A
S
I |
Symbol/Exchange
Company Name
Industry Group |
PRICE |
CHANGE
(%Change) |
Day High |
Volume
(% DAV)
(% 50 day avg vol) |
52 Wk Hi
% From Hi |
Featured
Date |
Price
Featured |
Pivot Featured |
|
Max Buy |
CCRN
-
NASDAQ
Cross Country Healthcare
DIVERSIFIED SERVICES - Staffing and Outsourcing Service
|
$29.58
|
-0.02
-0.07% |
$29.70
|
607,869
66.29% of 50 DAV
50 DAV is 917,000
|
$30.51
-3.05%
|
9/9/2022
|
$27.32
|
PP = $30.61
|
|
MB = $32.14
|
Most Recent Note - 9/16/2022 6:40:30 PM
Y - Posted a 3rd consecutive gain today while challenging prior highs in the $30 area. The market is in a correction (M criteria) and disciplined investors know to avoid new buying efforts until a new rally confirmed with a follow-through day. It has been consolidating above its 50 DMA line ($25.51) which defines important support to watch. Recently reported insider buying is a reassuring sign. Highlighted in yellow with pivot point cited based on its 7/21/22 high plus 10 cents in the 9/09/22 mid-day report and noted - "Subsequent gains above the pivot point backed by at least +40% above average volume may trigger a technical buy signal."
>>> FEATURED STOCK ARTICLE : Positive Reversal While Consolidating Above 50-Day Moving Average - 9/12/2022 |
View all notes |
Set NEW NOTE alert |
Company Profile |
SEC
News |
Chart |
Request a new note
C
A
S
I |
|
|
|
THESE ARE NOT BUY RECOMMENDATIONS!
Comments contained in the body of this report are technical
opinions only. The material herein has been obtained
from sources believed to be reliable and accurate, however,
its accuracy and completeness cannot be guaranteed.
This site is not an investment advisor, hence it does
not endorse or recommend any securities or other investments.
Any recommendation contained in this report may not
be suitable for all investors and it is not to be deemed
an offer or solicitation on our part with respect to
the purchase or sale of any securities. All trademarks,
service marks and trade names appearing in this report
are the property of their respective owners, and are
likewise used for identification purposes only.
This report is a service available
only to active Paid Premium Members.
You may opt-out of receiving report notifications
at any time. Questions or comments may be submitted
by writing to Premium Membership Services 665 S.E. 10 Street, Suite 201 Deerfield Beach, FL 33441-5634 or by calling 1-800-965-8307
or 954-785-1121.
|
|
|