You are not logged in.
This means you
CAN ONLY VIEW reports that were published prior to Monday, March 24, 2025.
You
MUST UPGRADE YOUR MEMBERSHIP if you want to see any current reports.
AFTER MARKET UPDATE - FRIDAY, SEPTEMBER 9TH, 2022
Previous After Market Report Next After Market Report >>>
|
|
|
|
DOW |
+377.19 |
32,151.71 |
+1.19% |
|
Volume |
823,106,532 |
-4% |
|
Volume |
4,374,069,400 |
+1% |
|
NASDAQ |
+250.18 |
12,112.31 |
+2.11% |
|
Advancers |
2,588 |
83% |
|
Advancers |
2,934 |
69% |
|
S&P 500 |
+61.18 |
4,067.36 |
+1.53% |
|
Decliners |
515 |
17% |
|
Decliners |
1,345 |
31% |
|
Russell 2000 |
+35.94 |
1,882.85 |
+1.95% |
|
52 Wk Highs |
36 |
|
|
52 Wk Highs |
48 |
|
|
S&P 600 |
+22.35 |
1,193.69 |
+1.91% |
|
52 Wk Lows |
29 |
|
|
52 Wk Lows |
95 |
|
|
 |
Breadth Positive as Leadership Improved Behind Market Bounce
Kenneth J. Gruneisen - Passed the CAN SLIM® Master's Exam
The Dow added 377 points, while the Nasdaq Composite rallied 2.1%, ending the week 2.7% and 4.1% higher, respectively. The S&P 500 jumped 1.5% to notch a 3.7% weekly increase. The volume totals reported were mixed, lighter than the prior session on the NYSE and higher on the Nasdaq exchange. Breadth was clearly positive as advancers led decliners by a 5-1 margin on the NYSE and by more than 2-1 on the Nasdaq exchange. Leadership improved as there were 15 high-ranked companies from the Leaders List that hit new 52-week highs and were listed on the BreakOuts Page, versus the total of 8 on the prior session. New 52-week highs also outnumbered new 52-week lows on the NYSE, however, new lows still outnumbered new highs on the Nasdaq exchange. The market uptrend is now under pressure (M criteria). Any sustainable rally requires a healthy crop of leading stocks hitting new highs.
Chart courtesy of www.stockcharts.com%20on%20Tuesday.%20Yesterday,%20the%20broad%20benchmark%20eclipsed%20the%204,300%20level%20for%20the%20first%20time%20since%20late%20April.%20The%20Nasdaq%20Composite%20fell%201.3%%20amid%20weakness%20in%20mega-cap%20tech%20shares.%20The%20volume%20totals%20reported%20were%20mixed,%20lighter%20than%20the%20prior%20session%20on%20the%20NYSE%20and%20higher%20on%20the%20Nasdaq%20exchange.%20Decliners%20led%20advancers%20by%20a%204-1%20margin%20on%20the%20NYSE%20ad%20by%20a%203-1%20margin%20on%20the%20Nasdaq%20exchange.%20There%20were%2017%20high-ranked%20companies%20from%20the%20Leaders%20List%20that%20hit%20new%2052-week%20highs%20and%20were%20listed%20on%20the%20BreakOuts%20Page,%20down%20from%20the%20total%20of%2045%20on%20the%20prior%20session.%20New%2052-week%20highs%20outnumbered%20new%2052-week%20lows%20on%20the%20NYSE,%20but%20new%20lows%20outnumbered%20new%20highs%20on%20the%20Nasdaq%20exchange.%20The%20market%20is%20in%20a%20confirmed%20uptrend%20(M%20criteria).%20Any%20sustainable%20rally%20requires%20a%20healthy%20crop%20of%20leading%20stocks%20hitting%20new%20highs,%20so%20the%20recent%20improvement%20in%20leadership%20was%20a%20reassuring%20sign.) 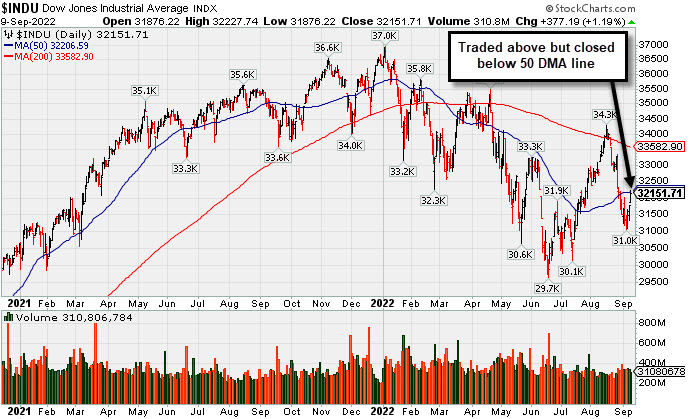 PICTURED: The Dow Jones Industrial Average traded above its 50-day moving average (DMA) line on Friday but closed below that important short-term average. The recent low defines near-term support where a violation would raise greater concerns of a more serious market correction.
U.S. equities finished higher on Friday, snapping a three-week losing streak. A perceived risk-on mood took hold despite hawkish remarks from Federal Reserve (Fed) officials and a record rate hike from the European Central Bank (ECB). All S&P 500 sectors ended in positive territory, with Communication Services pacing gains.
Oversold conditions, along with depressed sentiment and positioning indicators have been widely cited as factors contributing to this week’s bounce in stocks. Still, coordinated moves by major central banks to curb elevated inflation with higher interest rates continue to cloud the global economic outlook. Today saw the last round of commentary from Fed officials before they enter a media blackout period ahead of their September 20-21 policy meeting. Among them, Kansas City Fed President Esther George reiterated the central bank’s commitment to continue hiking rates to combat inflation.
Treasuries weakened, with the yield on the benchmark 10-year note up one basis point (0.01%) to 3.32%. The yield on the more Fed-sensitive two-year note added six basis points (0.06%) to 3.56%, its highest level since 2007. In commodities, West Texas Intermediate (WTI) crude climbed 3.3% to $86.34/barrel, nearly erasing its weekly loss. Oil prices have been whipsawed in recent days as market participants weigh tight supply conditions against weakening demand prospects related to COVID-19 lockdowns in China. A pullback in U.S. dollar strength helped buoy oil prices, with the greenback breaking a three-week winning stretch.
|
 Kenneth J. Gruneisen started out as a licensed stockbroker in August 1987, a couple of months prior to the historic stock market crash that took the Dow Jones Industrial Average down -22.6% in a single day. He has published daily fact-based fundamental and technical analysis on high-ranked stocks online for two decades. Through FACTBASEDINVESTING.COM, Kenneth provides educational articles, news, market commentary, and other information regarding proven investment systems that work in good times and bad.
Comments contained in the body of this report are technical opinions only and are not necessarily those of Gruneisen Growth Corp. The material herein has been obtained from sources believed to be reliable and accurate, however, its accuracy and completeness cannot be guaranteed. Our firm, employees, and customers may effect transactions, including transactions contrary to any recommendation herein, or have positions in the securities mentioned herein or options with respect thereto. Any recommendation contained in this report may not be suitable for all investors and it is not to be deemed an offer or solicitation on our part with respect to the purchase or sale of any securities. |
|
 |
Commodity-Linked Groups Led Tech, Retail, and Financials Higher
Kenneth J. Gruneisen - Passed the CAN SLIM® Master's Exam
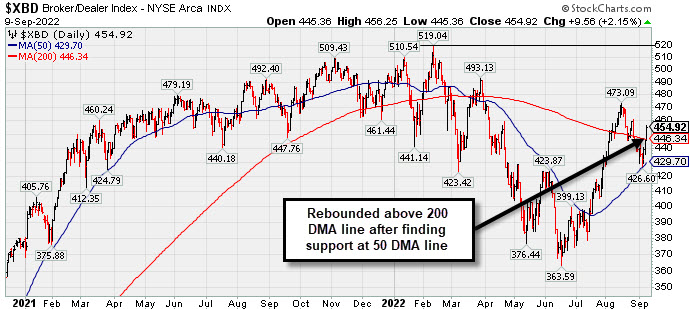
Commodity-linked groups were standout gainers on Friday as the Oil Services Index ($OSX +4.39%), Integrated Oil Index ($XOI +2.36%), and Gold & Silver Index ($XAU +2.87%) each posted a solid gain. The Semiconductor Index ($SOX +2.39%) led the tech sector higher while the Networking Index ($NWX +1.47%) and Biotech Index ($BTK +1.09%) also notched decent gains. The Broker/Dealer Index ($XBD +2.15%), Bank Index ($BKX +0.85%), and Retail Index ($RLX +1.61%) each posted gains, rounding out the widely positive session.
PICTURED: The Broker/Dealer Index ($XBD +2.15%) rebounded back above its 200-day moving average (DMA) line after recently finding support at its 50 DMA line.
| Oil Services |
$OSX |
70.76 |
+2.98 |
+4.39% |
+34.23% |
| Integrated Oil |
$XOI |
1,645.19 |
+37.88 |
+2.36% |
+39.64% |
| Semiconductor |
$SOX |
2,721.77 |
+63.60 |
+2.39% |
-31.03% |
| Networking |
$NWX |
818.76 |
+11.87 |
+1.47% |
-15.69% |
| Broker/Dealer |
$XBD |
454.92 |
+9.56 |
+2.15% |
-6.56% |
| Retail |
$RLX |
3,381.75 |
+53.70 |
+1.61% |
-19.99% |
| Gold & Silver |
$XAU |
105.00 |
+2.93 |
+2.87% |
-20.72% |
| Bank |
$BKX |
110.25 |
+0.93 |
+0.85% |
-16.62% |
| Biotech |
$BTK |
4,968.46 |
+53.58 |
+1.09% |
-9.97% |
|
|
|
 |
Casey's is Perched Within Close Range of All-Time High
Kenneth J. Gruneisen - Passed the CAN SLIM® Master's Exam
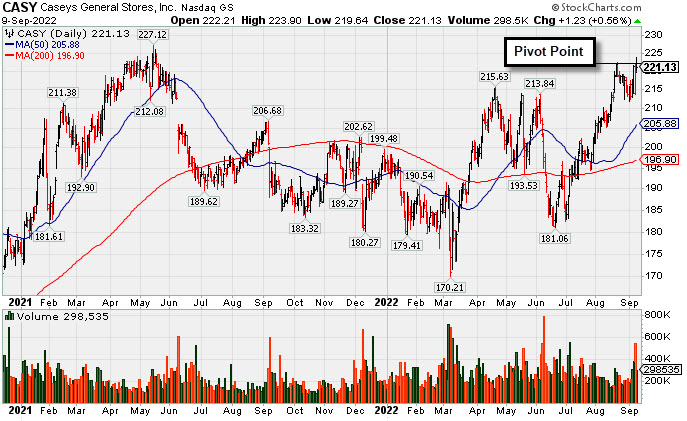
Casey's General Stores (CASY +$1.23 or +0.56% to $221.13) posted a gain but closed in the lower half of its intra-day range on Friday. It churned heavier volume on the prior session and closed with a loss after highlighted in yellow in the mid-day report (read here) with pivot point cited based on its 8/22/22 high. It is perched within close striking distance of its all-time high. Subsequent gains above the pivot point backed by at least +40% above average volume may trigger a technical buy signal. The recent low ($211.95 on 9/01/22) defines near-term support above its 50-day moving average (DMA) line.
CASY reported earnings +28% on +40% sales revenues for the Jul '22 quarter versus the year ago period, its 3rd strong quarterly comparison above the +25% minimum earnings guideline (C criteria). Its annual earnings (A criteria) history has been strong and it has an earnings Per Share Rating of 96. It hails from the RETAIL - Super/Mini Markets group which is currently ranked 6th on the 197 Industry Groups list (L criteria).
There are 37.2 million shares outstanding (S criteria) which can contribute to greater price volatility in the event of institutional buying or selling. The number of top-rated funds owning its shares rose from 565 in Mar '22 to 600 in Jun '22, a reassuring sign concerning the I criteria. Its current Up/Down Volume Ratio of 1.4 is an unbiased indication its shares have been under accumulation over the past 50 days.
|
|
|
Color Codes Explained :
Y - Better candidates highlighted by our
staff of experts.
G - Previously featured
in past reports as yellow but may no longer be buyable under the
guidelines.
***Last / Change / Volume data in this table is the closing quote data***
Symbol/Exchange
Company Name
Industry Group |
PRICE |
CHANGE
(%Change) |
Day High |
Volume
(% DAV)
(% 50 day avg vol) |
52 Wk Hi
% From Hi |
Featured
Date |
Price
Featured |
Pivot Featured |
|
Max Buy |
 CI
-
NYSE
CI
-
NYSE
Cigna Corp
Medical-Managed Care
|
$292.84
|
+2.13
0.73% |
$294.53
|
1,362,858
70.91% of 50 DAV
50 DAV is 1,922,000
|
$293.96
-0.38%
|
7/7/2022
|
$276.55
|
PP = $273.68
|
|
MB = $287.36
|
 Most Recent Note - 9/9/2022 5:32:18 PM
G - Color code is changed to green after rising back above its "max buy" level. Reported earnings for the Jun '22 quarter rose +19% on +5% sales revenues versus the year ago period, breaking a streak of 3 quarterly earnings increases above the +25% minimum guideline (C criteria), raising fundamental concerns. Near-term support to watch is at its 50 DMA line ($280).
>>> FEATURED STOCK ARTICLE : Cigna Hovering Near High Despite Earnings Under +25% Minimum - 8/26/2022 |
View all notes |
Set NEW NOTE alert |
Company Profile |
SEC
News |
Chart |
Request a new note
C
A
S
I |
AN
-
NYSE
Autonation Inc
SPECIALTY RETAIL - Auto Dealerships
|
$117.51
|
-0.07
-0.06% |
$119.20
|
848,488
123.33% of 50 DAV
50 DAV is 688,000
|
$135.57
-13.32%
|
7/20/2022
|
$122.03
|
PP = $126.49
|
|
MB = $132.81
|
Most Recent Note - 9/9/2022 5:30:14 PM
Still lingering below prior highs in the $126 area and below its 50 DMA line ($119.92) after noted losses triggering a technical sell signal. Reported Jun '22 quarterly earnings +34% on -2% sales revenues versus the year ago period. It will be dropped from the Featured Stocks list tonight.
>>> FEATURED STOCK ARTICLE : Autonation Stalled After Recent Breakout - 8/30/2022 |
View all notes |
Set NEW NOTE alert |
Company Profile |
SEC
News |
Chart |
Request a new note
C
A
S
I |
ESQ
-
NASDAQ
Esquire Financial Hldgs
Finance-Commercial Loans
|
$37.80
|
+0.45
1.20% |
$37.97
|
16,764
55.88% of 50 DAV
50 DAV is 30,000
|
$41.68
-9.31%
|
7/26/2022
|
$37.74
|
PP = $39.19
|
|
MB = $41.15
|
Most Recent Note - 9/7/2022 2:29:39 PM
Y - Finding support today near its 50 DMA line ($36.63) but it has been sputtering back below the pivot point and into the prior base. Confirming gains above the pivot point backed by at least +40% above average volume would be a reassuring sign of fresh institutional buying.
>>> FEATURED STOCK ARTICLE : Testing 50-Day Moving Average With 5th Straight Loss - 9/1/2022 |
View all notes |
Set NEW NOTE alert |
Company Profile |
SEC
News |
Chart |
Request a new note
C
A
S
I |
GPK
-
NYSE
Graphic Packaging Hldg
CONSUMER NON-DURABLES - Packaging and Containers
|
$23.31
|
+0.22
0.95% |
$23.46
|
2,270,615
80.49% of 50 DAV
50 DAV is 2,821,000
|
$23.71
-1.69%
|
7/26/2022
|
$22.63
|
PP = $23.09
|
|
MB = $24.24
|
Most Recent Note - 9/9/2022 5:27:21 PM
Y - Wedged back above its pivot point with recent gains lacking great volume conviction while consolidating above support at its 50 DMA line ($22.16).
>>> FEATURED STOCK ARTICLE : Recently Slipped Below Pivot Point Testing 50-Day Average - 9/6/2022 |
View all notes |
Set NEW NOTE alert |
Company Profile |
SEC
News |
Chart |
Request a new note
C
A
S
I |
CSL
-
NYSE
Carlisle Cos Inc
Diversified Operations
|
$308.73
|
+1.18
0.38% |
$310.75
|
303,538
65.00% of 50 DAV
50 DAV is 467,000
|
$318.71
-3.13%
|
7/28/2022
|
$282.31
|
PP = $275.23
|
|
MB = $288.99
|
Most Recent Note - 9/7/2022 2:33:18 PM
G - Still extended from the previously noted base. Consolidating well above its 50 DMA line ($282.42) and prior highs in the $275 area define important near-term support to watch.
>>> FEATURED STOCK ARTICLE : Pulling Back From All-Time High After Volume-Driven Gains - 8/22/2022 |
View all notes |
Set NEW NOTE alert |
Company Profile |
SEC
News |
Chart |
Request a new note
C
A
S
I |
Symbol/Exchange
Company Name
Industry Group |
PRICE |
CHANGE
(%Change) |
Day High |
Volume
(% DAV)
(% 50 day avg vol) |
52 Wk Hi
% From Hi |
Featured
Date |
Price
Featured |
Pivot Featured |
|
Max Buy |
ENPH
-
NASDAQ
Enphase Energy Inc
Energy-Solar
|
$305.70
|
-11.71
-3.69% |
$314.50
|
5,648,528
163.02% of 50 DAV
50 DAV is 3,465,000
|
$318.22
-3.93%
|
7/28/2022
|
$276.66
|
PP = $282.55
|
|
MB = $296.68
|
Most Recent Note - 9/9/2022 12:33:56 PM
G - Abruptly retreating today from its all-time high after 3 consecutive gains with above average volume. The prior high in the $282 area has been noted as initial support to watch above its 50 DMA line ($259.74). Fundamentals remain strong.
>>> FEATURED STOCK ARTICLE : Enphase Energy Consolidating After Rallying to New Highs - 8/19/2022 |
View all notes |
Set NEW NOTE alert |
Company Profile |
SEC
News |
Chart |
Request a new note
C
A
S
I |
PWR
-
NYSE
Quanta Services Inc
MATERIALS and CONSTRUCTION - General Contractors
|
$146.76
|
+0.15
0.10% |
$148.00
|
728,778
69.14% of 50 DAV
50 DAV is 1,054,000
|
$149.33
-1.72%
|
7/28/2022
|
$141.83
|
PP = $140.14
|
|
MB = $147.15
|
Most Recent Note - 9/8/2022 6:28:23 PM
Y - Posted a solid gain today with near average volume, wedging back up near its "max buy" level. Confirming volume-driven gains for new highs would be a reassuring sign of fresh institutional buying demand. Its 50 DMA line ($136.53) defines important near-term support to watch. Fundamentals remain strong. See the latest FSU analysis for more details and an annotated graph.
>>> FEATURED STOCK ARTICLE : Consolidating Near Prior Highs and Above 50-Day Moving Average - 9/7/2022 |
View all notes |
Set NEW NOTE alert |
Company Profile |
SEC
News |
Chart |
Request a new note
C
A
S
I |
GFF
-
NYSE
Griffon Corporation
MATERIALS and CONSTRUCTION - General Building Materials
|
$34.38
|
+0.67
1.99% |
$34.92
|
462,399
116.47% of 50 DAV
50 DAV is 397,000
|
$34.35
0.09%
|
8/8/2022
|
$32.46
|
PP = $31.12
|
|
MB = $32.68
|
Most Recent Note - 9/9/2022 5:24:21 PM
G - Hit a new all-time high with today's 3rd consecutive gain after briefly undercutting prior highs in the $31 area. Important support to watch is its 50 DMA line ($30.02).
>>> FEATURED STOCK ARTICLE : Best Ever Close With Gain on Lighter Volume - 8/25/2022 |
View all notes |
Set NEW NOTE alert |
Company Profile |
SEC
News |
Chart |
Request a new note
C
A
S
I |
CLH
-
NYSE
Clean Harbors Inc
Pollution Control
|
$122.41
|
+0.59
0.48% |
$123.34
|
379,899
118.72% of 50 DAV
50 DAV is 320,000
|
$124.33
-1.54%
|
8/10/2022
|
$111.78
|
PP = $115.10
|
|
MB = $120.86
|
Most Recent Note - 9/8/2022 6:37:06 PM
G - Color code is changed to green after today's 2nd consecutive gain lifted it back above its "max buy" level. Prior high in the $115 area defines important near-term support to watch. No resistance remains due to overhead supply. Fundamentals remain strong.
>>> FEATURED STOCK ARTICLE : Quietly Consolidating Below "Max Buy" Level After Breakout - 8/29/2022 |
View all notes |
Set NEW NOTE alert |
Company Profile |
SEC
News |
Chart |
Request a new note
C
A
S
I |
CASY
-
NASDAQ
Caseys General Stores
RETAIL - Super/Mini Markets
|
$221.13
|
+1.23
0.56% |
$223.90
|
298,535
115.26% of 50 DAV
50 DAV is 259,000
|
$222.40
-0.57%
|
9/8/2022
|
$217.81
|
PP = $222.40
|
|
MB = $233.52
|
Most Recent Note - 9/9/2022 5:18:17 PM
Y - Posted a gain today but closed in the lower half of its intra-day range, below the pivot point, after trading above it. Churned heavier volume behind the the prior session's loss, but ended in the upper third of its intra-day range. Highlighted in yellow in the 9/08/22 mid-day report with pivot point cited based on its 8/22/22 high. Perched within striking distance of its all-time high. Reported earnings +28% on +40% sales revenues for the Jul '22 quarter versus the year ago period, its 3rd strong quarterly comparison. Annual earnings history has been strong. See the latest FSU analysis for more details and a new annotated graph.
>>> FEATURED STOCK ARTICLE : Casey's is Perched Within Close Range of All-Time High - 9/9/2022 |
View all notes |
Set NEW NOTE alert |
Company Profile |
SEC
News |
Chart |
Request a new note
C
A
S
I |
Symbol/Exchange
Company Name
Industry Group |
PRICE |
CHANGE
(%Change) |
Day High |
Volume
(% DAV)
(% 50 day avg vol) |
52 Wk Hi
% From Hi |
Featured
Date |
Price
Featured |
Pivot Featured |
|
Max Buy |
CPRX
-
NASDAQ
Catalyst Pharma Inc
Medical-Biomed/Biotech
|
$14.77
|
-0.48
-3.15% |
$15.43
|
2,896,159
121.18% of 50 DAV
50 DAV is 2,390,000
|
$15.61
-5.38%
|
9/8/2022
|
$15.14
|
PP = $15.17
|
|
MB = $15.93
|
Most Recent Note - 9/9/2022 5:23:02 PM
Y - Pulled back today from a new 52-week high following 3 consecutive gains. Highlighted in yellow with pivot point cited based on its 8/23/22 high plus 10 cents in the 9/08/22 mid-day report. Hit a new all-time high after a very tight 4-week consolidation. Reported Jun '22 quarterly earnings +75% on +46% sales revenues versus the year ago period, its 3rd consecutive quarterly comparison above the +25% minimum earnings guideline (C criteria). Annual earnings (A criteria) growth has been strong since turning profitable in FY '19. See the latest FSU analysis for more details and an annotated graph.
>>> FEATURED STOCK ARTICLE : Hit a New High After a 4-Week Tight Pattern of Closes - 9/8/2022 |
View all notes |
Set NEW NOTE alert |
Company Profile |
SEC
News |
Chart |
Request a new note
C
A
S
I |
CCRN
-
NASDAQ
Cross Country Healthcare
DIVERSIFIED SERVICES - Staffing and Outsourcing Service
|
$26.66
|
-0.40
-1.48% |
$29.13
|
1,196,629
146.29% of 50 DAV
50 DAV is 818,000
|
$30.51
-12.62%
|
9/9/2022
|
$27.32
|
PP = $30.61
|
|
MB = $32.14
|
Most Recent Note - 9/9/2022 5:20:32 PM
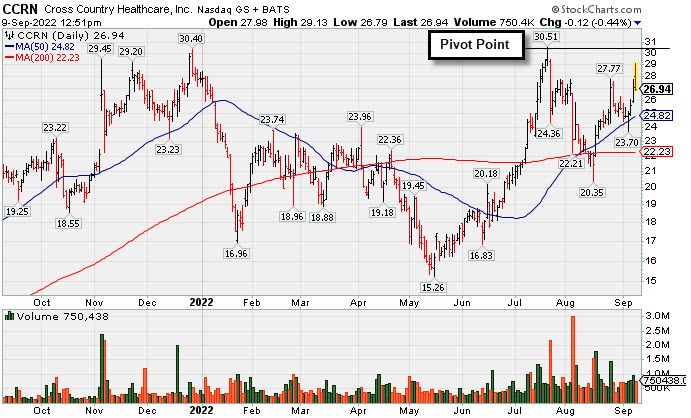
Y - Color code was changed to yellow with pivot point cited based on its 7/21/22 high plus 10 cents in the earlier mid-day report. There was a "negative reversal" today after challenging its 52-week high with 4 consecutive gains. Subsequent gains above the pivot point backed by at least +40% above average volume may trigger a technical buy signal. Faces little resistance due to overhead supply. Rebounded from support near its 200 DMA line with volume-driven gains, then found support at its 50 DMA line while consolidating. Reported Jun '22 quarterly earnings +198% on +127% sales revenues versus the year ago period. Prior quarterly comparisons showed strong sales revenues and earnings increases. Annual earnings growth (A criteria) has been strong since a downturn in FY '17 and '18.
There are no Featured Stock Updates™ available for this stock at this time. You may request one by clicking the Request a New Note link below |
View all notes |
Set NEW NOTE alert |
Company Profile |
SEC
News |
Chart |
Request a new note
C
A
S
I |
|
|
|
THESE ARE NOT BUY RECOMMENDATIONS!
Comments contained in the body of this report are technical
opinions only. The material herein has been obtained
from sources believed to be reliable and accurate, however,
its accuracy and completeness cannot be guaranteed.
This site is not an investment advisor, hence it does
not endorse or recommend any securities or other investments.
Any recommendation contained in this report may not
be suitable for all investors and it is not to be deemed
an offer or solicitation on our part with respect to
the purchase or sale of any securities. All trademarks,
service marks and trade names appearing in this report
are the property of their respective owners, and are
likewise used for identification purposes only.
This report is a service available
only to active Paid Premium Members.
You may opt-out of receiving report notifications
at any time. Questions or comments may be submitted
by writing to Premium Membership Services 665 S.E. 10 Street, Suite 201 Deerfield Beach, FL 33441-5634 or by calling 1-800-965-8307
or 954-785-1121.
|
|
|