You are not logged in.
This means you
CAN ONLY VIEW reports that were published prior to Thursday, April 3, 2025.
You
MUST UPGRADE YOUR MEMBERSHIP if you want to see any current reports.
AFTER MARKET UPDATE - WEDNESDAY, SEPTEMBER 7TH, 2022
Previous After Market Report Next After Market Report >>>
|
|
|
|
DOW |
+435.98 |
31,581.28 |
+1.40% |
|
Volume |
849,957,395 |
-7% |
|
Volume |
4,437,020,200 |
-3% |
|
NASDAQ |
+246.99 |
11,791.90 |
+2.14% |
|
Advancers |
2,325 |
76% |
|
Advancers |
2,978 |
69% |
|
S&P 500 |
+71.68 |
3,979.87 |
+1.83% |
|
Decliners |
729 |
24% |
|
Decliners |
1,309 |
31% |
|
Russell 2000 |
+39.68 |
1,832.00 |
+2.21% |
|
52 Wk Highs |
16 |
|
|
52 Wk Highs |
31 |
|
|
S&P 600 |
+20.79 |
1,166.79 |
+1.81% |
|
52 Wk Lows |
141 |
|
|
52 Wk Lows |
291 |
|
|
Deterioration has the market uptrend under pressure (M criteria) and having the overall look of a more serious correction. A caution flag has been raised by the technical damage in the major indices coupled with a shrinking list of stocks hitting new highs.
|
 |
Breadth Positive as Major Averages Finally Bounce
Kenneth J. Gruneisen - Passed the CAN SLIM® Master's Exam
The S&P 500 jumped 1.8%, rebounding from its lowest level since mid-July in its best session in nearly a month. The Dow gained 435 points, while the Nasdaq Composite advanced 2.1%, with the tech-heavy index snapping a seven-day losing streak which was its worst run since November 2016. The volume totals reported were lighter than the prior session on the NYSE and on the Nasdaq exchange. Breadth was positive as advancers led decliners by more than a 3-1 margin on the NYSE and by more than 2-1 on the Nasdaq exchange. There were 4 high-ranked companies from the Leaders List that hit new 52-week highs and were listed on the BreakOuts Page, up from zero on the prior 5 sessions. New 52-week lows totals still solidly outnumbered new 52-week highs on the NYSE and on the Nasdaq exchange. The market uptrend is now under pressure (M criteria). Any sustainable rally requires a healthy crop of leading stocks hitting new highs.
Chart courtesy of www.stockcharts.com%20on%20Tuesday.%20Yesterday,%20the%20broad%20benchmark%20eclipsed%20the%204,300%20level%20for%20the%20first%20time%20since%20late%20April.%20The%20Nasdaq%20Composite%20fell%201.3%%20amid%20weakness%20in%20mega-cap%20tech%20shares.%20The%20volume%20totals%20reported%20were%20mixed,%20lighter%20than%20the%20prior%20session%20on%20the%20NYSE%20and%20higher%20on%20the%20Nasdaq%20exchange.%20Decliners%20led%20advancers%20by%20a%204-1%20margin%20on%20the%20NYSE%20ad%20by%20a%203-1%20margin%20on%20the%20Nasdaq%20exchange.%20There%20were%2017%20high-ranked%20companies%20from%20the%20Leaders%20List%20that%20hit%20new%2052-week%20highs%20and%20were%20listed%20on%20the%20BreakOuts%20Page,%20down%20from%20the%20total%20of%2045%20on%20the%20prior%20session.%20New%2052-week%20highs%20outnumbered%20new%2052-week%20lows%20on%20the%20NYSE,%20but%20new%20lows%20outnumbered%20new%20highs%20on%20the%20Nasdaq%20exchange.%20The%20market%20is%20in%20a%20confirmed%20uptrend%20(M%20criteria).%20Any%20sustainable%20rally%20requires%20a%20healthy%20crop%20of%20leading%20stocks%20hitting%20new%20highs,%20so%20the%20recent%20improvement%20in%20leadership%20was%20a%20reassuring%20sign.) 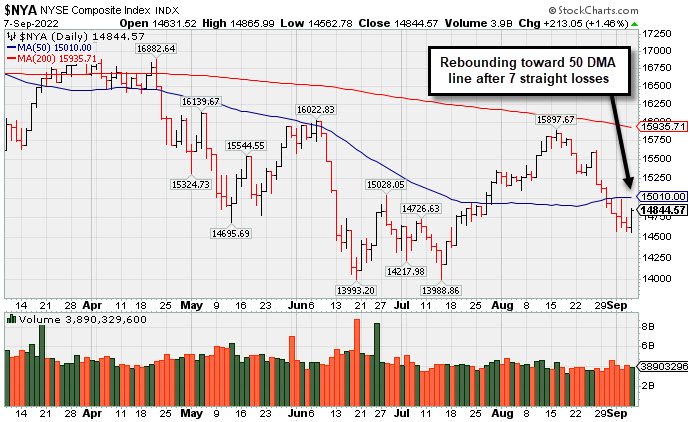 PICTURED: The NYSE Composite Index rebounded toward its 50-day moving average (DMA) line after a streak of 7 consecutive losses. Its rebound met resistance well below its 200 DMA line.
U.S. equities finished higher Wednesday as investors weighed a drop in oil prices and continued to assess the future path of monetary policy. Ten of 11 S&P 500 sectors ended in positive territory, with Energy the sole declining group.
In commodities, West Texas Intermediate (WTI) crude fell 5.5% to $82.11/barrel, below the psychologically important $85 level and a trough not seen since January. Weak economic data from China as a result of their ongoing COVID-19 policies has been overpowering tight global supply conditions. In FOREX trading, a gauge of the U.S. dollar retreated 0.6% after ascending to a new all-time high earlier.
Meanwhile, Treasuries recouped some of yesterday’s losses. The yield on the benchmark 10-year note slid seven basis points (0.07%) to 3.27%, while the 30-year bond yield dropped eight basis points (0.08%) to 3.41% after yesterday notching its highest level since 2014. In central bank news, market participants absorbed a slew of commentary from various Federal Reserve (Fed) officials. Among them, Fed Vice Chair Lael Brainard reiterated that the central bank is committed to fight inflation for as long as necessary, but acknowledged that risks associated with overtightening could emerge in the future. Separately, the Fed’s Beige Book indicated that activity in many regions had stagnated despite moderating price pressures, noting that the growth outlook remains weak for the U.S economy going forward.
|
 Kenneth J. Gruneisen started out as a licensed stockbroker in August 1987, a couple of months prior to the historic stock market crash that took the Dow Jones Industrial Average down -22.6% in a single day. He has published daily fact-based fundamental and technical analysis on high-ranked stocks online for two decades. Through FACTBASEDINVESTING.COM, Kenneth provides educational articles, news, market commentary, and other information regarding proven investment systems that work in good times and bad.
Comments contained in the body of this report are technical opinions only and are not necessarily those of Gruneisen Growth Corp. The material herein has been obtained from sources believed to be reliable and accurate, however, its accuracy and completeness cannot be guaranteed. Our firm, employees, and customers may effect transactions, including transactions contrary to any recommendation herein, or have positions in the securities mentioned herein or options with respect thereto. Any recommendation contained in this report may not be suitable for all investors and it is not to be deemed an offer or solicitation on our part with respect to the purchase or sale of any securities. |
|
 |
Retail, Financial, Tech, and Gold & Silver Indexes Rose
Kenneth J. Gruneisen - Passed the CAN SLIM® Master's Exam
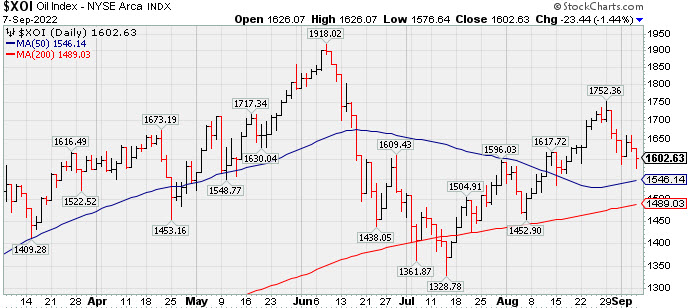
The Retail Index ($RLX +3.05%), Bank Index ($BKX +2.18%), and Broker/Dealer Index ($XBD +1.78%) each posted influential gains. The tech sector had a positive bias as the Biotech Index ($BTK +2.38%) outpaced the Networking Index ($NWX +1.97%) and the Semiconductor Index ($SOX +1.56%). Commodity-linked groups were mixed as the Gold & Silver Index ($XAU +3.71%) posted a standout gain while the Oil Services Index ($OSX -1.24%) and Integrated Oil Index ($XOI -1.44%) both lost ground.
PICTURED: The Integrated Oil Index ($XOI -1.44%) is slumping back toward its 50-day moving average (DMA) line.
| Oil Services |
$OSX |
67.36 |
-0.85 |
-1.24% |
+27.77% |
| Integrated Oil |
$XOI |
1,602.63 |
-23.44 |
-1.44% |
+36.02% |
| Semiconductor |
$SOX |
2,611.50 |
+40.03 |
+1.56% |
-33.82% |
| Networking |
$NWX |
799.03 |
+15.46 |
+1.97% |
-17.72% |
| Broker/Dealer |
$XBD |
439.40 |
+7.67 |
+1.78% |
-9.75% |
| Retail |
$RLX |
3,311.95 |
+98.05 |
+3.05% |
-21.64% |
| Gold & Silver |
$XAU |
100.68 |
+3.60 |
+3.71% |
-23.99% |
| Bank |
$BKX |
106.30 |
+2.27 |
+2.18% |
-19.60% |
| Biotech |
$BTK |
4,754.01 |
+110.53 |
+2.38% |
-13.85% |
|
|
|
 |
Consolidating Near Prior Highs and Above 50-Day Moving Average
Kenneth J. Gruneisen - Passed the CAN SLIM® Master's Exam
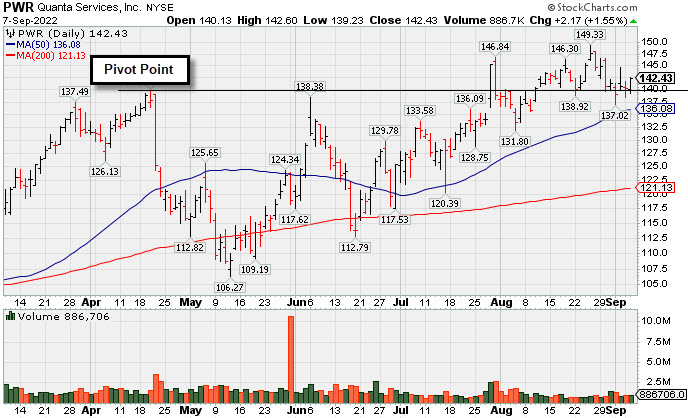
Quanta Services Inc (PWR +$2.17 or +1.55% to $142.43) has been consolidating near its pivot point. Confirming volume-driven gains for new highs would be a reassuring sign of serious institutional buying demand that could lead to a sustained and meaningful advance. Fundamentals remain strong. Its 50-day moving average (DMA) line defines important near-term support to watch.
PWR was highlighted in yellow with pivot point cited based on its 4/20/22 high plus 10 cents in the 7/28/22 mid-day report (read here). It has only slumped and then churned higher volume since last shown in greater detail on 8/16/22 with an annotated graph under the headline, "Stalled After Breakout But Still Quietly Hovering Near High".
It has a 98 Earnings Per Share Rating. Jun '22 quarterly earnings rose +45% on +41% sales revenues versus the year ago period, its 4th quarterly comparison above the +25% minimum earnings guideline (C criteria). Annual earnings (A criteria) growth has been strong and steady.
The company hails from the Building - Heavy Construction industry group which is currently ranked 127th on the 197 Industry Groups list with a Group Relative Strength Rating of C-. The number of top-rated funds owning its shares rose from 1,202 in Sep '21 to 1,518 in Jun '22, a reassuring sign concerning the I criteria. It has 143.7 million shares outstanding (S criteria).
|
|
|
Color Codes Explained :
Y - Better candidates highlighted by our
staff of experts.
G - Previously featured
in past reports as yellow but may no longer be buyable under the
guidelines.
***Last / Change / Volume data in this table is the closing quote data***
Symbol/Exchange
Company Name
Industry Group |
PRICE |
CHANGE
(%Change) |
Day High |
Volume
(% DAV)
(% 50 day avg vol) |
52 Wk Hi
% From Hi |
Featured
Date |
Price
Featured |
Pivot Featured |
|
Max Buy |
 CI
-
NYSE
CI
-
NYSE
Cigna Corp
Medical-Managed Care
|
$290.00
|
+4.75
1.67% |
$291.84
|
2,674,873
141.45% of 50 DAV
50 DAV is 1,891,000
|
$293.96
-1.35%
|
7/7/2022
|
$276.55
|
PP = $273.68
|
|
MB = $287.36
|
Most Recent Note - 9/6/2022 6:13:46 PM
Y - There was a "negative reversal" today while again closing below its "max buy" level with below average volume on the session. Volume totals have been cooling while still hovering near its all-time high. Reported earnings for the Jun '22 quarter rose +19% on +5% sales revenues versus the year ago period, breaking a streak of 3 quarterly earnings increases above the +25% minimum guideline (C criteria), raising fundamental concerns. Near-term support to watch is at its 50 DMA line ($278.76).
>>> FEATURED STOCK ARTICLE : Cigna Hovering Near High Despite Earnings Under +25% Minimum - 8/26/2022 |
View all notes |
Set NEW NOTE alert |
Company Profile |
SEC
News |
Chart |
Request a new note
C
A
S
I |
AN
-
NYSE
Autonation Inc
SPECIALTY RETAIL - Auto Dealerships
|
$119.45
|
+3.21
2.76% |
$119.82
|
742,391
109.66% of 50 DAV
50 DAV is 677,000
|
$135.57
-11.89%
|
7/20/2022
|
$122.03
|
PP = $126.49
|
|
MB = $132.81
|
Most Recent Note - 9/6/2022 12:42:16 PM
G - Slumping further below prior highs in the $126 area and its color code is changed to green after violating its 50 DMA line ($119.85) with today's 5th consecutive loss triggering a technical sell signal. Reported Jun '22 quarterly earnings +34% on -2% sales revenues versus the year ago period.
>>> FEATURED STOCK ARTICLE : Autonation Stalled After Recent Breakout - 8/30/2022 |
View all notes |
Set NEW NOTE alert |
Company Profile |
SEC
News |
Chart |
Request a new note
C
A
S
I |
ESQ
-
NASDAQ
Esquire Financial Hldgs
Finance-Commercial Loans
|
$37.21
|
+0.83
2.28% |
$37.21
|
17,726
53.72% of 50 DAV
50 DAV is 33,000
|
$41.68
-10.72%
|
7/26/2022
|
$37.74
|
PP = $39.19
|
|
MB = $41.15
|
 Most Recent Note - 9/7/2022 2:29:39 PM
Y - Finding support today near its 50 DMA line ($36.63) but it has been sputtering back below the pivot point and into the prior base. Confirming gains above the pivot point backed by at least +40% above average volume would be a reassuring sign of fresh institutional buying.
>>> FEATURED STOCK ARTICLE : Testing 50-Day Moving Average With 5th Straight Loss - 9/1/2022 |
View all notes |
Set NEW NOTE alert |
Company Profile |
SEC
News |
Chart |
Request a new note
C
A
S
I |
GPK
-
NYSE
Graphic Packaging Hldg
CONSUMER NON-DURABLES - Packaging and Containers
|
$23.20
|
+0.61
2.70% |
$23.22
|
2,683,115
94.51% of 50 DAV
50 DAV is 2,839,000
|
$23.71
-2.15%
|
7/26/2022
|
$22.63
|
PP = $23.09
|
|
MB = $24.24
|
Most Recent Note - 9/6/2022 6:07:10 PM
Y - Stalled since its 8/10/22 breakout and it slumped back below its pivot point. Consolidating just above its 50 DMA line ($22.00) which defines important near-term support. More damaging losses would raise greater concerns. See the latest FSU analysis for more details and a new annotated graph.
>>> FEATURED STOCK ARTICLE : Recently Slipped Below Pivot Point Testing 50-Day Average - 9/6/2022 |
View all notes |
Set NEW NOTE alert |
Company Profile |
SEC
News |
Chart |
Request a new note
C
A
S
I |
CSL
-
NYSE
Carlisle Cos Inc
Diversified Operations
|
$302.80
|
+4.86
1.63% |
$303.26
|
460,347
99.64% of 50 DAV
50 DAV is 462,000
|
$318.71
-4.99%
|
7/28/2022
|
$282.31
|
PP = $275.23
|
|
MB = $288.99
|
Most Recent Note - 9/7/2022 2:33:18 PM
G - Still extended from the previously noted base. Consolidating well above its 50 DMA line ($282.42) and prior highs in the $275 area define important near-term support to watch.
>>> FEATURED STOCK ARTICLE : Pulling Back From All-Time High After Volume-Driven Gains - 8/22/2022 |
View all notes |
Set NEW NOTE alert |
Company Profile |
SEC
News |
Chart |
Request a new note
C
A
S
I |
Symbol/Exchange
Company Name
Industry Group |
PRICE |
CHANGE
(%Change) |
Day High |
Volume
(% DAV)
(% 50 day avg vol) |
52 Wk Hi
% From Hi |
Featured
Date |
Price
Featured |
Pivot Featured |
|
Max Buy |
ENPH
-
NASDAQ
Enphase Energy Inc
Energy-Solar
|
$316.31
|
+23.49
8.02% |
$318.22
|
7,155,460
214.49% of 50 DAV
50 DAV is 3,336,000
|
$308.88
2.41%
|
7/28/2022
|
$276.66
|
PP = $282.55
|
|
MB = $296.68
|
Most Recent Note - 9/7/2022 12:20:05 PM
G - Posting a 2nd consecutive solid gain today with above average volume, rallying above its "max buy" level and its color code is changed to green. Volume totals cooled while hovering near its all-time high in recent weeks. The prior high in the $282 area has been noted as initial support to watch above its 50 DMA line ($254.79). Fundamentals remain strong.
>>> FEATURED STOCK ARTICLE : Enphase Energy Consolidating After Rallying to New Highs - 8/19/2022 |
View all notes |
Set NEW NOTE alert |
Company Profile |
SEC
News |
Chart |
Request a new note
C
A
S
I |
PWR
-
NYSE
Quanta Services Inc
MATERIALS and CONSTRUCTION - General Contractors
|
$142.43
|
+2.17
1.55% |
$142.60
|
886,706
83.73% of 50 DAV
50 DAV is 1,059,000
|
$149.33
-4.62%
|
7/28/2022
|
$141.83
|
PP = $140.14
|
|
MB = $147.15
|
Most Recent Note - 9/7/2022 6:31:22 PM
Y - Consolidating near its pivot point. Confirming volume-driven gains for new highs would be a reassuring sign of fresh institutional buying demand. Its 50 DMA line ($136.08) defines important near-term support to watch. Fundamentals remain strong. See the latest FSU analysis for more details and a new annotated graph.
>>> FEATURED STOCK ARTICLE : Consolidating Near Prior Highs and Above 50-Day Moving Average - 9/7/2022 |
View all notes |
Set NEW NOTE alert |
Company Profile |
SEC
News |
Chart |
Request a new note
C
A
S
I |
GFF
-
NYSE
Griffon Corporation
MATERIALS and CONSTRUCTION - General Building Materials
|
$31.96
|
+1.54
5.06% |
$32.21
|
403,543
100.63% of 50 DAV
50 DAV is 401,000
|
$34.35
-6.96%
|
8/8/2022
|
$32.46
|
PP = $31.12
|
|
MB = $32.68
|
Most Recent Note - 9/7/2022 2:31:38 PM
Y - Finding prompt support with a big gain today after briefly undercutting prior highs in the $31 area. The next important support to watch is its 50 DMA line ($29.70).
>>> FEATURED STOCK ARTICLE : Best Ever Close With Gain on Lighter Volume - 8/25/2022 |
View all notes |
Set NEW NOTE alert |
Company Profile |
SEC
News |
Chart |
Request a new note
C
A
S
I |
CLH
-
NYSE
Clean Harbors Inc
Pollution Control
|
$119.62
|
+3.30
2.84% |
$120.07
|
489,520
157.40% of 50 DAV
50 DAV is 311,000
|
$124.33
-3.79%
|
8/10/2022
|
$111.78
|
PP = $115.10
|
|
MB = $120.86
|
Most Recent Note - 9/7/2022 2:26:47 PM
Y - Still quietly consolidating below its "max buy" level and above the prior high in the $115 area defining important near-term support to watch. No resistance remains due to overhead supply. Fundamentals remain strong.
>>> FEATURED STOCK ARTICLE : Quietly Consolidating Below "Max Buy" Level After Breakout - 8/29/2022 |
View all notes |
Set NEW NOTE alert |
Company Profile |
SEC
News |
Chart |
Request a new note
C
A
S
I |
|
|
|
THESE ARE NOT BUY RECOMMENDATIONS!
Comments contained in the body of this report are technical
opinions only. The material herein has been obtained
from sources believed to be reliable and accurate, however,
its accuracy and completeness cannot be guaranteed.
This site is not an investment advisor, hence it does
not endorse or recommend any securities or other investments.
Any recommendation contained in this report may not
be suitable for all investors and it is not to be deemed
an offer or solicitation on our part with respect to
the purchase or sale of any securities. All trademarks,
service marks and trade names appearing in this report
are the property of their respective owners, and are
likewise used for identification purposes only.
This report is a service available
only to active Paid Premium Members.
You may opt-out of receiving report notifications
at any time. Questions or comments may be submitted
by writing to Premium Membership Services 665 S.E. 10 Street, Suite 201 Deerfield Beach, FL 33441-5634 or by calling 1-800-965-8307
or 954-785-1121.
|
|
|