You are not logged in.
This means you
CAN ONLY VIEW reports that were published prior to Thursday, April 10, 2025.
You
MUST UPGRADE YOUR MEMBERSHIP if you want to see any current reports.
AFTER MARKET UPDATE - THURSDAY, SEPTEMBER 22ND, 2022
Previous After Market Report Next After Market Report >>>
|
|
|
|
DOW |
-107.10 |
30,076.68 |
-0.35% |
|
Volume |
918,436,640 |
+3% |
|
Volume |
4,893,603,000 |
+8% |
|
NASDAQ |
-153.39 |
11,066.81 |
-1.37% |
|
Advancers |
550 |
18% |
|
Advancers |
889 |
21% |
|
S&P 500 |
-31.94 |
3,757.99 |
-0.84% |
|
Decliners |
2,566 |
82% |
|
Decliners |
3,437 |
79% |
|
Russell 2000 |
-39.85 |
1,722.31 |
-2.26% |
|
52 Wk Highs |
10 |
|
|
52 Wk Highs |
25 |
|
|
S&P 600 |
-23.69 |
1,105.59 |
-2.10% |
|
52 Wk Lows |
726 |
|
|
52 Wk Lows |
940 |
|
|
The market (M criteria) is in a correction. A caution flag has been raised by the technical damage in the major indices coupled with a shrinking list of stocks hitting new highs. Disciplined investors know to raise cash by selling weakening stocks on a case-by-case basis, and to protect that cash by avoiding any new buys until a new rally is confirmed with a follow-through day.
|
 |
Breadth Negative as Major Averages Continue Slumping
Kenneth J. Gruneisen - Passed the CAN SLIM® Master's Exam
The Dow lost 107 points, while the Nasdaq Composite fell 1.4% amid weakness in Technology shares. The S&P 500 declined 0.8% to its lowest level since mid-July. The volume totals reported were higher than the prior session on the NYSE and on the Nasdaq exchange, indicative of an increase in institutional selling pressure termed "distribution". Breadth was negative as decliners led advancers by almost a 5-1 margin on the NYSE and nearly 4-1 on the Nasdaq exchange. There were 4 high-ranked companies from the Leaders List that hit new 52-week highs and were listed on the BreakOuts Page, versus the total of 5 on the prior session. New 52-week lows totals swelled again and solidly outnumbered shrinking new 52-week highs on both the NYSE and the Nasdaq exchange. The market is now in a correction (M criteria).
Chart courtesy of www.stockcharts.com%20on%20Tuesday.%20Yesterday,%20the%20broad%20benchmark%20eclipsed%20the%204,300%20level%20for%20the%20first%20time%20since%20late%20April.%20The%20Nasdaq%20Composite%20fell%201.3%%20amid%20weakness%20in%20mega-cap%20tech%20shares.%20The%20volume%20totals%20reported%20were%20mixed,%20lighter%20than%20the%20prior%20session%20on%20the%20NYSE%20and%20higher%20on%20the%20Nasdaq%20exchange.%20Decliners%20led%20advancers%20by%20a%204-1%20margin%20on%20the%20NYSE%20ad%20by%20a%203-1%20margin%20on%20the%20Nasdaq%20exchange.%20There%20were%2017%20high-ranked%20companies%20from%20the%20Leaders%20List%20that%20hit%20new%2052-week%20highs%20and%20were%20listed%20on%20the%20BreakOuts%20Page,%20down%20from%20the%20total%20of%2045%20on%20the%20prior%20session.%20New%2052-week%20highs%20outnumbered%20new%2052-week%20lows%20on%20the%20NYSE,%20but%20new%20lows%20outnumbered%20new%20highs%20on%20the%20Nasdaq%20exchange.%20The%20market%20is%20in%20a%20confirmed%20uptrend%20(M%20criteria).%20Any%20sustainable%20rally%20requires%20a%20healthy%20crop%20of%20leading%20stocks%20hitting%20new%20highs,%20so%20the%20recent%20improvement%20in%20leadership%20was%20a%20reassuring%20sign.) 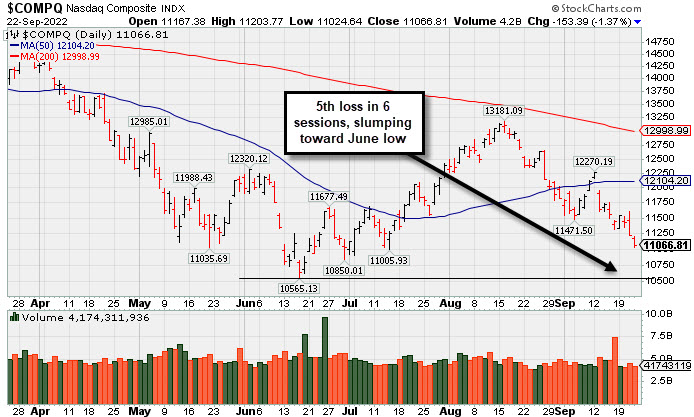 PICTURED: The Nasdaq Composite Index fell for a 5th loss in 6 sessions, slumping toward the June low.
U.S. equities finished lower Thursday as recession worries grew following a flurry of central bank policy decisions. Yesterday, the U.S. Federal Reserve (Fed) implemented a 75 basis point (0.75%) rate hike to bring the benchmark rate up to a range of 3% to 3.25%, its highest level since 2008. Today, the Bank of England announced a 50 basis point (0.50%) rate hike, while the Bank of Japan maintained ultralow interest rates.
On the data front, initial jobless claims for the week ended September 17 came in at 213,000, up from the prior week’s downwardly revised 208,000 figure. The increase in claims indicates a resilient labor market despite growing signs of a recession. Meanwhile, the second quarter account deficit narrowed due to an increase in exports. The Conference Board leading economic index, a metric for forecasting future economic activity, declined by a larger-than-anticipated 0.3% in August. Rounding out the docket, the Kansas City Fed Manufacturing Activity index unexpectedly slowed in September.
Treasury yields soared, with the yield on the benchmark 10-year note climbing 19 basis points (0.19%) to 3.70%, while the two-year note, which is more sensitive to changes in monetary policy, advanced nine basis points (0.09%) to 4.12%. In commodities, West Texas Intermediate (WTI) crude climbed 0.7% to $83.48/barrel amid concerns over tight supply following reports of partial military mobilization in Russia. However, a darkening economic outlook and strong U.S. dollar have placed a cap on prices.
|
 Kenneth J. Gruneisen started out as a licensed stockbroker in August 1987, a couple of months prior to the historic stock market crash that took the Dow Jones Industrial Average down -22.6% in a single day. He has published daily fact-based fundamental and technical analysis on high-ranked stocks online for two decades. Through FACTBASEDINVESTING.COM, Kenneth provides educational articles, news, market commentary, and other information regarding proven investment systems that work in good times and bad.
Comments contained in the body of this report are technical opinions only and are not necessarily those of Gruneisen Growth Corp. The material herein has been obtained from sources believed to be reliable and accurate, however, its accuracy and completeness cannot be guaranteed. Our firm, employees, and customers may effect transactions, including transactions contrary to any recommendation herein, or have positions in the securities mentioned herein or options with respect thereto. Any recommendation contained in this report may not be suitable for all investors and it is not to be deemed an offer or solicitation on our part with respect to the purchase or sale of any securities. |
|
 |
Financial, Retail, Tech, and Commodity-Linked Groups Fell Again
Kenneth J. Gruneisen - Passed the CAN SLIM® Master's Exam
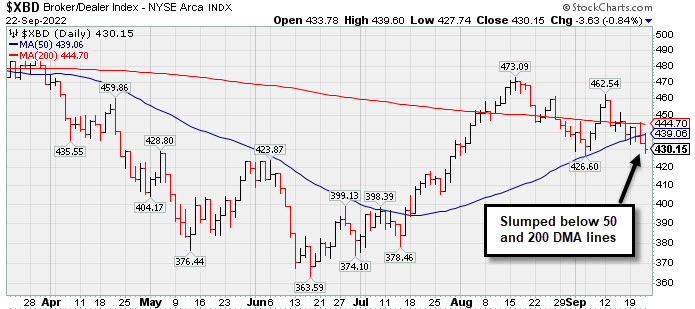
The Bank Index ($BKX -2.48%), Broker/Dealer Index ($XBD -0.84%), and Retail Index ($RLX -1.14%) each lost ground and weighed on the major averages again. The Semiconductor Index ($SOX -2.81%) and Networking Index ($NWX -1.90%) led the tech sector lower while the Biotech Index ($BTK -0.75%) suffered a smaller loss. Commodity-linked groups were lower as the Oil Services Index ($OSX -1.13%), Integrated Oil Index ($XOI -0.30%), and Gold & Silver Index ($XAU -0.51%) each lost ground.
PICTURED: The Broker/Dealer Index ($XBD -0.84%) slumped below its 50-day and 200-day moving average (DMA) lines toward the prior low.
| Oil Services |
$OSX |
62.89 |
-0.72 |
-1.13% |
+19.30% |
| Integrated Oil |
$XOI |
1,567.29 |
-4.72 |
-0.30% |
+33.02% |
| Semiconductor |
$SOX |
2,444.25 |
-70.71 |
-2.81% |
-38.06% |
| Networking |
$NWX |
742.15 |
-14.41 |
-1.90% |
-23.58% |
| Broker/Dealer |
$XBD |
430.15 |
-3.63 |
-0.84% |
-11.65% |
| Retail |
$RLX |
3,029.33 |
-34.79 |
-1.14% |
-28.32% |
| Gold & Silver |
$XAU |
99.03 |
-0.51 |
-0.51% |
-25.23% |
| Bank |
$BKX |
100.87 |
-2.56 |
-2.48% |
-23.71% |
| Biotech |
$BTK |
4,539.94 |
-34.18 |
-0.75% |
-17.73% |
|
|
|
 |
Featured Stocks
Kenneth J. Gruneisen - Passed the CAN SLIM® Master's Exam
|
|
|
Color Codes Explained :
Y - Better candidates highlighted by our
staff of experts.
G - Previously featured
in past reports as yellow but may no longer be buyable under the
guidelines.
***Last / Change / Volume data in this table is the closing quote data***
Symbol/Exchange
Company Name
Industry Group |
PRICE |
CHANGE
(%Change) |
Day High |
Volume
(% DAV)
(% 50 day avg vol) |
52 Wk Hi
% From Hi |
Featured
Date |
Price
Featured |
Pivot Featured |
|
Max Buy |
 CI
-
NYSE
CI
-
NYSE
Cigna Corp
Medical-Managed Care
|
$282.90
|
-2.05
-0.72% |
$285.36
|
1,142,839
59.31% of 50 DAV
50 DAV is 1,927,000
|
$296.29
-4.52%
|
7/7/2022
|
$276.55
|
PP = $273.68
|
|
MB = $287.36
|
Most Recent Note - 9/21/2022 2:46:19 PM
G - Found support above its 50 DMA line ($282) while consolidating near its all-time high in recent weeks. Reported earnings for the Jun '22 quarter rose +19% on +5% sales revenues versus the year ago period, breaking a streak of 3 quarterly earnings increases above the +25% minimum guideline (C criteria), raising fundamental concerns.
>>> FEATURED STOCK ARTICLE : Found Support Above 50-Day Moving Average Line This Week - 9/16/2022 |
View all notes |
Set NEW NOTE alert |
Company Profile |
SEC
News |
Chart |
Request a new note
C
A
S
I |
ESQ
-
NASDAQ
Esquire Financial Hldgs
Finance-Commercial Loans
|
$38.54
|
+0.10
0.26% |
$38.82
|
23,936
92.06% of 50 DAV
50 DAV is 26,000
|
$41.68
-7.53%
|
7/26/2022
|
$37.74
|
PP = $39.19
|
|
MB = $41.15
|
Most Recent Note - 9/20/2022 5:35:50 PM
Y - Making gradual progress after recently finding support near its 50 DMA line ($37.38). Gains back above the pivot point were a reassuring sign of fresh institutional buying. The market is in a correction (M criteria) and disciplined investors know to avoid new buying efforts until a new rally confirmed with a follow-through day. See the latest FSU analysis for more details and a new annotated graph.
>>> FEATURED STOCK ARTICLE : Thinly-Traded Esquire Still Perched Near High - 9/20/2022 |
View all notes |
Set NEW NOTE alert |
Company Profile |
SEC
News |
Chart |
Request a new note
C
A
S
I |
CSL
-
NYSE
Carlisle Cos Inc
Diversified Operations
|
$278.94
|
-5.87
-2.06% |
$285.24
|
437,075
86.72% of 50 DAV
50 DAV is 504,000
|
$318.71
-12.48%
|
7/28/2022
|
$282.31
|
PP = $275.23
|
|
MB = $288.99
|
 Most Recent Note - 9/22/2022 7:40:17 PM
G - Today's 3rd consecutive loss added to recent damage. Prior highs in the $275 area define the next important support to watch. Only a prompt rebound above the 50 DMA line would help its outlook improve.
>>> FEATURED STOCK ARTICLE : Consolidating Near High Well Above 50-Day Moving Average - 9/14/2022 |
View all notes |
Set NEW NOTE alert |
Company Profile |
SEC
News |
Chart |
Request a new note
C
A
S
I |
ENPH
-
NASDAQ
Enphase Energy Inc
Energy-Solar
|
$283.63
|
-20.93
-6.87% |
$306.00
|
4,690,279
127.63% of 50 DAV
50 DAV is 3,675,000
|
$324.84
-12.69%
|
7/28/2022
|
$276.66
|
PP = $282.55
|
|
MB = $296.68
|
Most Recent Note - 9/22/2022 12:25:10 PM
Y - Color code is changed to yellow while pulling back below its "max buy" level for a 4th consecutive loss. Its 50 DMA line ($279.69) and recent lows in the $271-272 area define important near-term support. Fundamentals remain strong. The market is in a correction (M criteria) and disciplined investors know to avoid new buying efforts until a new rally confirmed with a follow-through day.
>>> FEATURED STOCK ARTICLE : High-Ranked Solar Energy Firm Hovering Near All-Time High - 9/13/2022 |
View all notes |
Set NEW NOTE alert |
Company Profile |
SEC
News |
Chart |
Request a new note
C
A
S
I |
PWR
-
NYSE
Quanta Services Inc
MATERIALS and CONSTRUCTION - General Contractors
|
$135.71
|
-0.82
-0.60% |
$137.91
|
759,026
68.44% of 50 DAV
50 DAV is 1,109,000
|
$149.33
-9.12%
|
7/28/2022
|
$141.83
|
PP = $140.14
|
|
MB = $147.15
|
Most Recent Note - 9/21/2022 7:50:16 PM
G - Color code is changed to green after slumping below its 50 DMA line ($139) with a loss today on light volume raising concerns. A rebound back above the 50 DMA line is again needed for its outlook to improve. Fundamentals remain strong.
>>> FEATURED STOCK ARTICLE : Consolidating Near Prior Highs and Above 50-Day Moving Average - 9/7/2022 |
View all notes |
Set NEW NOTE alert |
Company Profile |
SEC
News |
Chart |
Request a new note
C
A
S
I |
Symbol/Exchange
Company Name
Industry Group |
PRICE |
CHANGE
(%Change) |
Day High |
Volume
(% DAV)
(% 50 day avg vol) |
52 Wk Hi
% From Hi |
Featured
Date |
Price
Featured |
Pivot Featured |
|
Max Buy |
GFF
-
NYSE
Griffon Corporation
MATERIALS and CONSTRUCTION - General Building Materials
|
$29.65
|
-1.60
-5.12% |
$31.22
|
522,304
139.65% of 50 DAV
50 DAV is 374,000
|
$34.92
-15.09%
|
8/8/2022
|
$32.46
|
PP = $31.12
|
|
MB = $32.68
|
Most Recent Note - 9/22/2022 7:35:54 PM
G - Color code is changed to green as volume was above average behind a big loss today as it violated its 50 DMA line ($31) and prior low in the $30 area triggering technical sell signals. Only a prompt rebound above the 50 DMA line would help its outlook improve.
>>> FEATURED STOCK ARTICLE : Griffon Near All-Time High Making Limited Progress - 9/15/2022 |
View all notes |
Set NEW NOTE alert |
Company Profile |
SEC
News |
Chart |
Request a new note
C
A
S
I |
CLH
-
NYSE
Clean Harbors Inc
Pollution Control
|
$112.46
|
-3.24
-2.80% |
$116.08
|
523,230
146.15% of 50 DAV
50 DAV is 358,000
|
$124.49
-9.66%
|
8/10/2022
|
$111.78
|
PP = $115.10
|
|
MB = $120.86
|
Most Recent Note - 9/22/2022 12:19:17 PM
Y - A damaging loss today is raising concerns while slumping near its 50 DMA line ($109.95) which defines the next important support to watch. Fundamentals remain strong.
>>> FEATURED STOCK ARTICLE : Tested Support Near Prior High in the $115 Area - 9/19/2022 |
View all notes |
Set NEW NOTE alert |
Company Profile |
SEC
News |
Chart |
Request a new note
C
A
S
I |
CASY
-
NASDAQ
Caseys General Stores
RETAIL - Super/Mini Markets
|
$208.65
|
-4.21
-1.98% |
$212.36
|
186,420
75.47% of 50 DAV
50 DAV is 247,000
|
$223.90
-6.81%
|
9/8/2022
|
$217.81
|
PP = $222.40
|
|
MB = $233.52
|
Most Recent Note - 9/21/2022 2:42:26 PM
Y - Still holding its ground and volume totals have been cooling while consolidating above its 50 DMA line ($209.81). Failed to close above the pivot point and clinch a proper technical buy signal since featured on 9/08/22. Fundamentals remain strong.
>>> FEATURED STOCK ARTICLE : Casey's is Perched Within Close Range of All-Time High - 9/9/2022 |
View all notes |
Set NEW NOTE alert |
Company Profile |
SEC
News |
Chart |
Request a new note
C
A
S
I |
CPRX
-
NASDAQ
Catalyst Pharma Inc
Medical-Biomed/Biotech
|
$12.20
|
-0.26
-2.09% |
$12.53
|
3,116,722
84.51% of 50 DAV
50 DAV is 3,688,000
|
$17.22
-29.15%
|
9/8/2022
|
$15.14
|
PP = $15.17
|
|
MB = $15.93
|
Most Recent Note - 9/22/2022 7:37:45 PM
G - Slumped below its 50 DMA line ($12.46) with today's 6th consecutive loss raising greater concerns. Only a prompt rebound above the 50 DMA line would help its outlook improve.
>>> FEATURED STOCK ARTICLE : Hit a New High After a 4-Week Tight Pattern of Closes - 9/8/2022 |
View all notes |
Set NEW NOTE alert |
Company Profile |
SEC
News |
Chart |
Request a new note
C
A
S
I |
CCRN
-
NASDAQ
Cross Country Healthcare
DIVERSIFIED SERVICES - Staffing and Outsourcing Service
|
$27.28
|
-1.76
-6.06% |
$29.04
|
1,130,094
125.43% of 50 DAV
50 DAV is 901,000
|
$30.51
-10.59%
|
9/9/2022
|
$27.32
|
PP = $30.61
|
|
MB = $32.14
|
Most Recent Note - 9/22/2022 12:16:39 PM
Y - Volume totals have been cooling while consolidating within striking distance of prior highs in the $30 area. Its 50 DMA line ($25.93) defines important support to watch on pullbacks. Recently reported insider buying is a reassuring sign.The market is in a correction (M criteria) and disciplined investors know to avoid new buying efforts until a new rally confirmed with a follow-through day.
>>> FEATURED STOCK ARTICLE : Positive Reversal While Consolidating Above 50-Day Moving Average - 9/12/2022 |
View all notes |
Set NEW NOTE alert |
Company Profile |
SEC
News |
Chart |
Request a new note
C
A
S
I |
Symbol/Exchange
Company Name
Industry Group |
PRICE |
CHANGE
(%Change) |
Day High |
Volume
(% DAV)
(% 50 day avg vol) |
52 Wk Hi
% From Hi |
Featured
Date |
Price
Featured |
Pivot Featured |
|
Max Buy |
|
|
|
THESE ARE NOT BUY RECOMMENDATIONS!
Comments contained in the body of this report are technical
opinions only. The material herein has been obtained
from sources believed to be reliable and accurate, however,
its accuracy and completeness cannot be guaranteed.
This site is not an investment advisor, hence it does
not endorse or recommend any securities or other investments.
Any recommendation contained in this report may not
be suitable for all investors and it is not to be deemed
an offer or solicitation on our part with respect to
the purchase or sale of any securities. All trademarks,
service marks and trade names appearing in this report
are the property of their respective owners, and are
likewise used for identification purposes only.
This report is a service available
only to active Paid Premium Members.
You may opt-out of receiving report notifications
at any time. Questions or comments may be submitted
by writing to Premium Membership Services 665 S.E. 10 Street, Suite 201 Deerfield Beach, FL 33441-5634 or by calling 1-800-965-8307
or 954-785-1121.
|
|
|