You are not logged in.
This means you
CAN ONLY VIEW reports that were published prior to Friday, April 25, 2025.
You
MUST UPGRADE YOUR MEMBERSHIP if you want to see any current reports.
AFTER MARKET UPDATE - MONDAY, AUGUST 21ST, 2023
Previous After Market Report Next After Market Report >>>
|
|
|
|
DOW |
-36.97 |
34,463.69 |
-0.11% |
|
Volume |
817,788,809 |
-15% |
|
Volume |
4,359,952,400 |
-9% |
|
NASDAQ |
+206.81 |
13,497.59 |
+1.56% |
|
Advancers |
1,090 |
38% |
|
Advancers |
2,053 |
47% |
|
S&P 500 |
+30.06 |
4,399.77 |
+0.69% |
|
Decliners |
1,767 |
62% |
|
Decliners |
2,326 |
53% |
|
Russell 2000 |
-3.41 |
1,856.01 |
-0.18% |
|
52 Wk Highs |
29 |
|
|
52 Wk Highs |
44 |
|
|
S&P 600 |
-5.17 |
1,196.21 |
-0.43% |
|
52 Wk Lows |
82 |
|
|
52 Wk Lows |
218 |
|
|
Last week's distributional action, clearly negative breadth, and waning leadership signaled a more worrisome market correction (M criteria). Greater caution is called for and disciplined investors should be ready to reduce exposure and raise cash by selling any weakening stocks on a case-by-case basis.
|
 |
Nasdaq Composite Index Outpaces Peers as Mega-Caps Rebound
Kenneth J. Gruneisen - Passed the CAN SLIM® Master's Exam
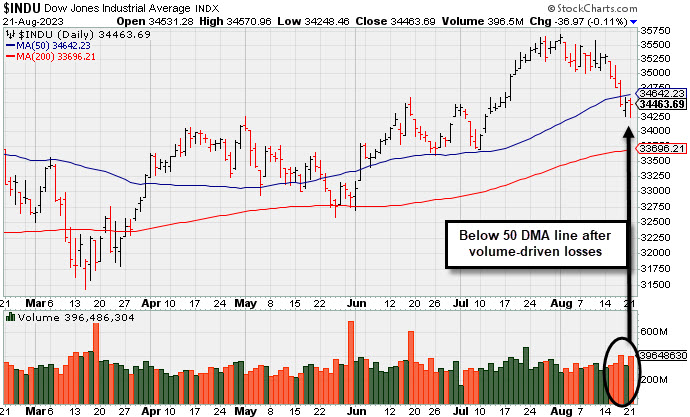
Buy-the-dip action in the mega cap space led to the outperformance of the Nasdaq Composite (+1.6%). Volume totals reported were lighter than the prior session on the NYSE and on the Nasdaq exchange. Decliners led advancers by more than a 3-2 margin on the NYSE and by a narrower margin on the Nasdaq exchange. There were 9 high-ranked companies from the Leaders List that hit a new 52-week high and were listed on the BreakOuts Page, versus the total of 3 on the prior session. New 52-week lows totals contracted yet still solidly outnumbered new 52-week highs totals on both the NYSE and on the Nasdaq exchange. The major indices are in a correction (M criteria). Leadership has quickly evaporated as indicated by waning new highs totals on both major exchanges. New buying efforts should be avoided until a new confirmed rally marked by a solid follow-through day.
PICTURED: The Dow Jones Industrial Average suffered another volume-driven loss, slumping below its 50-day moving average (DMA) line.
There was no U.S. economic data of note. The Existing Home Sales report for July is due Tuesday at 10:00 a.m. ET. Treasury yields were notable as the 2-yr note yield settled eight basis points higher at 4.99% after reaching 5.00% earlier. The 10-yr note yield rose nine basis points to 4.34%, which is its highest level since 2007, after hitting 4.35% earlier. The 30-yr bond yield rose eight basis points to 4.46%, hitting its highest level since 2011. Some angst ahead of Fed Chair Powell's speech Friday at the Jackson Hole Symposium contributed to the weakness in the Treasury market. Concerns about China's disappointing growth remained a limiting factor for stocks. The People's Bank of China lowered its one-year loan prime rate by ten basis points to 3.45% while the 5-yr rate was left unchanged at 4.20% against expectations for bigger cuts.
Tesla (TSLA +7.3%) and NVIDIA (NVDA +8.5%) were top performers from the mega cap space. NVDA, which reports earnings after the close on Wednesday, rose after HSBC raised its price target to $780 from $600. S&P 500 sector performance was mixed. Information technology (+2.3%), the most heavily weighted sector in the S&P 500, outpaced the remaining ten sectors by a decent margin. Palo Alto Networks (PANW +14.8%) was a huge factor as it gapped up after better than expected results. The interest rate sensitive real estate sector (-0.9%) saw the largest decline.
|
 Kenneth J. Gruneisen started out as a licensed stockbroker in August 1987, a couple of months prior to the historic stock market crash that took the Dow Jones Industrial Average down -22.6% in a single day. He has published daily fact-based fundamental and technical analysis on high-ranked stocks online for two decades. Through FACTBASEDINVESTING.COM, Kenneth provides educational articles, news, market commentary, and other information regarding proven investment systems that work in good times and bad.
Comments contained in the body of this report are technical opinions only and are not necessarily those of Gruneisen Growth Corp. The material herein has been obtained from sources believed to be reliable and accurate, however, its accuracy and completeness cannot be guaranteed. Our firm, employees, and customers may effect transactions, including transactions contrary to any recommendation herein, or have positions in the securities mentioned herein or options with respect thereto. Any recommendation contained in this report may not be suitable for all investors and it is not to be deemed an offer or solicitation on our part with respect to the purchase or sale of any securities. |
|
 |
Tech, Broker/Dealer, and Retail Indexes Rose
Kenneth J. Gruneisen - Passed the CAN SLIM® Master's Exam
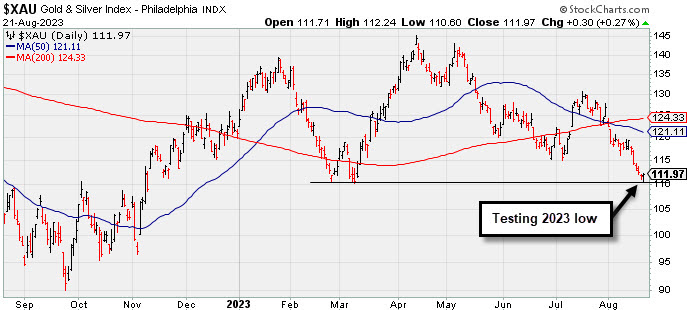
The Semiconductor Index ($SOX +2.83%) and the Biotech Index ($BTK +1.64%) both led the tech sector higher while the Networking Index ($NWX +0.27%) also inched higher. The Broker/Dealer Index ($XBD +0.74%) posted a solid gain while the Bank Index ($BKX -0.27%) again edged lower. The Retail Index ($RLX +0.39%) edged higher. Commodity-linked groups were mixed and indecisive as the Gold & Silver Index ($XAU +0.27%) edged higher while the Oil Services Index ($OSX -0.74%) and the Integrated Oil Index ($XOI -0.45%) both lost ground.
PICTURED: The Gold & Silver Index ($XAU +0.27%) is well below its 50-day and 200-day moving average (DMA) lines testing its 2023 low.
| Oil Services |
$OSX |
91.39 |
-0.68 |
-0.74% |
+8.98% |
| Integrated Oil |
$XOI |
1,861.55 |
-8.41 |
-0.45% |
+4.16% |
| Semiconductor |
$SOX |
3,560.74 |
+98.01 |
+2.83% |
+40.62% |
| Networking |
$NWX |
779.90 |
+2.14 |
+0.27% |
-0.44% |
| Broker/Dealer |
$XBD |
497.43 |
+3.67 |
+0.74% |
+10.76% |
| Retail |
$RLX |
3,550.73 |
+13.93 |
+0.39% |
+28.93% |
| Gold & Silver |
$XAU |
111.97 |
+0.30 |
+0.27% |
-7.35% |
| Bank |
$BKX |
81.56 |
-0.22 |
-0.27% |
-19.13% |
| Biotech |
$BTK |
5,241.95 |
+84.34 |
+1.64% |
-0.74% |
|
|
|
 |
FIX Still Stubbornly Hovering Near High
Kenneth J. Gruneisen - Passed the CAN SLIM® Master's Exam
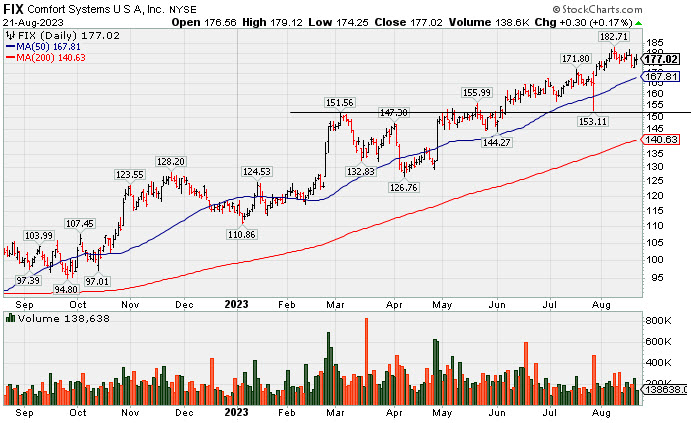
Comfort Systems U S A (FIX +$0.30 or +0.17% to $177.02) is still stubbornly holding its ground near its all-time high. Its 50-day moving average (DMA) line ($168) defines important near-term support to watch on pullbacks. Fundamentals remain strong.
Its annual earnings history (A criteria) has been strong and steady. It has a 98 Earnings Per Share Rating. It reported Jun '23 quarterly earnings +65% on +27% sales revenues versus the year-ago period. FIX was highlighted in yellow in the 2/23/23 mid-day report (read here) with a pivot point cited based on its 11/23/22 high plus 10 cents. It was last shown in greater detail on 7/19/23 with an annotated graph under the headline, "Pulled Back From High With Lighter Volume".
It hails from the Building - A/C & Heating Products group which is currently ranked 7th on the 197 Industry Groups list. It has a small supply of only 35.8 million shares outstanding (S criteria) which can contribute to greater price volatility in the event of institutional buying or selling. The number of top-rated funds that own its shares rose from 487 in Jun '22 to 643 in Jun '23, a reassuring sign regarding the I criteria.
|
|
|
Color Codes Explained :
Y - Better candidates highlighted by our
staff of experts.
G - Previously featured
in past reports as yellow but may no longer be buyable under the
guidelines.
***Last / Change / Volume data in this table is the closing quote data***
Symbol/Exchange
Company Name
Industry Group |
PRICE |
CHANGE
(%Change) |
Day High |
Volume
(% DAV)
(% 50 day avg vol) |
52 Wk Hi
% From Hi |
Featured
Date |
Price
Featured |
Pivot Featured |
|
Max Buy |
 STRL
-
NASDAQ
STRL
-
NASDAQ
Sterling Infrastructure
Bldg-Heavy Construction
|
$77.41
|
+0.39
0.51% |
$79.43
|
314,064
74.96% of 50 DAV
50 DAV is 419,000
|
$83.81
-7.64%
|
12/14/2022
|
$32.41
|
PP = $33.72
|
|
MB = $35.41
|
Most Recent Note - 8/17/2023 5:42:08 PM
G - Abruptly retreated from its all-time high with today's big volume-driven loss. It is very extended from any sound base. Jun '23 quarterly earnings rose +37% on +13% sales revenues versus the year-ago period.
>>> FEATURED STOCK ARTICLE : Volume-Driven Gains Leave Construction Firm at All-Time High - 8/9/2023 |
View all notes |
Set NEW NOTE alert |
Company Profile |
SEC
News |
Chart |
Request a new note
C
A
S
I |
FIX
-
NYSE
Comfort Systems USA
Bldg-A/C and Heating Prds
|
$177.02
|
+0.30
0.17% |
$179.12
|
138,638
65.40% of 50 DAV
50 DAV is 212,000
|
$182.94
-3.24%
|
4/27/2023
|
$148.85
|
PP = $152.23
|
|
MB = $159.84
|
 Most Recent Note - 8/21/2023 5:08:25 PM
G - Still stubbornly holding its ground near its all-time high. Its 50 DMA line ($168) defines important near-term support to watch on pullbacks. Fundamentals remain strong. See the latest FSU analysis for more details and a new annotated graph.
>>> FEATURED STOCK ARTICLE : FIX Still Stubbornly Hovering Near High - 8/21/2023 |
View all notes |
Set NEW NOTE alert |
Company Profile |
SEC
News |
Chart |
Request a new note
C
A
S
I |
KOF
-
NYSE
Coca-Cola Femsa ADR
Beverages-Non-Alcoholic
|
$85.69
|
-1.06
-1.22% |
$86.72
|
128,873
87.67% of 50 DAV
50 DAV is 147,000
|
$91.23
-6.07%
|
6/9/2023
|
$88.61
|
PP = $91.33
|
|
MB = $95.90
|
Most Recent Note - 8/18/2023 4:21:57 PM
G - Posted a 5th consecutive gain today, rebounding above the 50 DMA line ($84.27) helping its outlook to improve. Faces some near-term resistance due to overhead supply up to the $91 area. Its Relative Strength Rating is currently 87. Reported Jun '23 quarterly earnings +23% on +26% sales revenues versus the year-ago period, below the +25% minimum guideline (C criteria).
>>> FEATURED STOCK ARTICLE : 50-Day Moving Average Line has Acted as Resistance - 8/10/2023 |
View all notes |
Set NEW NOTE alert |
Company Profile |
SEC
News |
Chart |
Request a new note
C
A
S
I |
CLH
-
NYSE
Clean Harbors
Pollution Control
|
$172.21
|
+0.68
0.40% |
$172.74
|
242,664
64.37% of 50 DAV
50 DAV is 377,000
|
$178.33
-3.43%
|
3/10/2023
|
$136.89
|
PP = $136.74
|
|
MB = $143.58
|
Most Recent Note - 8/21/2023 5:11:23 PM
G - Still hovering near its all-time high with volume totals cooling. Its 50 DMA line ($165) defines important near-term support to watch on pullbacks. Reported earnings for the Jun '23 quarter -13% on +3% sales revenues versus the year-ago period, below the +25% minimum earnings guideline (C criteria), raising fundamental concerns.
>>> FEATURED STOCK ARTICLE : Volume Totals Have Been Cooling While Hovering Near High - 8/18/2023 |
View all notes |
Set NEW NOTE alert |
Company Profile |
SEC
News |
Chart |
Request a new note
C
A
S
I |
HUBB
-
NYSE
Hubbell
Electrical-Power/Equipmt
|
$307.37
|
+3.84
1.27% |
$308.07
|
251,145
58.68% of 50 DAV
50 DAV is 428,000
|
$340.06
-9.61%
|
4/25/2023
|
$262.85
|
PP = $257.51
|
|
MB = $270.39
|
Most Recent Note - 8/21/2023 5:09:44 PM
G - Still lingering below its 50 DMA line ($319) yet perched only -9.6% off its all-time high. A rebound above the 50 DMA line is needed for its outlook to improve. Fundamentals remain strong after Jun '23 earnings rose +45% on +9% sales revenues versus the year-ago period.
>>> FEATURED STOCK ARTICLE : Pulled Back Undercutting 50 Day Moving Average Line - 7/26/2023 |
View all notes |
Set NEW NOTE alert |
Company Profile |
SEC
News |
Chart |
Request a new note
C
A
S
I |
Symbol/Exchange
Company Name
Industry Group |
PRICE |
CHANGE
(%Change) |
Day High |
Volume
(% DAV)
(% 50 day avg vol) |
52 Wk Hi
% From Hi |
Featured
Date |
Price
Featured |
Pivot Featured |
|
Max Buy |
NVR
-
NYSE
N V R Inc
MATERIALS and CONSTRUCTION - Residential Construction
|
$6,009.22
|
-69.74
-1.15% |
$6,104.57
|
17,108
86.40% of 50 DAV
50 DAV is 19,800
|
$6,474.53
-7.19%
|
4/25/2023
|
$5,882.18
|
PP = $5,978.25
|
|
MB = $6,277.16
|
Most Recent Note - 8/21/2023 5:23:14 PM
Sputtering below its 50 DMA line ($6,201). Reported Jun '23 quarterly earnings -6% on -13% sales revenues, its 2nd subpar quarter, raising greater fundamental concerns. It will be dropped from the Featured Stocks list tonight
>>> FEATURED STOCK ARTICLE : Consolidating Above 50 DMA After 2nd Subpar Earnings Report - 8/7/2023 |
View all notes |
Set NEW NOTE alert |
Company Profile |
SEC
News |
Chart |
Request a new note
C
A
S
I |
PHM
-
NYSE
PulteGroup
Bldg-Resident/Comml
|
$77.96
|
-1.34
-1.69% |
$79.73
|
2,407,697
93.25% of 50 DAV
50 DAV is 2,582,000
|
$86.16
-9.52%
|
4/25/2023
|
$65.17
|
PP = $64.01
|
|
MB = $67.21
|
Most Recent Note - 8/17/2023 5:47:28 PM
G - Volume was +17% above average behind today's big loss violating its 50 DMA line ($79.24) triggering a technical sell signal. Recently reported earnings +18% for the Jun '23 quarter versus the year-ago period, below the +25% minimum guideline (C criteria) raising concerns.
>>> FEATURED STOCK ARTICLE : Reversed After Reaching a New All-Time High - 7/27/2023 |
View all notes |
Set NEW NOTE alert |
Company Profile |
SEC
News |
Chart |
Request a new note
C
A
S
I |
AMPH
-
NASDAQ
Amphastar Pharm
Medical-Biomed/Biotech
|
$53.48
|
+0.61
1.15% |
$53.93
|
207,651
45.34% of 50 DAV
50 DAV is 458,000
|
$67.66
-20.96%
|
5/15/2023
|
$43.56
|
PP = $44.15
|
|
MB = $46.36
|
Most Recent Note - 8/17/2023 5:45:35 PM
G - Slumped further below its 50 DMA line ($56.79) with today's loss and closed near the session low raising concerns. Fundamentals remain strong after it reported Jun '23 quarterly earnings +67% on +18% sales revenues versus the year-ago period.
>>> FEATURED STOCK ARTICLE : 6th Straight Gain for Amphastar - 7/20/2023 |
View all notes |
Set NEW NOTE alert |
Company Profile |
SEC
News |
Chart |
Request a new note
C
A
S
I |
ANET
-
NYSE
Arista Networks
Computer-Networking
|
$184.67
|
+4.13
2.29% |
$186.65
|
1,923,398
59.94% of 50 DAV
50 DAV is 3,209,000
|
$190.65
-3.14%
|
8/1/2023
|
$188.84
|
PP = $178.46
|
|
MB = $187.38
|
Most Recent Note - 8/21/2023 5:16:02 PM
Y - Posted a gain with light volume today for its second-best-ever close. Stubbornly held its ground above the prior high and pivot point. Bullish action came after it reported Jun '23 quarterly earnings +40% on +39% sales revenues versus the year-ago period.
>>> FEATURED STOCK ARTICLE : Hovering Near High with Volume Totals Cooling - 8/14/2023 |
View all notes |
Set NEW NOTE alert |
Company Profile |
SEC
News |
Chart |
Request a new note
C
A
S
I |
LSCC
-
NASDAQ
Lattice Semiconductor
Elec-Semicondctor Fablss
|
$91.19
|
+3.71
4.24% |
$91.50
|
1,655,251
95.02% of 50 DAV
50 DAV is 1,742,000
|
$98.18
-7.12%
|
6/13/2023
|
$91.73
|
PP = $96.92
|
|
MB = $101.77
|
Most Recent Note - 8/21/2023 5:14:35 PM
G - Posted a solid gain today with average volume, rebounding above its 50 DMA line ($90.26) helping its technical stance and outlook to improve. Reported Jun '23 quarterly earnings +24% on +18% sales revenues versus the year-ago period, just below the +25% minimum earnings guideline (C criteria). See the latest FSU analysis for more details and a new annotated graph.
>>> FEATURED STOCK ARTICLE : Rebound Needed Above 50-Day Moving Average for Lattice - 8/17/2023 |
View all notes |
Set NEW NOTE alert |
Company Profile |
SEC
News |
Chart |
Request a new note
C
A
S
I |
Symbol/Exchange
Company Name
Industry Group |
PRICE |
CHANGE
(%Change) |
Day High |
Volume
(% DAV)
(% 50 day avg vol) |
52 Wk Hi
% From Hi |
Featured
Date |
Price
Featured |
Pivot Featured |
|
Max Buy |
XPEL
-
NASDAQ
XPEL
Auto/Truck-Replace Parts
|
$82.45
|
-1.63
-1.94% |
$84.84
|
115,825
89.10% of 50 DAV
50 DAV is 130,000
|
$87.46
-5.73%
|
6/28/2023
|
$83.14
|
PP = $87.11
|
|
MB = $91.47
|
Most Recent Note - 8/21/2023 5:16:57 PM
G - Consolidating with average volume totals, above its 50 DMA line ($81.44). Faces little resistance due to overhead supply up to the $87 level. Fundamentals remain strong.
>>> FEATURED STOCK ARTICLE : Consolidating After Rebounding Above 50-Day Moving Average - 8/2/2023 |
View all notes |
Set NEW NOTE alert |
Company Profile |
SEC
News |
Chart |
Request a new note
C
A
S
I |
ESQ
-
NASDAQ
Esquire Finl Hldgs
Finance-Commercial Loans
|
$47.49
|
-0.35
-0.73% |
$47.87
|
19,866
70.95% of 50 DAV
50 DAV is 28,000
|
$54.03
-12.10%
|
7/14/2023
|
$45.80
|
PP = $48.23
|
|
MB = $50.64
|
Most Recent Note - 8/21/2023 5:13:10 PM
Y - Volume has been below average behind 6 losses in the span of 7 sessions and it is testing prior highs in the $47 area defining important near-term support coinciding with its 50 DMA line.
>>> FEATURED STOCK ARTICLE : Pullback with Light Volume Testing Important Support Level - 8/15/2023 |
View all notes |
Set NEW NOTE alert |
Company Profile |
SEC
News |
Chart |
Request a new note
C
A
S
I |
MEDP
-
NASDAQ
Medpace Holdings
Medical-Research Eqp/Svc
|
$245.98
|
-3.70
-1.48% |
$250.65
|
391,919
105.92% of 50 DAV
50 DAV is 370,000
|
$269.44
-8.71%
|
7/25/2023
|
$196.32
|
PP = $241.57
|
|
MB = $253.65
|
Most Recent Note - 8/21/2023 5:19:03 PM
Y - Pulled back today for a 7th consecutive loss with higher (near average) volume. Its 50 DMA line ($242) and prior highs in the $241 area define important near-term support to watch. Fundamentals remain strong.
>>> FEATURED STOCK ARTICLE : Medpace Posted a Solid Volume-Driven Gain for a New High - 7/25/2023 |
View all notes |
Set NEW NOTE alert |
Company Profile |
SEC
News |
Chart |
Request a new note
C
A
S
I |
COKE
-
NASDAQ
Coca-Cola Consolidated
Beverages-Non-Alcoholic
|
$689.58
|
-6.32
-0.91% |
$693.71
|
19,013
45.27% of 50 DAV
50 DAV is 42,000
|
$745.53
-7.50%
|
8/3/2023
|
$718.56
|
PP = $694.30
|
|
MB = $729.02
|
Most Recent Note - 8/17/2023 5:49:57 PM
G - Volume was below average behind today's 4th consecutive loss, slumping from its all-time high and back below its pivot point raising concerns. Fundamentals remain strong
>>> FEATURED STOCK ARTICLE : Powerful Breakout for COKE - 8/3/2023 |
View all notes |
Set NEW NOTE alert |
Company Profile |
SEC
News |
Chart |
Request a new note
C
A
S
I |
PLUS
-
NASDAQ
ePlus
Computer-Tech Services
|
$61.71
|
-0.40
-0.64% |
$62.54
|
75,453
65.61% of 50 DAV
50 DAV is 115,000
|
$75.90
-18.70%
|
8/8/2023
|
$67.60
|
PP = $62.92
|
|
MB = $66.07
|
Most Recent Note - 8/21/2023 5:25:25 PM
Y - Pulled back with lighter volume today for a 7th consecutive loss, consolidating since a noted "breakaway gap" on 8/08/23. Reported earnings +42% on +25% sales revenues for the Jun '23 quarter versus the year-ago period, its 3rd consecutive quarterly earnings increase above the +25% minimum guideline (C criteria) helping it better match the winning models of the fact-based investment system. Annual earnings growth (A criteria) has been strong.
>>> FEATURED STOCK ARTICLE : ePLUS Gapped Up but Ended in Lower Half of Intra-Day Range - 8/8/2023 |
View all notes |
Set NEW NOTE alert |
Company Profile |
SEC
News |
Chart |
Request a new note
C
A
S
I |
Symbol/Exchange
Company Name
Industry Group |
PRICE |
CHANGE
(%Change) |
Day High |
Volume
(% DAV)
(% 50 day avg vol) |
52 Wk Hi
% From Hi |
Featured
Date |
Price
Featured |
Pivot Featured |
|
Max Buy |
|
|
|
THESE ARE NOT BUY RECOMMENDATIONS!
Comments contained in the body of this report are technical
opinions only. The material herein has been obtained
from sources believed to be reliable and accurate, however,
its accuracy and completeness cannot be guaranteed.
This site is not an investment advisor, hence it does
not endorse or recommend any securities or other investments.
Any recommendation contained in this report may not
be suitable for all investors and it is not to be deemed
an offer or solicitation on our part with respect to
the purchase or sale of any securities. All trademarks,
service marks and trade names appearing in this report
are the property of their respective owners, and are
likewise used for identification purposes only.
This report is a service available
only to active Paid Premium Members.
You may opt-out of receiving report notifications
at any time. Questions or comments may be submitted
by writing to Premium Membership Services 665 S.E. 10 Street, Suite 201 Deerfield Beach, FL 33441-5634 or by calling 1-800-965-8307
or 954-785-1121.
|
|
|