***Last / Change / Volume data in this table is the closing quote data***
Symbol/Exchange
Company Name
Industry Group |
PRICE |
CHANGE
(%Change) |
Day High |
Volume
(% DAV)
(% 50 day avg vol) |
52 Wk Hi
% From Hi |
Featured
Date |
Price
Featured |
Pivot Featured |
|
Max Buy |
 SPSC
-
NASDAQ
SPSC
-
NASDAQ
S P S Commerce Inc
COMPUTER SOFTWARE and SERVICES - Application Software
|
$107.08
|
-0.83
-0.77% |
$110.00
|
151,296
100.86% of 50 DAV
50 DAV is 150,000
|
$115.00
-6.89%
|
6/7/2019
|
$107.72
|
PP = $115.10
|
|
MB = $120.86
|
Most Recent Note - 6/14/2019 10:09:51 AM
Y - Consolidating above its 50 DMA line ($104). Subsequent volume-driven gains above the pivot point are needed to trigger a new (or add-on) technical buy signal. Faces some resistance due to overhead supply up to the $115 level. Recent lows in the $98-99 area define important near-term support to watch. Fundamentals remain strong.
>>> FEATURED STOCK ARTICLE : Base Building Now Above 50-Day Moving Average Line - 6/7/2019 |
View all notes |
Set NEW NOTE alert |
Company Profile |
SEC
News |
Chart |
Request a new note
C
A
S
I |
EPAM
-
NYSE
Epam Systems Inc
COMPUTER SOFTWARE and SERVICES - Information Technology Service
|
$175.00
|
+1.47
0.85% |
$177.54
|
410,966
83.53% of 50 DAV
50 DAV is 492,000
|
$180.55
-3.07%
|
5/9/2019
|
$169.25
|
PP = $180.55
|
|
MB = $189.58
|
Most Recent Note - 6/14/2019 9:56:59 AM
Y - Perched within close striking distance of its 52-week high. Subsequent gains above the pivot point backed by at least +40% above average volume may trigger a new (or add-on) technical buy signal. Rebound above its 50 DMA line ($172) helped its outlook to improve. Fundamentals remain strong. See the latest FSU analysis for more details and a new annotated graph.
>>> FEATURED STOCK ARTICLE : Perched Near Pivot Point After a New Flat Base - 6/13/2019 |
View all notes |
Set NEW NOTE alert |
Company Profile |
SEC
News |
Chart |
Request a new note
C
A
S
I |
ENV
-
NYSE
Envestnet Inc
FINANCIAL SERVICES - Diversified Investments
|
$69.70
|
-0.25
-0.36% |
$70.79
|
250,144
86.26% of 50 DAV
50 DAV is 290,000
|
$72.67
-4.09%
|
3/15/2019
|
$66.05
|
PP = $64.90
|
|
MB = $68.15
|
Most Recent Note - 6/18/2019 6:08:28 PM
G - Reversed early gains today and violated its 50 DMA line ($68.95) ending near the session low. Recently reported earnings +5% on +1% sales revenues for the Mar '19 quarter, below the +25% minimum earnings guideline (C criteria). The prior high ($64.80 on 9/14/18) defines important near-term support to watch.
>>> FEATURED STOCK ARTICLE : Rebound Above 50-Day Moving Average Improved Technical Stance - 6/4/2019 |
View all notes |
Set NEW NOTE alert |
Company Profile |
SEC
News |
Chart |
Request a new note
C
A
S
I |
LHCG
-
NASDAQ
L H C Group Inc
HEALTH SERVICES - Home Health Care
|
$114.22
|
-5.13
-4.30% |
$119.54
|
318,019
129.80% of 50 DAV
50 DAV is 245,000
|
$122.20
-6.53%
|
4/29/2019
|
$110.94
|
PP = $115.64
|
|
MB = $121.42
|
Most Recent Note - 6/17/2019 5:38:30 PM
Y - Quietly traded back above its pivot point with today's gain backed by lighter than average volume. Its 50 DMA line ($112.40) defines near-term support. Fundamentals remain strong. See the latest FSU analysis for more details and a new annotated graph.
>>> FEATURED STOCK ARTICLE : Prior Gains Lacked Volume; 50-Day Moving Average Defines Support - 6/17/2019 |
View all notes |
Set NEW NOTE alert |
Company Profile |
SEC
News |
Chart |
Request a new note
C
A
S
I |
ENSG
-
NASDAQ
Ensign Group Inc
HEALTH SERVICES - Long-Term Care Facilities
|
$57.29
|
-0.33
-0.57% |
$58.19
|
359,132
119.31% of 50 DAV
50 DAV is 301,000
|
$58.35
-1.82%
|
4/30/2019
|
$51.46
|
PP = $53.30
|
|
MB = $55.97
|
Most Recent Note - 6/18/2019 6:17:12 PM
Y - Touched a new high today but ended the session lower following 4 consecutive gains. Its 50 DMA line ($53.10) and recent low ($52.34 on 5/31/19) define near-term support to watch. Recently reported earnings +22% on +12% sales revenues for the Mar '19 quarter, below the +25% minimum earnings guideline (C criteria), raising fundamental concerns.
>>> FEATURED STOCK ARTICLE : Resilient After Latest Quarterly Report Missed Minimum Guideline - 6/3/2019 |
View all notes |
Set NEW NOTE alert |
Company Profile |
SEC
News |
Chart |
Request a new note
C
A
S
I |
Symbol/Exchange
Company Name
Industry Group |
PRICE |
CHANGE
(%Change) |
Day High |
Volume
(% DAV)
(% 50 day avg vol) |
52 Wk Hi
% From Hi |
Featured
Date |
Price
Featured |
Pivot Featured |
|
Max Buy |
CHDN
-
NASDAQ
Churchill Downs Inc
LEISURE - Gaming Activities
|
$113.43
|
-2.51
-2.16% |
$117.14
|
370,750
114.43% of 50 DAV
50 DAV is 324,000
|
$116.65
-2.76%
|
6/5/2019
|
$108.87
|
PP = $104.96
|
|
MB = $110.21
|
Most Recent Note - 6/17/2019 1:10:38 PM
G - Hovering near its all-time high, holding its ground stubbornly following a recent streak of 8 consecutive gains. Prior highs in the $104 area define initial support to watch on pullbacks. Share price was impacted by a 3:1 split when noted on 1/28/19.
>>> FEATURED STOCK ARTICLE : Consolidating Near 50-Day Moving Average - 6/29/2018 |
View all notes |
Set NEW NOTE alert |
Company Profile |
SEC
News |
Chart |
Request a new note
C
A
S
I |
WWD
-
NASDAQ
Woodward Inc
MANUFACTURING - Diversified Machinery
|
$114.48
|
+2.60
2.32% |
$115.07
|
484,172
112.86% of 50 DAV
50 DAV is 429,000
|
$116.46
-1.70%
|
6/18/2019
|
$112.34
|
PP = $114.65
|
|
MB = $120.38
|
Most Recent Note - 6/18/2019 6:13:16 PM
Y - Color code was changed to yellow with pivot point cited based on its 4/30/19 high plus 10 cents. Perched near its all-time high, however, recent gains lacked great volume conviction. Subsequent gains above the pivot point backed by at least +40% above average volume may clinch a convincing technical buy signal. Reported earnings +71% on +38% sales revenues for the quarter ended March 31, 2019 versus the year ago period, its 5th consecutive quarterly earnings increase above the +25% minimum earnings (C criteria) guideline. Annual earnings history has been steady. See the latest FSU analysis for more details and a new annotated graph.
>>> FEATURED STOCK ARTICLE : High Ranked Industrial Firm Perched Near All-Time High - 6/18/2019 |
View all notes |
Set NEW NOTE alert |
Company Profile |
SEC
News |
Chart |
Request a new note
C
A
S
I |
LULU
-
NASDAQ
Lululemon Athletica
MANUFACTURING - Textile Manufacturing
|
$186.50
|
-0.60
-0.32% |
$190.52
|
2,365,148
114.04% of 50 DAV
50 DAV is 2,074,000
|
$189.00
-1.32%
|
6/13/2019
|
$174.48
|
PP = $179.60
|
|
MB = $188.58
|
Most Recent Note - 6/18/2019 6:21:32 PM
Y - Hit a new all-time high with today's 4th consecutive volume-driven gain. The prior gain clinched a new (or add-on) technical buy signal. Reported Apr '19 quarterly earnings +35% on +20% sales revenues versus the ear ago period. The 50 DMA line ($173) and prior low ($160.88 on 5/29/19) define important support near prior highs.
>>> FEATURED STOCK ARTICLE : Perched Near High Following Another Strong Earnings Report - 6/14/2019 |
View all notes |
Set NEW NOTE alert |
Company Profile |
SEC
News |
Chart |
Request a new note
C
A
S
I |
ULTA
-
NASDAQ
Ulta Beauty Inc
SPECIALTY RETAIL - Specialty Retail, Other
|
$358.34
|
+0.50
0.14% |
$365.54
|
743,500
101.85% of 50 DAV
50 DAV is 730,000
|
$359.69
-0.38%
|
3/15/2019
|
$341.27
|
PP = $322.59
|
|
MB = $338.72
|
Most Recent Note - 6/19/2019 5:02:30 PM
G - Posted a solid gain today with below average volume as it challenged it all-time high. Recent rebound above its 50 DMA line ($344) helped its outlook to improve. Reported earnings +17% on +13% sales revenues for the Apr '19 quarter, below the +25% minimum earnings guideline (C criteria), raising fundamental concerns.
>>> FEATURED STOCK ARTICLE : Sputtering Below 50-Day Moving Average Following Sub Par Earnings - 6/6/2019 |
View all notes |
Set NEW NOTE alert |
Company Profile |
SEC
News |
Chart |
Request a new note
C
A
S
I |
ESNT
-
NYSE
Essent Group Ltd
Finance-MrtgandRel Svc
|
$49.27
|
-0.32
-0.65% |
$50.08
|
489,928
80.32% of 50 DAV
50 DAV is 610,000
|
$50.51
-2.45%
|
3/18/2019
|
$45.84
|
PP = $45.06
|
|
MB = $47.31
|
Most Recent Note - 6/18/2019 6:25:34 PM
G - Posted a gain today with higher volume while challenging its high. Consolidating near its all-time high, it found support above its 50 DMA line ($47.20) in recent months. Recently reported earnings +15% on +20% sales revenues for the Mar '19 quarter, below the +25% minimum earnings guideline (C criteria), raising fundamental concerns.
>>> FEATURED STOCK ARTICLE : Still Hovering Not Far From 52-Week High - 6/5/2019 |
View all notes |
Set NEW NOTE alert |
Company Profile |
SEC
News |
Chart |
Request a new note
C
A
S
I |
Symbol/Exchange
Company Name
Industry Group |
PRICE |
CHANGE
(%Change) |
Day High |
Volume
(% DAV)
(% 50 day avg vol) |
52 Wk Hi
% From Hi |
Featured
Date |
Price
Featured |
Pivot Featured |
|
Max Buy |
NOW
-
NYSE
Servicenow Inc
Computer Sftwr-Enterprse
|
$288.80
|
+3.29
1.15% |
$292.98
|
1,732,783
100.51% of 50 DAV
50 DAV is 1,724,000
|
$285.83
1.04%
|
4/22/2019
|
$242.64
|
PP = $251.75
|
|
MB = $264.34
|
Most Recent Note - 6/18/2019 6:23:50 PM
G - It did not form a sound base yet hit a new all-time high with today's volume-driven gain. Its 50 DMA line ($262) and prior high ($251.65 on 3/21/19) define near-term support to watch on pullbacks. Recently reported earnings +20% on +34% sales revenues for the Mar '19 quarter, below the +25% minimum earnings guideline (C criteria), raising fundamental concerns.
>>> FEATURED STOCK ARTICLE : Leader Consolidating Above 50-Day Moving Average Line - 5/29/2019 |
View all notes |
Set NEW NOTE alert |
Company Profile |
SEC
News |
Chart |
Request a new note
C
A
S
I |
QLYS
-
NASDAQ
Qualys Inc
Computer Sftwr-Security
|
$89.74
|
+0.78
0.88% |
$91.09
|
265,723
83.38% of 50 DAV
50 DAV is 318,700
|
$98.30
-8.71%
|
5/23/2019
|
$90.43
|
PP = $98.40
|
|
MB = $103.32
|
Most Recent Note - 6/18/2019 6:27:17 PM
G - Posted a small gain today with light volume while consolidating near its 50 DMA line ($86.56) after finding prompt support near its 200 DMA line. It is only -11% off its 52-week high, however, its Relative Strength Rating of 60 is below the 80+ minimum guideline for buy candidates. Met stubborn resistance in the $97-98 area. Reported earnings +36% on +16% sales revenues for the Mar '19 quarter, continuing its strong earnings history.
>>> FEATURED STOCK ARTICLE : Encountering Distributional Pressure in Recent Weeks - 6/11/2019 |
View all notes |
Set NEW NOTE alert |
Company Profile |
SEC
News |
Chart |
Request a new note
C
A
S
I |
VEEV
-
NYSE
Veeva Systems Inc Cl A
Computer Sftwr-Medical
|
$171.15
|
+1.36
0.80% |
$173.65
|
1,938,125
144.53% of 50 DAV
50 DAV is 1,341,000
|
$170.04
0.65%
|
5/30/2019
|
$154.32
|
PP = $145.80
|
|
MB = $153.09
|
Most Recent Note - 6/17/2019 1:21:23 PM
G -Very extended from any sound base and perched near its all-time high, holding its ground after 7 consecutive gains marked by volume. Reported earnings +52% on +25% sales revenues for the Apr '19 quarter, marking its 5th strong quarter with earnings above the +25% minimum guideline (C criteria).
>>> FEATURED STOCK ARTICLE : Big Volume-Driven Gain for New High Following Earnings News - 5/30/2019 |
View all notes |
Set NEW NOTE alert |
Company Profile |
SEC
News |
Chart |
Request a new note
C
A
S
I |
PAYC
-
NYSE
Paycom Software Inc
COMPUTER SOFTWARE and SERVICES - Application Software
|
$230.15
|
+4.26
1.89% |
$233.43
|
956,537
128.74% of 50 DAV
50 DAV is 743,000
|
$230.90
-0.32%
|
2/6/2019
|
$171.66
|
PP = $164.18
|
|
MB = $172.39
|
Most Recent Note - 6/17/2019 1:22:37 PM
G - Extended from any sound base, and there was a "negative reversal" on 6/10/19 after hitting a new all-time high. Its 50 DMA line ($203) defines near-term support to watch above the recent low ($194.84 on 6/03/19). Reported earnings +25% on +30% sales revenues for the Mar '19 quarter.
>>> FEATURED STOCK ARTICLE : Posted Volume-Driven Gain While Hovering Near All-Time High - 5/31/2019 |
View all notes |
Set NEW NOTE alert |
Company Profile |
SEC
News |
Chart |
Request a new note
C
A
S
I |
PYPL
-
NASDAQ
Paypal Holdings Inc
Finance-CrdtCard/PmtPr
|
$118.79
|
+1.65
1.41% |
$119.95
|
5,431,628
91.81% of 50 DAV
50 DAV is 5,916,000
|
$118.65
0.12%
|
1/24/2019
|
$92.56
|
PP = $93.80
|
|
MB = $98.49
|
Most Recent Note - 6/19/2019 4:59:59 PM
G - Perched near its all-time high with no resistance remaining due to overhead supply. It did not form a sound base yet promptly rebounded after violating its 50 DMA line and prior low ($106.52) on 6/03/19 triggering technical sell signals. Recently reported earnings +37% on +12% sales revenues for the Mar '19 quarter, continuing its strong earnings track record. See the latest FSU analysis for more details and a new annotated graph.
>>> FEATURED STOCK ARTICLE : Popular Payments Firm Extended From Any Sound Base - 6/19/2019 |
View all notes |
Set NEW NOTE alert |
Company Profile |
SEC
News |
Chart |
Request a new note
C
A
S
I |
Symbol/Exchange
Company Name
Industry Group |
PRICE |
CHANGE
(%Change) |
Day High |
Volume
(% DAV)
(% 50 day avg vol) |
52 Wk Hi
% From Hi |
Featured
Date |
Price
Featured |
Pivot Featured |
|
Max Buy |
PLNT
-
NYSE
Planet Fitness Inc Cl A
Leisure-Services
|
$78.19
|
-2.16
-2.69% |
$80.54
|
1,728,515
128.13% of 50 DAV
50 DAV is 1,349,000
|
$81.90
-4.53%
|
11/7/2018
|
$57.10
|
PP = $55.45
|
|
MB = $58.22
|
Most Recent Note - 6/18/2019 6:11:15 PM
G - Touched a new high today but ended the session lower following 4 consecutive gains marked by below average volume. It did not form a sound base yet found support above its 50 DMA line ($75.92) and prior low during the recent consolidation. Violations would raise concerns and trigger technical sell signals. Fundamentals remain strong.
>>> FEATURED STOCK ARTICLE : Pulling Back From High After Impressive Rally - 5/23/2019 |
View all notes |
Set NEW NOTE alert |
Company Profile |
SEC
News |
Chart |
Request a new note
C
A
S
I |
BLD
-
NYSE
Topbuild Corp
Bldg-Constr Prds/Misc
|
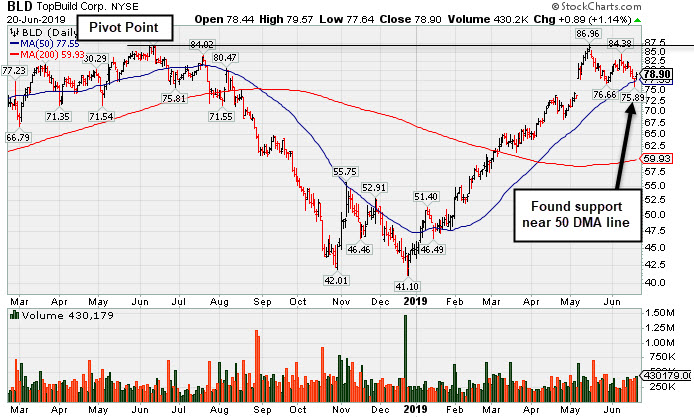
$78.90
|
+0.89
1.14% |
$79.57
|
430,179
130.75% of 50 DAV
50 DAV is 329,000
|
$86.96
-9.27%
|
5/17/2019
|
$82.19
|
PP = $87.31
|
|
MB = $91.68
|
Most Recent Note - 6/17/2019 5:39:52 PM
Y - Pulled back today with slightly higher volume indicative of distributional pressure. Remains within striking distance of its 52-week high. Subsequent gains above the pivot point backed by at least +40% above average volume may trigger a technical buy signal. Fundamentals remain strong.
>>> FEATURED STOCK ARTICLE : Found Support at 50-Day Moving Averge Line - 6/20/2019 |
View all notes |
Set NEW NOTE alert |
Company Profile |
SEC
News |
Chart |
Request a new note
C
A
S
I |
TEAM
-
NASDAQ
Atlassian Corp Plc Cl A
Comp Sftwr-Spec Enterprs
|
$135.05
|
+2.28
1.72% |
$137.45
|
1,003,034
55.94% of 50 DAV
50 DAV is 1,793,000
|
$137.78
-1.98%
|
5/24/2019
|
$129.52
|
PP = $132.09
|
|
MB = $138.69
|
Most Recent Note - 6/19/2019 5:04:00 PM
Y - Posted a gain today with below average volume for its second best close ever. The 50 DMA line ($120) and prior low ($115.87 on 6/03/19) define important neat-term support to watch. Reported earnings +133% on +38% sales revenues for the Mar '19 quarter, continuing its strong earnings track record.
>>> FEATURED STOCK ARTICLE : Perched Near All-Time High After "3-Weeks Tight" - 5/24/2019 |
View all notes |
Set NEW NOTE alert |
Company Profile |
SEC
News |
Chart |
Request a new note
C
A
S
I |
UPLD
-
NASDAQ
Upland Software Inc
Computer Sftwr-Enterprse
|
$51.22
|
-0.01
-0.02% |
$53.30
|
498,047
95.23% of 50 DAV
50 DAV is 523,000
|
$54.87
-6.65%
|
6/10/2019
|
$53.30
|
PP = $50.74
|
|
MB = $53.28
|
Most Recent Note - 6/17/2019 5:46:11 PM
Y - Posted a gain today with average volume for its second best close ever. Abruptly retreated into the prior base raising concerns with volume-driven losses last week. Its 50 DMA line ($45.87) defines near-term support to watch. Highlighted in yellow in the 6/10/19 mid-day report with pivot point cited based on its 5/17/19 high plus 10 cents as it rose from an advanced ascending base. Completed a new Public Offering on 5/08/19. Quarterly comparisons through Mar '19 have shown impressive sales revenues growth and greatly improved earnings increases above the +25% minimum guideline (C criteria).
>>> FEATURED STOCK ARTICLE : Rose From an Advanced Ascending Base - 6/10/2019 |
View all notes |
Set NEW NOTE alert |
Company Profile |
SEC
News |
Chart |
Request a new note
C
A
S
I |
GLOB
-
NYSE
Globant SA
Computer-Tech Services
|
$103.53
|
+1.39
1.36% |
$104.25
|
318,559
80.65% of 50 DAV
50 DAV is 395,000
|
$104.14
-0.59%
|
2/15/2019
|
$69.35
|
PP = $70.00
|
|
MB = $73.50
|
Most Recent Note - 6/17/2019 5:41:53 PM
G - Posted a small gain today with below average volume for a best-ever close. Very extended from any sound base. Its 50 DMA line ($85.76) defines important support where a violation would raise concerns and trigger a technical sell signal. Fundamentals remain strong.
>>> FEATURED STOCK ARTICLE : Posted Big Gain for Another New High Close - 6/12/2019 |
View all notes |
Set NEW NOTE alert |
Company Profile |
SEC
News |
Chart |
Request a new note
C
A
S
I |
Symbol/Exchange
Company Name
Industry Group |
PRICE |
CHANGE
(%Change) |
Day High |
Volume
(% DAV)
(% 50 day avg vol) |
52 Wk Hi
% From Hi |
Featured
Date |
Price
Featured |
Pivot Featured |
|
Max Buy |