You are not logged in.
This means you
CAN ONLY VIEW reports that were published prior to Wednesday, April 23, 2025.
You
MUST UPGRADE YOUR MEMBERSHIP if you want to see any current reports.
AFTER MARKET UPDATE - WEDNESDAY, APRIL 5TH, 2023
Previous After Market Report Next After Market Report >>>
|
|
|
|
DOW |
+80.34 |
33,482.72 |
+0.24% |
|
Volume |
914,489,770 |
-1% |
|
Volume |
4,376,576,300 |
+3% |
|
NASDAQ |
-129.47 |
11,996.86 |
-1.07% |
|
Advancers |
1,073 |
37% |
|
Advancers |
1,515 |
34% |
|
S&P 500 |
-10.22 |
4,090.38 |
-0.25% |
|
Decliners |
1,818 |
63% |
|
Decliners |
2,966 |
66% |
|
Russell 2000 |
-17.52 |
1,752.13 |
-0.99% |
|
52 Wk Highs |
27 |
|
|
52 Wk Highs |
61 |
|
|
S&P 600 |
-9.54 |
1,149.81 |
-0.82% |
|
52 Wk Lows |
51 |
|
|
52 Wk Lows |
174 |
|
|
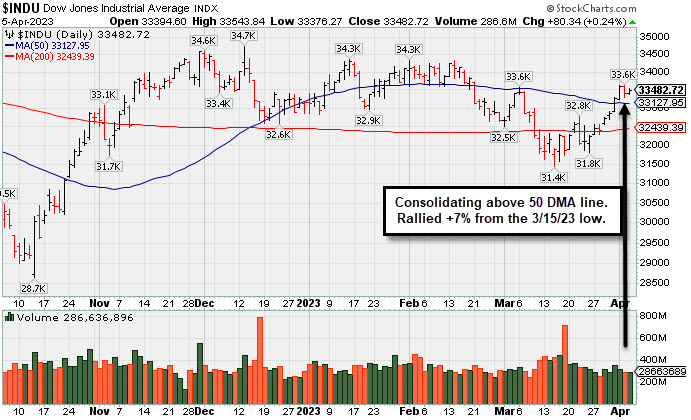
Last Wednesday's gains with higher volume and greater leadership marked a follow-through day confirming a new uptrend. New buying efforts may be made based on the (M criteria) of the fact-based investment system. Disciplined investors know to only buy stocks meeting all key criteria.
|
 |
Major Indexes Were Mixed With Less Leadership
Kenneth J. Gruneisen - Passed the CAN SLIM® Master's Exam
The Dow added 80 points (0.2%) while the Nasdaq Composite declined 1.1%. The S&P 500 decreased 0.3%. Volume totals reported were mixed, lighter than the prior session on the NYSE and higher on the Nasdaq exchange. Breadth was negative as decliners led advancers by more than a 3-2 margin on the NYSE and by almost 2-1 on the Nasdaq exchange. Leadership thinned as there were 13 high-ranked companies from the Leaders List that hit a new 52-week high and were listed on the BreakOuts Page, versus the total of 30 on the prior session. New 52-week lows totals expanded and outnumbered shrinking new 52-week highs totals on the NYSE and on the Nasdaq exchange. The major indices are in a confirmed uptrend (M criteria). Appropriate new buying efforts may be considered under the fact-based investment system.
PICTURED: The Nasdaq Composite Index is quietly consolidating after rebounding near its February high. The tech heavy index has made steady progress since its 50-day moving average (DMA) line crossed above its 200-day moving average, a bullish technical signal termed a "golden cross".
Seven of the eleven sectors finished in negative territory as U.S. equities finished mixed Wednesday. Investors continued to assess this week’s slowing jobs data. March’s easing data may suggest the Federal Reserve’s (Fed) efforts to tame the resilient labor market might finally be working.
On the data front, Mortgage Bankers Association (MBA) mortgage applications for the week ended March 31 fell 4.1%, reversing the last four weeks of positive readings and down from the prior week’s 2.9% gain, as the 30-year mortgage rate fell to a seven-week low of 6.4%. Elsewhere, the Institute of Supply Management’s (ISM) Services Index fell more than expected in March to 51.2 from February’s 55.1 reading. While the reading still shows expansionary traits, the services sector expanded at a much slower pace as new orders growth weakened along with softer business activities.
Treasuries strengthened, with the yield on the 10-year note down four basis points (0.04%) to 3.30%, while the 30-year bond yield fell four basis points (0.04%) to 3.56%. The yield on the two-year note, which is more sensitive to changes in Fed policy, shed four basis points (0.04%) to 3.79%. In commodities, West Texas Intermediate (WTI) crude declined 0.3% to $80.44/barrel amid greater-than-expected drawdowns in U.S. crude oil inventories, dropping 3.7 million barrels in the last week to 470 million barrels. In the metals complex, gold is up 0.1% as investors continued to seek a perceived safe haven during times of uncertainty.
|
 Kenneth J. Gruneisen started out as a licensed stockbroker in August 1987, a couple of months prior to the historic stock market crash that took the Dow Jones Industrial Average down -22.6% in a single day. He has published daily fact-based fundamental and technical analysis on high-ranked stocks online for two decades. Through FACTBASEDINVESTING.COM, Kenneth provides educational articles, news, market commentary, and other information regarding proven investment systems that work in good times and bad.
Comments contained in the body of this report are technical opinions only and are not necessarily those of Gruneisen Growth Corp. The material herein has been obtained from sources believed to be reliable and accurate, however, its accuracy and completeness cannot be guaranteed. Our firm, employees, and customers may effect transactions, including transactions contrary to any recommendation herein, or have positions in the securities mentioned herein or options with respect thereto. Any recommendation contained in this report may not be suitable for all investors and it is not to be deemed an offer or solicitation on our part with respect to the purchase or sale of any securities. |
|
 |
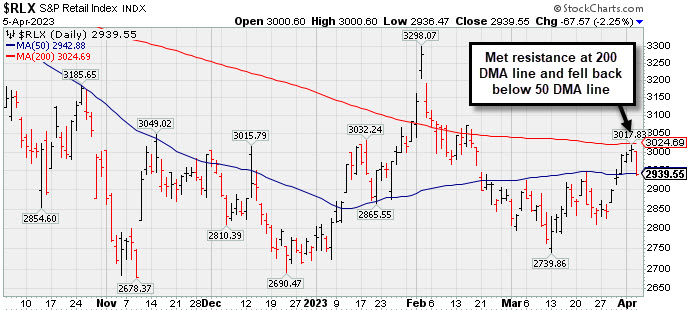
Retail, Financial, and Semiconductor Indexes Led Group Decliners
Kenneth J. Gruneisen - Passed the CAN SLIM® Master's Exam
The Retail Index ($RLX -2.25%) created a drag on the major averages along with weakness in the Broker/Dealer Index ($XBD -1.87%) and Bank Index ($BKX -0.50%). The Semiconductor Index ($SOX -1.80%) led the tech sector lower while the Networking Index ($NWX -0.56%) also ended with a small loss while the Biotech Index ($BTK +0.56%) edged higher. The Integrated Oil Index ($XOI +1.86%) posted a solid gain while the Oil Services Index ($OSX -0.29%) edged lower and the Gold & Silver Index ($XAU +0.13%) was little changed.
PICTURED: The Retail Index ($RLX -2.25%) met resistance at its 200-day moving average (DMA) line and slumped to close just below its 50 DMA line.
| Oil Services |
$OSX |
80.99 |
-0.24 |
-0.29% |
-3.42% |
| Integrated Oil |
$XOI |
1,802.59 |
+32.93 |
+1.86% |
+0.86% |
| Semiconductor |
$SOX |
3,085.97 |
-56.53 |
-1.80% |
+21.87% |
| Networking |
$NWX |
835.67 |
-4.75 |
-0.56% |
+6.68% |
| Broker/Dealer |
$XBD |
437.83 |
-8.33 |
-1.87% |
-2.52% |
| Retail |
$RLX |
2,939.55 |
-67.57 |
-2.25% |
+6.74% |
| Gold & Silver |
$XAU |
138.20 |
+0.18 |
+0.13% |
+14.35% |
| Bank |
$BKX |
79.58 |
-0.40 |
-0.50% |
-21.09% |
| Biotech |
$BTK |
5,321.81 |
+29.47 |
+0.56% |
+0.77% |
|
|
|
 |
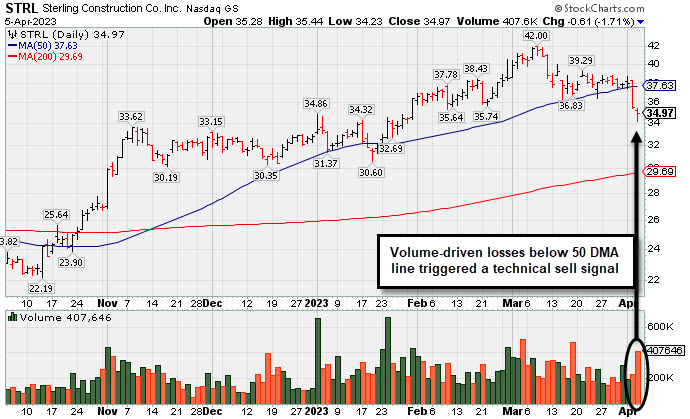
Volume-Driven 50-Day Moving Average Violation Triggered Sell Signal
Kenneth J. Gruneisen - Passed the CAN SLIM® Master's Exam
Sterling Infrastructure (STRL -$0.61 or -1.71% to $34.97) suffered damaging volume-driven losses as it violated its 50-day moving average DMA line ($37.63) and slumped below the recent lows in the mid-$36 area triggering technical sell signals. Only a prompt rebound above the 50 DMA line would help its outlook improve.
STRL hails from the Building - Heavy Construction industry group which is currently ranked 66th on the 197 Industry Groups list (L criteria). It has a 99 Earnings Per Share Rating. It reported Dec '22 quarterly earnings +74% on 26% sales revenues versus the year ago period, its 6th quarterly comparison at or above the +25% minimum earnings guideline (C criteria). Annual earnings (A criteria) growth has been strong and steady since FY '17.
The company has a small supply of only 30.6 million shares outstanding. That can lead to greater price volatility in the event of institutional buying or selling. The number of top rated funds owning its shares rose from 337 in Dec '21 to 369 in Dec '22. Its current Up/Down Volume Ratio of 1.3 is an unbiased indication its shares have been under accumulation over the past 50 days.
|
|
|
Color Codes Explained :
Y - Better candidates highlighted by our
staff of experts.
G - Previously featured
in past reports as yellow but may no longer be buyable under the
guidelines.
***Last / Change / Volume data in this table is the closing quote data***
Symbol/Exchange
Company Name
Industry Group |
PRICE |
CHANGE
(%Change) |
Day High |
Volume
(% DAV)
(% 50 day avg vol) |
52 Wk Hi
% From Hi |
Featured
Date |
Price
Featured |
Pivot Featured |
|
Max Buy |
 GPK
-
NYSE
GPK
-
NYSE
Graphic Packaging
CONSUMER NON-DURABLES - Packaging and Containers
|
$25.18
|
+0.14
0.56% |
$25.21
|
2,937,360
89.06% of 50 DAV
50 DAV is 3,298,000
|
$25.62
-1.72%
|
10/25/2022
|
$22.75
|
PP = $24.17
|
|
MB = $25.38
|
Most Recent Note - 4/4/2023 8:32:44 PM
Y - Pulled back today with light volume breaking a streak of 8 consecutive gains and closing below its "max buy" level. Recent gains lacked great volume conviction. Its 50 DMA line ($23.93) and recent low ($22.99 on 3/16/23) define important near-term support to watch.
>>> FEATURED STOCK ARTICLE : Found Encouraging Support Near 50-Day Moving Average Line - 3/21/2023 |
View all notes |
Set NEW NOTE alert |
Company Profile |
SEC
News |
Chart |
Request a new note
C
A
S
I |
STRL
-
NASDAQ
Sterling Infrastructure
MATERIALS and; CONSTRUCTION - Heavy Construction
|
$34.97
|
-0.61
-1.71% |
$35.44
|
407,646
147.16% of 50 DAV
50 DAV is 277,000
|
$42.00
-16.74%
|
12/14/2022
|
$32.41
|
PP = $33.72
|
|
MB = $35.41
|
 Most Recent Note - 4/5/2023 6:14:48 PM
G - Suffered damaging losses with above-average volume and violated its 50 DMA line ($37.63) triggering a technical sell signal. Only a prompt rebound above the 50 DMA line would help its outlook improve. See the latest FSU analysis for more details and a new annotated graph.
>>> FEATURED STOCK ARTICLE : Volume-Driven 50-Day Moving Average Violation Triggered Sell Signal - 4/5/2023 |
View all notes |
Set NEW NOTE alert |
Company Profile |
SEC
News |
Chart |
Request a new note
C
A
S
I |
PERI
-
NASDAQ
Perion Network
Comml Svcs-Advertising
|
$40.50
|
-0.67
-1.63% |
$41.19
|
610,578
76.42% of 50 DAV
50 DAV is 799,000
|
$42.04
-3.66%
|
1/25/2023
|
$31.79
|
PP = $33.19
|
|
MB = $34.85
|
Most Recent Note - 4/5/2023 6:18:29 PM
G - Pulled back today with light volume following volume-driven gains for new all-time highs. Its 50 DMA line ($35) defines important near-term support to watch.
>>> FEATURED STOCK ARTICLE : Hit Another New High With Gain Backed by Light Volume - 3/31/2023 |
View all notes |
Set NEW NOTE alert |
Company Profile |
SEC
News |
Chart |
Request a new note
C
A
S
I |
ALGM
-
NASDAQ
Allegro MicroSystems
Elec-Semiconductor Mfg
|
$45.61
|
-0.63
-1.36% |
$46.13
|
1,325,001
78.87% of 50 DAV
50 DAV is 1,680,000
|
$48.72
-6.38%
|
1/31/2023
|
$37.80
|
PP = $38.38
|
|
MB = $40.30
|
Most Recent Note - 4/4/2023 8:15:06 PM
G - Pulled back from its all-time high with today's 2nd consecutive loss with below-average volume. It is extended from the previously noted base. Its 50 DMA line ($43.42) and recent low ($41.30 on 3/18/23) define important near-term support to watch on pullbacks.
>>> FEATURED STOCK ARTICLE : Extended From Prior Base and Perched Near All-Time High - 3/22/2023 |
View all notes |
Set NEW NOTE alert |
Company Profile |
SEC
News |
Chart |
Request a new note
C
A
S
I |
FIX
-
NYSE
Comfort Systems USA
MATERIALS and CONSTRUCTION - General Contractors
|
$131.62
|
-8.58
-6.12% |
$139.33
|
381,071
141.14% of 50 DAV
50 DAV is 270,000
|
$152.13
-13.48%
|
2/23/2023
|
$136.52
|
PP = $128.78
|
|
MB = $135.22
|
Most Recent Note - 4/5/2023 12:45:53 PM
G - Violated its 50 DMA line ($134.03) and undercut the prior lows with today's big loss triggering a technical sell signal. Prior loss with above-average volume was noted as "action indicative of distributional pressure." Only a prompt rebound above the 50 DMA line would help its outlook improve. Fundamentals remain strong.
>>> FEATURED STOCK ARTICLE : Pullback With Higher Volume While Consolidating - 4/4/2023 |
View all notes |
Set NEW NOTE alert |
Company Profile |
SEC
News |
Chart |
Request a new note
C
A
S
I |
Symbol/Exchange
Company Name
Industry Group |
PRICE |
CHANGE
(%Change) |
Day High |
Volume
(% DAV)
(% 50 day avg vol) |
52 Wk Hi
% From Hi |
Featured
Date |
Price
Featured |
Pivot Featured |
|
Max Buy |
KOF
-
NYSE
Coca-Cola Femsa ADR
FOOD and BEVERAGE - Beverages - Soft Drinks
|
$81.59
|
+0.02
0.02% |
$81.81
|
200,930
108.61% of 50 DAV
50 DAV is 185,000
|
$82.41
-1.00%
|
3/7/2023
|
$76.63
|
PP = $77.11
|
|
MB = $80.97
|
Most Recent Note - 4/3/2023 12:20:41 PM
G - Hitting yet another new all-time high and rising above its "max buy" level with today's 5th consecutive gain backed by above-average volume and its color code is changed to green. On pullbacks, prior highs in the $79-$77 area define initial support to watch above its 50 DMA line ($74.73).
>>> FEATURED STOCK ARTICLE : Gain for Best-Ever Close With Near Average Volume - 3/24/2023 |
View all notes |
Set NEW NOTE alert |
Company Profile |
SEC
News |
Chart |
Request a new note
C
A
S
I |
ANET
-
NYSE
Arista Networks
Computer-Networking
|
$162.86
|
-3.88
-2.33% |
$165.75
|
2,145,459
79.67% of 50 DAV
50 DAV is 2,693,000
|
$171.44
-5.00%
|
3/8/2023
|
$147.59
|
PP = $148.67
|
|
MB = $156.10
|
Most Recent Note - 4/5/2023 6:17:08 PM
G - Pulling back from its all-time high with below-average volume. Very extended from any sound base after an impressive spurt of volume-driven gains. Prior highs in the $148-145 area define initial support to watch above its 50 DMA line ($145.77).
>>> FEATURED STOCK ARTICLE : Pulling Back After Getting Very Extended From Prior Base - 3/28/2023 |
View all notes |
Set NEW NOTE alert |
Company Profile |
SEC
News |
Chart |
Request a new note
C
A
S
I |
CLH
-
NYSE
Clean Harbors
Pollution Control
|
$134.07
|
-2.18
-1.60% |
$136.19
|
374,157
88.66% of 50 DAV
50 DAV is 422,000
|
$144.20
-7.02%
|
3/10/2023
|
$136.89
|
PP = $136.74
|
|
MB = $143.58
|
Most Recent Note - 4/4/2023 8:38:46 PM
Y - Pulled back from its all-time high with lighter volume behind today's loss. Its 50 DMA line ($133.71) and recent low ($129.93 on 3/24/23) define near-term support where violations would raise concerns and trigger technical sell signals. Fundamentals remain strong.
>>> FEATURED STOCK ARTICLE : Finding Support Recently at 50-Day Moving Average Line - 3/29/2023 |
View all notes |
Set NEW NOTE alert |
Company Profile |
SEC
News |
Chart |
Request a new note
C
A
S
I |
|
|
|
THESE ARE NOT BUY RECOMMENDATIONS!
Comments contained in the body of this report are technical
opinions only. The material herein has been obtained
from sources believed to be reliable and accurate, however,
its accuracy and completeness cannot be guaranteed.
This site is not an investment advisor, hence it does
not endorse or recommend any securities or other investments.
Any recommendation contained in this report may not
be suitable for all investors and it is not to be deemed
an offer or solicitation on our part with respect to
the purchase or sale of any securities. All trademarks,
service marks and trade names appearing in this report
are the property of their respective owners, and are
likewise used for identification purposes only.
This report is a service available
only to active Paid Premium Members.
You may opt-out of receiving report notifications
at any time. Questions or comments may be submitted
by writing to Premium Membership Services 665 S.E. 10 Street, Suite 201 Deerfield Beach, FL 33441-5634 or by calling 1-800-965-8307
or 954-785-1121.
|
|
|