Symbol/Exchange
Company Name
Industry Group |
PRICE |
CHANGE
(%Change) |
Day High |
Volume
(% DAV)
(% 50 day avg vol) |
52 Wk Hi
% From Hi |
Featured
Date |
Price
Featured |
Pivot Featured |
|
Max Buy |
MLR
-
NYSE
Miller Industries Inc
AUTOMOTIVE - Auto Parts
|
$30.86
|
-0.55
-1.75% |
$31.73
|
40,801
123.64% of 50 DAV
50 DAV is 33,000
|
$35.26
-12.48%
|
11/30/2018
|
$28.35
|
PP = $29.50
|
|
MB = $30.98
|
Most Recent Note - 3/22/2019 12:56:33 PM
G - Undercutting its 50 DMA line ($31.39) with today's loss raising concerns. Prior highs in the $29 area define the next near-term support to watch. Endured mild distributional pressure over the past 2 weeks. Reported earnings +17% on +13% sales revenues for the Dec '18 quarter, below the +25% minimum guideline (C criteria), raising fundamental concerns.
>>> FEATURED STOCK ARTICLE : Extended From Prior Base After Impressive Streak of Gains - 3/1/2019 |
View all notes |
Set NEW NOTE alert |
Company Profile |
SEC
News |
Chart |
Request a new note
C
A
S
I |
NSP
-
NYSE
Insperity Inc
Comml Svcs-Outsourcing
|
$122.62
|
+2.29
1.90% |
$123.52
|
201,840
56.22% of 50 DAV
50 DAV is 359,000
|
$132.50
-7.46%
|
2/11/2019
|
$127.91
|
PP = $121.25
|
|
MB = $127.31
|
Most Recent Note - 3/22/2019 1:14:31 PM
Y - Pulling back today with light volume amid broader market weakness. Consolidating near prior highs in the $119-121 area which define important near-term support to watch.
>>> FEATURED STOCK ARTICLE : Volume Totals Cooling and Consolidating Near Prior Highs - 3/14/2019 |
View all notes |
Set NEW NOTE alert |
Company Profile |
SEC
News |
Chart |
Request a new note
C
A
S
I |
ZBRA
-
NASDAQ
Zebra Tech Corp Cl A
COMPUTER HARDWARE - Computer Peripherals
|
$208.95
|
+3.98
1.94% |
$209.49
|
388,864
83.09% of 50 DAV
50 DAV is 468,000
|
$219.39
-4.76%
|
2/14/2019
|
$198.10
|
PP = $184.85
|
|
MB = $194.09
|
Most Recent Note - 3/25/2019 8:49:46 PM
G - Pulling back from its all-time high for a 2nd consecutive loss, it is very extended from the prior base after wedging higher with recent gains lacking great volume-conviction. Its 50 DMA line ($191) and prior highs in the $184 area define near-term support to watch. See the latest FSU analysis for more details and a new annotated graph.
>>> FEATURED STOCK ARTICLE : Zebra Extended From Prior Base - 3/25/2019 |
View all notes |
Set NEW NOTE alert |
Company Profile |
SEC
News |
Chart |
Request a new note
C
A
S
I |
SPSC
-
NASDAQ
S P S Commerce Inc
COMPUTER SOFTWARE and SERVICES - Application Software
|
$107.12
|
+2.38
2.27% |
$108.03
|
106,109
69.35% of 50 DAV
50 DAV is 153,000
|
$113.31
-5.46%
|
3/26/2019
|
$107.12
|
PP = $113.41
|
|
MB = $119.08
|
 Most Recent Note - 3/26/2019 6:30:58 PM
Y - Color code is changed to yellow with new pivot point cited based on its 2/13/19 high plus 10 cents. Subsequent gains above the pivot point backed by at least +40% above average volume may trigger a new (or add-on) technical buy signal. Still consolidating in an orderly fashion well above prior highs in the $100 area defining support to watch along with its 50 DMA line ($99.53).
>>> FEATURED STOCK ARTICLE : Consolidating in Orderly Fashion Above Prior Highs - 3/22/2019 |
View all notes |
Set NEW NOTE alert |
Company Profile |
SEC
News |
Chart |
Request a new note
C
A
S
I |
SSNC
-
NASDAQ
S S & C Technologies
COMPUTER SOFTWARE and SERVICES - Application Software
|
$62.42
|
+0.71
1.15% |
$62.90
|
1,026,079
57.55% of 50 DAV
50 DAV is 1,783,000
|
$64.36
-3.01%
|
2/15/2019
|
$59.73
|
PP = $61.07
|
|
MB = $64.12
|
Most Recent Note - 3/22/2019 6:50:50 PM
Y - Pulled back from its all-time high with below average volume. Stalled after a 3/01/19 gain above its pivot point backed by +49% above average volume triggered a technical buy signal.
>>> FEATURED STOCK ARTICLE : Volume-Driven Gain for New High Close - 2/19/2019 |
View all notes |
Set NEW NOTE alert |
Company Profile |
SEC
News |
Chart |
Request a new note
C
A
S
I |
Symbol/Exchange
Company Name
Industry Group |
PRICE |
CHANGE
(%Change) |
Day High |
Volume
(% DAV)
(% 50 day avg vol) |
52 Wk Hi
% From Hi |
Featured
Date |
Price
Featured |
Pivot Featured |
|
Max Buy |
IRBT
-
NASDAQ
Irobot Corp
CONSUMER DURABLES - Electronic Equipment
|
$121.27
|
+0.80
0.66% |
$122.45
|
352,564
42.22% of 50 DAV
50 DAV is 835,000
|
$132.88
-8.74%
|
2/8/2019
|
$104.92
|
PP = $103.63
|
|
MB = $108.81
|
Most Recent Note - 3/22/2019 12:59:52 PM
G - Pulling back today with light volume amid broader market weakness. Consolidating near its August '18 high, possibly forming a new base. Recent gains have lacked great volume conviction. It is extended from the previously noted "double bottom" base.
>>> FEATURED STOCK ARTICLE : Consolidating After Getting Extended from Double Bottom Base - 3/12/2019 |
View all notes |
Set NEW NOTE alert |
Company Profile |
SEC
News |
Chart |
Request a new note
C
A
S
I |
AUDC
-
NASDAQ
Audiocodes Ltd
ELECTRONICS - Scientific and Technical Instrum
|
$13.16
|
+0.11
0.84% |
$13.23
|
100,848
39.09% of 50 DAV
50 DAV is 258,000
|
$14.96
-12.03%
|
3/20/2019
|
$13.66
|
PP = $15.06
|
|
MB = $15.81
|
Most Recent Note - 3/22/2019 12:52:11 PM
G - Color code is changed to green while slumping below its 50 DMA line ($13.33) with today's big volume-driven loss raising concerns. Prior lows in the $12.50 area define the next important near-term support. A rebound above the 50 DMA line is needed for its outlook to improve. Highlighted in yellow with pivot point cited based on its 1/28/19 high plus 10 cents in the 3/20/19 mid-day report and noted - "Subsequent gains above the pivot point backed by at least +40% above average volume are needed to trigger a new technical buy signal. This Israel-based Telecom firm found support near prior highs and near its 50 DMA line during an orderly 7-week consolidation. Reported earnings +67% on +11% sales revenues for the Dec '18 quarter. its 8th consecutive quarterly comparison above the +25% minimum guideline (C criteria)."
>>> FEATURED STOCK ARTICLE : Building a Base and Found Support Near 50-Day Moving Average - 3/20/2019 |
View all notes |
Set NEW NOTE alert |
Company Profile |
SEC
News |
Chart |
Request a new note
C
A
S
I |
ENV
-
NYSE
Envestnet Inc
FINANCIAL SERVICES - Diversified Investments
|
$64.60
|
+0.57
0.89% |
$65.42
|
240,414
86.48% of 50 DAV
50 DAV is 278,000
|
$67.52
-4.32%
|
3/15/2019
|
$66.05
|
PP = $64.90
|
|
MB = $68.15
|
Most Recent Note - 3/21/2019 5:26:10 PM
Y - Posted a gain today with average volume, trading near its all-time high. Finished strong after highlighted in yellow with pivot point cited based on its 9/14/18 high plus 10 cents in the 3/15/19 mid-day report.
>>> FEATURED STOCK ARTICLE : Volume Heavy Behind Rally to New Highs - 3/15/2019 |
View all notes |
Set NEW NOTE alert |
Company Profile |
SEC
News |
Chart |
Request a new note
C
A
S
I |
LHCG
-
NASDAQ
L H C Group Inc
HEALTH SERVICES - Home Health Care
|
$110.14
|
+0.22
0.20% |
$110.86
|
176,026
68.49% of 50 DAV
50 DAV is 257,000
|
$115.54
-4.67%
|
1/23/2019
|
$107.29
|
PP = $107.61
|
|
MB = $112.99
|
Most Recent Note - 3/22/2019 6:56:14 PM
Y - There was a "negative reversal" today after hitting a new all-time high. Recently found support at its 50 DMA line and formed a base-on-base. Bullish action came after it reported earnings +66% on +75% sales revenues for the Dec '18 quarter.
>>> FEATURED STOCK ARTICLE : Recent Gains for New Highs Lacked Great Volume Conviction - 2/21/2019 |
View all notes |
Set NEW NOTE alert |
Company Profile |
SEC
News |
Chart |
Request a new note
C
A
S
I |
ENSG
-
NASDAQ
Ensign Group Inc
HEALTH SERVICES - Long-Term Care Facilities
|
$49.54
|
-0.07
-0.14% |
$49.99
|
179,452
56.61% of 50 DAV
50 DAV is 317,000
|
$54.56
-9.20%
|
2/7/2019
|
$48.71
|
PP = $49.06
|
|
MB = $51.51
|
Most Recent Note - 3/22/2019 6:54:53 PM
Y - Recently consolidating above prior highs in the $48 area, and above its 50 DMA line ($47.26) defining the next important near-term support level to watch.
>>> FEATURED STOCK ARTICLE : Consolidating Near Proir High and Above 50-Day Average - 3/11/2019 |
View all notes |
Set NEW NOTE alert |
Company Profile |
SEC
News |
Chart |
Request a new note
C
A
S
I |
Symbol/Exchange
Company Name
Industry Group |
PRICE |
CHANGE
(%Change) |
Day High |
Volume
(% DAV)
(% 50 day avg vol) |
52 Wk Hi
% From Hi |
Featured
Date |
Price
Featured |
Pivot Featured |
|
Max Buy |
NXST
-
NASDAQ
Nexstar Media Group Cl A
MEDIA - Broadcasting - TV
|
$107.76
|
+2.01
1.90% |
$108.13
|
463,006
88.87% of 50 DAV
50 DAV is 521,000
|
$109.55
-1.63%
|
2/26/2019
|
$94.26
|
PP = $89.76
|
|
MB = $94.25
|
Most Recent Note - 3/21/2019 5:27:32 PM
G - Posted a solid gain today with above average volume hitting a new all-time high. Disciplined investors avoid chasing stocks more than +5% above the prior high.
>>> FEATURED STOCK ARTICLE : Twice Average Volume Behind Gain for New High - 2/26/2019 |
View all notes |
Set NEW NOTE alert |
Company Profile |
SEC
News |
Chart |
Request a new note
C
A
S
I |
BSTC
-
NASDAQ
Biospecifics Technologie
Medical-Biomed/Biotech
|
$65.15
|
+0.07
0.11% |
$65.83
|
41,078
93.36% of 50 DAV
50 DAV is 44,000
|
$73.31
-11.13%
|
1/18/2019
|
$67.40
|
PP = $66.31
|
|
MB = $69.63
|
Most Recent Note - 3/25/2019 12:12:51 PM
G - Color code is changed to green. Slumped below its 50 DMA line raising concerns and triggering a technical sell signal. A rebound above the 50 DMA line ($67.07) is needed for its outlook to improve. Thomas L. Wegman, President of BioSpecifics, passed away on March 13, 2019. Due to report earnings news. Volume and volatility often increase near earnings news.
>>> FEATURED STOCK ARTICLE : Consolidating Above 50-Day Moving Average and Prior Highs - 3/7/2019 |
View all notes |
Set NEW NOTE alert |
Company Profile |
SEC
News |
Chart |
Request a new note
C
A
S
I |
ULTA
-
NASDAQ
Ulta Beauty Inc
SPECIALTY RETAIL - Specialty Retail, Other
|
$342.90
|
+6.23
1.85% |
$345.63
|
844,966
105.62% of 50 DAV
50 DAV is 800,000
|
$345.24
-0.68%
|
3/15/2019
|
$341.27
|
PP = $322.59
|
|
MB = $338.72
|
Most Recent Note - 3/22/2019 6:52:32 PM
Y - Pulled back from its all-time high with a loss today on light volume. A big "breakaway gap" on 3/15/19 backed by heavy volume triggered a technical buy signal. Bullish action came after it reported earnings +31% sales revenues on +10% sales revenues for the Jan '19 quarter.
>>> FEATURED STOCK ARTICLE : Consolidating Following Big "Breakaway Gap" - 3/19/2019 |
View all notes |
Set NEW NOTE alert |
Company Profile |
SEC
News |
Chart |
Request a new note
C
A
S
I |
UBNT
-
NASDAQ
Ubiquiti Networks
TELECOMMUNICATIONS - Diversified Communication Serv
|
$145.16
|
+1.36
0.95% |
$145.33
|
130,832
36.85% of 50 DAV
50 DAV is 355,000
|
$148.68
-2.37%
|
2/8/2019
|
$121.97
|
PP = $115.54
|
|
MB = $121.32
|
Most Recent Note - 3/22/2019 6:51:44 PM
G - Still perched near its all-time high with volume totals cooling, very extended from the prior base. Fundamentals remain strong. Prior high ($115) defines initial support to watch on pullbacks.
>>> FEATURED STOCK ARTICLE : Bullish Action Came Following Another Strong Earnings Report - 3/5/2019 |
View all notes |
Set NEW NOTE alert |
Company Profile |
SEC
News |
Chart |
Request a new note
C
A
S
I |
ESNT
-
NYSE
Essent Group Ltd
Finance-MrtgandRel Svc
|
$43.26
|
+0.58
1.36% |
$43.59
|
570,615
92.33% of 50 DAV
50 DAV is 618,000
|
$47.94
-9.76%
|
3/18/2019
|
$45.84
|
PP = $45.06
|
|
MB = $47.31
|
Most Recent Note - 3/25/2019 12:34:15 PM
Y - Today's 4th volume-driven loss in the span of 5 sessions has it slumping further into the prior base. Prior low and its 50 DMA line define important near-term support in the $42 area. Negated the recent breakout and it was repeatedly noted - "Faces some resistance due to overhead supply up to the $50 level."
>>> FEATURED STOCK ARTICLE : Big Breakout Gain With +350% Above Average Volume - 3/18/2019 |
View all notes |
Set NEW NOTE alert |
Company Profile |
SEC
News |
Chart |
Request a new note
C
A
S
I |
Symbol/Exchange
Company Name
Industry Group |
PRICE |
CHANGE
(%Change) |
Day High |
Volume
(% DAV)
(% 50 day avg vol) |
52 Wk Hi
% From Hi |
Featured
Date |
Price
Featured |
Pivot Featured |
|
Max Buy |
NOW
-
NYSE
Servicenow Inc
Computer Sftwr-Enterprse
|
$245.00
|
+3.30
1.37% |
$247.24
|
1,351,113
63.70% of 50 DAV
50 DAV is 2,121,000
|
$251.65
-2.64%
|
1/31/2019
|
$218.14
|
PP = $206.40
|
|
MB = $216.72
|
Most Recent Note - 3/26/2019 3:49:19 PM
G - Perched near its all-time high, extended from any sound base. Its 50 DMA line ($224) and recent low ($226) define near-term support to watch on pullbacks.
>>> FEATURED STOCK ARTICLE : Pulling Back After 6 Straight Weekly Gains - 3/6/2019 |
View all notes |
Set NEW NOTE alert |
Company Profile |
SEC
News |
Chart |
Request a new note
C
A
S
I |
PANW
-
NYSE
Palo Alto Networks
Computer Sftwr-Security
|
$244.20
|
+2.37
0.98% |
$246.94
|
1,043,376
72.21% of 50 DAV
50 DAV is 1,445,000
|
$260.63
-6.30%
|
2/25/2019
|
$233.54
|
PP = $239.60
|
|
MB = $251.58
|
Most Recent Note - 3/22/2019 6:58:17 PM
Y - Pulled back today with lighter than average volume, slumping near its pivot point. The prior low and its 50 DMA line define additional near-term support to watch. Reported earnings +44% on +30% sales revenues for the Jan '19 quarter, continuing its strong earnings track record.
>>> FEATURED STOCK ARTICLE : Rebounded Near Prior High With Earnings News Due - 2/25/2019 |
View all notes |
Set NEW NOTE alert |
Company Profile |
SEC
News |
Chart |
Request a new note
C
A
S
I |
ANET
-
NYSE
Arista Networks Inc
TELECOMMUNICATIONS - Communication Equipment
|
$309.80
|
+8.57
2.85% |
$314.28
|
956,621
107.24% of 50 DAV
50 DAV is 892,000
|
$316.67
-2.17%
|
3/13/2019
|
$295.38
|
PP = $313.37
|
|
MB = $329.04
|
Most Recent Note - 3/26/2019 6:26:10 PM
Y - Gapped up today and posted a solid gain with higher (near average) volume for its second best ever close. Abruptly retreated into the prior base raising concerns the day after its 3/21/19 technical breakout to a new high.
>>> FEATURED STOCK ARTICLE : Rebounding Near High After Deep Consolidation - 3/13/2019 |
View all notes |
Set NEW NOTE alert |
Company Profile |
SEC
News |
Chart |
Request a new note
C
A
S
I |
PAYC
-
NYSE
Paycom Software Inc
COMPUTER SOFTWARE and SERVICES - Application Software
|
$185.71
|
+1.90
1.03% |
$188.90
|
476,739
71.80% of 50 DAV
50 DAV is 664,000
|
$190.64
-2.58%
|
2/6/2019
|
$171.66
|
PP = $164.18
|
|
MB = $172.39
|
Most Recent Note - 3/22/2019 1:15:48 PM
G - Pulling back abruptly today after hitting another new all-time with a big gain on the prior session. It did not form a sound new base of sufficient length but stubbornly held its ground. Its 50 DMA line and prior high coincide defining important near-term support to watch in the $164 area.
>>> FEATURED STOCK ARTICLE : Consolidating Near All-Time High - 3/8/2019 |
View all notes |
Set NEW NOTE alert |
Company Profile |
SEC
News |
Chart |
Request a new note
C
A
S
I |
PYPL
-
NASDAQ
Paypal Holdings Inc
Finance-CrdtCard/PmtPr
|
$103.15
|
+1.60
1.58% |
$103.29
|
4,476,845
58.88% of 50 DAV
50 DAV is 7,603,000
|
$104.56
-1.35%
|
1/24/2019
|
$92.56
|
PP = $93.80
|
|
MB = $98.49
|
Most Recent Note - 3/26/2019 3:53:53 PM
G - Perched near its all-time high with another gain today with lighter than average volume, extended from any sound base. Its 50 DMA line ($95.26) and prior highs in the $94 area define important near-term support to watch on pullbacks.
>>> FEATURED STOCK ARTICLE : Wedging into New High Territory With Gains Lacking Volume - 2/22/2019 |
View all notes |
Set NEW NOTE alert |
Company Profile |
SEC
News |
Chart |
Request a new note
C
A
S
I |
Symbol/Exchange
Company Name
Industry Group |
PRICE |
CHANGE
(%Change) |
Day High |
Volume
(% DAV)
(% 50 day avg vol) |
52 Wk Hi
% From Hi |
Featured
Date |
Price
Featured |
Pivot Featured |
|
Max Buy |
ALRM
-
NASDAQ
Alarm.com Holdings Inc
Security/Sfty
|
$62.72
|
+1.04
1.69% |
$63.21
|
328,946
61.03% of 50 DAV
50 DAV is 539,000
|
$65.85
-4.75%
|
1/22/2019
|
$60.52
|
PP = $60.30
|
|
MB = $63.32
|
Most Recent Note - 3/22/2019 6:53:44 PM
G - Slumped below its 50 DMA line ($61.44) with today's loss on light volume. Weak action came after it recently reported earnings +12% on +25% sales revenues for the Dec '18 quarter, below the +25% minimum earnings guideline (C criteria), raising fundamental concerns.
>>> FEATURED STOCK ARTICLE : Volume Totals Cooling While Perched at All-Time High - 2/20/2019 |
View all notes |
Set NEW NOTE alert |
Company Profile |
SEC
News |
Chart |
Request a new note
C
A
S
I |
PLNT
-
NYSE
Planet Fitness Inc Cl A
Leisure-Services
|
$67.07
|
-0.33
-0.49% |
$68.03
|
1,319,168
96.29% of 50 DAV
50 DAV is 1,370,000
|
$68.46
-2.03%
|
11/7/2018
|
$57.10
|
PP = $55.45
|
|
MB = $58.22
|
Most Recent Note - 3/26/2019 3:52:16 PM
G - Still holding its ground stubbornly near its all-time high with volume totals generally cooling after an impressive streak of gains. Its 50 DMA line ($60.81) and prior highs define near-term support in the $59-60 area. Showed bullish after after it recently reported earnings +42% on +30% sales revenues for the Dec '18 quarter.
>>> FEATURED STOCK ARTICLE : Met Distributional Pressure While Hitting New High After Earnings - 2/27/2019 |
View all notes |
Set NEW NOTE alert |
Company Profile |
SEC
News |
Chart |
Request a new note
C
A
S
I |
TEAM
-
NASDAQ
Atlassian Corp Plc Cl A
Comp Sftwr-Spec Enterprs
|
$111.55
|
+1.69
1.54% |
$112.95
|
726,766
43.29% of 50 DAV
50 DAV is 1,679,000
|
$115.88
-3.74%
|
1/7/2019
|
$94.68
|
PP = $98.31
|
|
MB = $103.23
|
Most Recent Note - 3/22/2019 1:06:02 PM
G - Pulling back today after inching into new all-time high territory with gains in recent weeks lacking great volume-conviction. Extended from any sound base, its 50 DMA line ($102.83) and recent low ($99.77 on 3/04/19) define near-term support to watch. Fundamentals remain strong.
>>> FEATURED STOCK ARTICLE : Pullback on Higher Volume After Recent Gains With Less Volume - 3/4/2019 |
View all notes |
Set NEW NOTE alert |
Company Profile |
SEC
News |
Chart |
Request a new note
C
A
S
I |
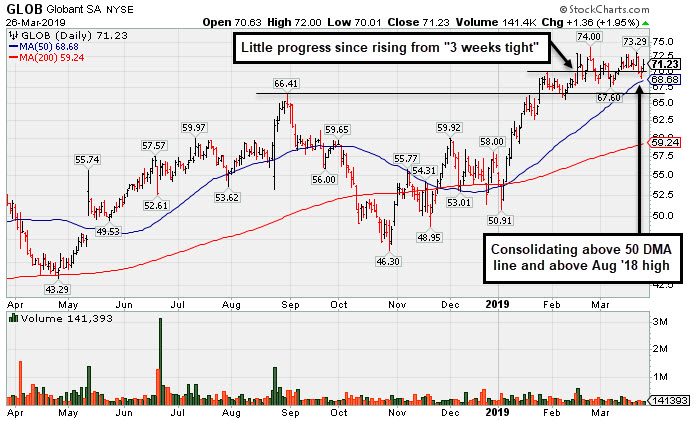
GLOB
-
NYSE
Globant SA
Computer-Tech Services
|
$71.23
|
+1.36
1.95% |
$72.00
|
141,393
66.69% of 50 DAV
50 DAV is 212,000
|
$74.00
-3.74%
|
2/15/2019
|
$69.35
|
PP = $70.00
|
|
MB = $73.50
|
Most Recent Note - 3/26/2019 6:21:30 PM
Y - Perched near its all-time high, consolidating above its 50 DMA line ($68.68) and prior lows in the $66-67 area. Violations would raise concerns and trigger technical sell signals. See the latest FSU analysis for more details and a new annotated graph.
>>> FEATURED STOCK ARTICLE : Consolidating Near 50-Day Average Quietly Perched Near High - 3/26/2019 |
View all notes |
Set NEW NOTE alert |
Company Profile |
SEC
News |
Chart |
Request a new note
C
A
S
I |
TTD
-
NASDAQ
The Trade Desk Inc Cl A
Comml Svcs-Advertising
|
$186.94
|
-10.10
-5.13% |
$202.50
|
3,135,152
219.86% of 50 DAV
50 DAV is 1,426,000
|
$214.70
-12.93%
|
2/6/2019
|
$148.65
|
PP = $149.00
|
|
MB = $156.45
|
Most Recent Note - 3/26/2019 12:54:12 PM
G - Pulling back today for a 3rd consecutive loss with ever-increasing volume after getting very extended from the prior base with recent gains lacking great volume conviction. Its 50 DMA line ($169) and prior high ($161) define near-term support to watch.
>>> FEATURED STOCK ARTICLE : Hit Another New All-Time High Getting Extended From Prior Base - 3/21/2019 |
View all notes |
Set NEW NOTE alert |
Company Profile |
SEC
News |
Chart |
Request a new note
C
A
S
I |
Symbol/Exchange
Company Name
Industry Group |
PRICE |
CHANGE
(%Change) |
Day High |
Volume
(% DAV)
(% 50 day avg vol) |
52 Wk Hi
% From Hi |
Featured
Date |
Price
Featured |
Pivot Featured |
|
Max Buy |