***Last / Change / Volume data in this table is the closing quote data***
Symbol/Exchange
Company Name
Industry Group |
PRICE |
CHANGE
(%Change) |
Day High |
Volume
(% DAV)
(% 50 day avg vol) |
52 Wk Hi
% From Hi |
Featured
Date |
Price
Featured |
Pivot Featured |
|
Max Buy |
MLR
-
NYSE
Miller Industries Inc
AUTOMOTIVE - Auto Parts
|
$32.42
|
+0.38
1.19% |
$32.90
|
53,006
165.64% of 50 DAV
50 DAV is 32,000
|
$35.26
-8.05%
|
11/30/2018
|
$28.35
|
PP = $29.50
|
|
MB = $30.98
|
 Most Recent Note - 3/21/2019 12:35:42 PM
G - Consolidating above its 50 DMA line ($31.34) and prior highs in the $29 area which define near-term support to watch. Endured mild distributional pressure over the past 2 weeks. Reported earnings +17% on +13% sales revenues for the Dec '18 quarter, below the +25% minimum guideline (C criteria), raising fundamental concerns.
>>> FEATURED STOCK ARTICLE : Extended From Prior Base After Impressive Streak of Gains - 3/1/2019 |
View all notes |
Set NEW NOTE alert |
Company Profile |
SEC
News |
Chart |
Request a new note
C
A
S
I |
NSP
-
NYSE
Insperity Inc
Comml Svcs-Outsourcing
|
$126.97
|
+3.21
2.59% |
$127.65
|
274,420
77.30% of 50 DAV
50 DAV is 355,000
|
$132.50
-4.17%
|
2/11/2019
|
$127.91
|
PP = $121.25
|
|
MB = $127.31
|
Most Recent Note - 3/20/2019 6:10:01 PM
Y - Still quietly consolidating below its "max buy" level and above prior highs in the $119-121 area which define important near-term support to watch on pullbacks.
>>> FEATURED STOCK ARTICLE : Volume Totals Cooling and Consolidating Near Prior Highs - 3/14/2019 |
View all notes |
Set NEW NOTE alert |
Company Profile |
SEC
News |
Chart |
Request a new note
C
A
S
I |
ZBRA
-
NASDAQ
Zebra Tech Corp Cl A
COMPUTER HARDWARE - Computer Peripherals
|
$218.30
|
+3.71
1.73% |
$219.39
|
253,891
53.34% of 50 DAV
50 DAV is 476,000
|
$216.78
0.70%
|
2/14/2019
|
$198.10
|
PP = $184.85
|
|
MB = $194.09
|
Most Recent Note - 3/18/2019 12:03:21 PM
G - Perched at its all-time high, extended from the prior base. Prior highs in the $184 area define initial support to watch on pullbacks.
>>> FEATURED STOCK ARTICLE : Big Volume-Driven Gain for New High - 2/14/2019 |
View all notes |
Set NEW NOTE alert |
Company Profile |
SEC
News |
Chart |
Request a new note
C
A
S
I |
SPSC
-
NASDAQ
S P S Commerce Inc
COMPUTER SOFTWARE and SERVICES - Application Software
|
$110.28
|
+2.27
2.10% |
$110.72
|
142,979
92.24% of 50 DAV
50 DAV is 155,000
|
$113.31
-2.67%
|
2/13/2019
|
$104.30
|
PP = $100.78
|
|
MB = $105.82
|
Most Recent Note - 3/20/2019 6:28:46 PM
G - Consolidating in an orderly fashion with volume totals cooling in recent weeks. Prior highs in the $100 area define initial support to watch.
>>> FEATURED STOCK ARTICLE : Gap Up and Big Volume Driven Gain for New High - 2/13/2019 |
View all notes |
Set NEW NOTE alert |
Company Profile |
SEC
News |
Chart |
Request a new note
C
A
S
I |
SSNC
-
NASDAQ
S S & C Technologies
COMPUTER SOFTWARE and SERVICES - Application Software
|
$63.63
|
+1.50
2.41% |
$63.63
|
1,255,200
70.04% of 50 DAV
50 DAV is 1,792,000
|
$64.36
-1.13%
|
2/15/2019
|
$59.73
|
PP = $61.07
|
|
MB = $64.12
|
Most Recent Note - 3/18/2019 11:43:53 AM
Y - Perched near its all-time high, showing resilience. Stalled after a 3/01/19 gain above its pivot point backed by +49% above average volume triggered a technical buy signal.
>>> FEATURED STOCK ARTICLE : Volume-Driven Gain for New High Close - 2/19/2019 |
View all notes |
Set NEW NOTE alert |
Company Profile |
SEC
News |
Chart |
Request a new note
C
A
S
I |
Symbol/Exchange
Company Name
Industry Group |
PRICE |
CHANGE
(%Change) |
Day High |
Volume
(% DAV)
(% 50 day avg vol) |
52 Wk Hi
% From Hi |
Featured
Date |
Price
Featured |
Pivot Featured |
|
Max Buy |
IRBT
-
NASDAQ
Irobot Corp
CONSUMER DURABLES - Electronic Equipment
|
$125.55
|
+2.79
2.27% |
$126.22
|
354,858
42.65% of 50 DAV
50 DAV is 832,000
|
$132.88
-5.52%
|
2/8/2019
|
$104.92
|
PP = $103.63
|
|
MB = $108.81
|
Most Recent Note - 3/18/2019 5:51:04 PM
G - Recent gains have lacked great volume conviction. Consolidating near its all-time high, extended from the previously noted "double bottom" base.
>>> FEATURED STOCK ARTICLE : Consolidating After Getting Extended from Double Bottom Base - 3/12/2019 |
View all notes |
Set NEW NOTE alert |
Company Profile |
SEC
News |
Chart |
Request a new note
C
A
S
I |
AUDC
-
NASDAQ
Audiocodes Ltd
ELECTRONICS - Scientific and Technical Instrum
|
$13.88
|
+0.01
0.07% |
$14.04
|
232,686
89.84% of 50 DAV
50 DAV is 259,000
|
$14.96
-7.22%
|
3/20/2019
|
$13.66
|
PP = $15.06
|
|
MB = $15.81
|
Most Recent Note - 3/20/2019 6:07:15 PM
Y - Posted a volume-driven gain today. Highlighted in yellow with pivot point cited based on its 1/28/19 high plus 10 cents in the earlier mid-day report. Subsequent gains above the pivot point backed by at least +40% above average volume are needed to trigger a new technical buy signal. This Israel-based Telecom firm found support near prior highs and near its 50 DMA line during an orderly 7-week consolidation. Reported earnings +67% on +11% sales revenues for the Dec '18 quarter. its 8th consecutive quarterly comparison above the +25% minimum guideline (C criteria). See the latest FSU analysis for more details and a new annotated graph.
>>> FEATURED STOCK ARTICLE : Building a Base and Found Support Near 50-Day Moving Average - 3/20/2019 |
View all notes |
Set NEW NOTE alert |
Company Profile |
SEC
News |
Chart |
Request a new note
C
A
S
I |
ENV
-
NYSE
Envestnet Inc
FINANCIAL SERVICES - Diversified Investments
|
$66.39
|
+1.10
1.68% |
$66.78
|
259,590
94.74% of 50 DAV
50 DAV is 274,000
|
$67.52
-1.67%
|
3/15/2019
|
$66.05
|
PP = $64.90
|
|
MB = $68.15
|
Most Recent Note - 3/21/2019 5:26:10 PM
Y - Posted a gain today with average volume, trading near its all-time high. Finished strong after highlighted in yellow with pivot point cited based on its 9/14/18 high plus 10 cents in the 3/15/19 mid-day report.
>>> FEATURED STOCK ARTICLE : Volume Heavy Behind Rally to New Highs - 3/15/2019 |
View all notes |
Set NEW NOTE alert |
Company Profile |
SEC
News |
Chart |
Request a new note
C
A
S
I |
LHCG
-
NASDAQ
L H C Group Inc
HEALTH SERVICES - Home Health Care
|
$113.79
|
+1.78
1.59% |
$114.37
|
204,165
77.93% of 50 DAV
50 DAV is 262,000
|
$114.31
-0.45%
|
1/23/2019
|
$107.29
|
PP = $107.61
|
|
MB = $112.99
|
Most Recent Note - 3/18/2019 5:54:26 PM
Y - Posted a gain today with light volume for its second best close ever. Recently found support at its 50 DMA line and formed a base-on-base. Bullish action came after it reported earnings +66% on +75% sales revenues for the Dec '18 quarter.
>>> FEATURED STOCK ARTICLE : Recent Gains for New Highs Lacked Great Volume Conviction - 2/21/2019 |
View all notes |
Set NEW NOTE alert |
Company Profile |
SEC
News |
Chart |
Request a new note
C
A
S
I |
ENSG
-
NASDAQ
Ensign Group Inc
HEALTH SERVICES - Long-Term Care Facilities
|
$50.67
|
+0.79
1.58% |
$51.34
|
183,064
55.98% of 50 DAV
50 DAV is 327,000
|
$54.56
-7.13%
|
2/7/2019
|
$48.71
|
PP = $49.06
|
|
MB = $51.51
|
Most Recent Note - 3/18/2019 11:32:09 AM
Y - Found support while recently consolidating near prior highs in the $48 area, well above its 50 DMA line ($46.48) defining the next important near-term support level to watch.
>>> FEATURED STOCK ARTICLE : Consolidating Near Proir High and Above 50-Day Average - 3/11/2019 |
View all notes |
Set NEW NOTE alert |
Company Profile |
SEC
News |
Chart |
Request a new note
C
A
S
I |
Symbol/Exchange
Company Name
Industry Group |
PRICE |
CHANGE
(%Change) |
Day High |
Volume
(% DAV)
(% 50 day avg vol) |
52 Wk Hi
% From Hi |
Featured
Date |
Price
Featured |
Pivot Featured |
|
Max Buy |
NXST
-
NASDAQ
Nexstar Media Group Cl A
MEDIA - Broadcasting - TV
|
$108.65
|
+3.11
2.95% |
$109.55
|
709,504
135.14% of 50 DAV
50 DAV is 525,000
|
$108.32
0.31%
|
2/26/2019
|
$94.26
|
PP = $89.76
|
|
MB = $94.25
|
Most Recent Note - 3/21/2019 5:27:32 PM
G - Posted a solid gain today with above average volume hitting a new all-time high. Disciplined investors avoid chasing stocks more than +5% above the prior high.
>>> FEATURED STOCK ARTICLE : Twice Average Volume Behind Gain for New High - 2/26/2019 |
View all notes |
Set NEW NOTE alert |
Company Profile |
SEC
News |
Chart |
Request a new note
C
A
S
I |
BSTC
-
NASDAQ
Biospecifics Technologie
Medical-Biomed/Biotech
|
$67.78
|
-0.14
-0.21% |
$68.89
|
62,524
142.10% of 50 DAV
50 DAV is 44,000
|
$73.31
-7.54%
|
1/18/2019
|
$67.40
|
PP = $66.31
|
|
MB = $69.63
|
Most Recent Note - 3/21/2019 12:23:54 PM
Y - Due to report earnings news, and volume and volatility often increase near earnings news. Consolidating near prior highs and near its 50 DMA line ($66.93) defining important near-term support to watch. More damaging losses would raise concerns and trigger a technical sell signal.
>>> FEATURED STOCK ARTICLE : Consolidating Above 50-Day Moving Average and Prior Highs - 3/7/2019 |
View all notes |
Set NEW NOTE alert |
Company Profile |
SEC
News |
Chart |
Request a new note
C
A
S
I |
ULTA
-
NASDAQ
Ulta Beauty Inc
SPECIALTY RETAIL - Specialty Retail, Other
|
$335.13
|
+4.34
1.31% |
$336.55
|
756,826
93.78% of 50 DAV
50 DAV is 807,000
|
$345.24
-2.93%
|
3/15/2019
|
$341.27
|
PP = $322.59
|
|
MB = $338.72
|
Most Recent Note - 3/19/2019 6:02:59 PM
Y - Consolidating near its all-time high. A big "breakaway gap" on 3/15/19 backed by heavy volume triggered a technical buy signal. Bullish action came after it reported earnings +31% sales revenues on +10% sales revenues for the Jan '19 quarter. See the latest FSU analysis for more details and a new annotated graph.
>>> FEATURED STOCK ARTICLE : Consolidating Following Big "Breakaway Gap" - 3/19/2019 |
View all notes |
Set NEW NOTE alert |
Company Profile |
SEC
News |
Chart |
Request a new note
C
A
S
I |
UBNT
-
NASDAQ
Ubiquiti Networks
TELECOMMUNICATIONS - Diversified Communication Serv
|
$147.33
|
+3.57
2.48% |
$148.42
|
328,225
91.94% of 50 DAV
50 DAV is 357,000
|
$148.68
-0.91%
|
2/8/2019
|
$121.97
|
PP = $115.54
|
|
MB = $121.32
|
Most Recent Note - 3/18/2019 5:59:00 PM
G - Still holding its ground in a tight range perched near its all-time high with volume totals cooling, very extended from the prior base. Fundamentals remain strong. Prior high ($115) defines initial support to watch on pullbacks.
>>> FEATURED STOCK ARTICLE : Bullish Action Came Following Another Strong Earnings Report - 3/5/2019 |
View all notes |
Set NEW NOTE alert |
Company Profile |
SEC
News |
Chart |
Request a new note
C
A
S
I |
ESNT
-
NYSE
Essent Group Ltd
Finance-MrtgandRel Svc
|
$45.84
|
+0.52
1.15% |
$45.97
|
1,096,568
191.37% of 50 DAV
50 DAV is 573,000
|
$47.94
-4.38%
|
3/18/2019
|
$45.84
|
PP = $45.06
|
|
MB = $47.31
|
Most Recent Note - 3/20/2019 1:01:42 PM
Y - Pulling back after a big volume-driven gain on 3/18/19. Previously noted - "Faces some resistance due to overhead supply up to the $50 level. Reported earnings +66% on +20% sales revenues for the Dec '18 quarter, its 4th consecutive comparison above the +25% minimum earnings guideline (C criteria)."
>>> FEATURED STOCK ARTICLE : Big Breakout Gain With +350% Above Average Volume - 3/18/2019 |
View all notes |
Set NEW NOTE alert |
Company Profile |
SEC
News |
Chart |
Request a new note
C
A
S
I |
Symbol/Exchange
Company Name
Industry Group |
PRICE |
CHANGE
(%Change) |
Day High |
Volume
(% DAV)
(% 50 day avg vol) |
52 Wk Hi
% From Hi |
Featured
Date |
Price
Featured |
Pivot Featured |
|
Max Buy |
NOW
-
NYSE
Servicenow Inc
Computer Sftwr-Enterprse
|
$250.95
|
+6.36
2.60% |
$251.65
|
1,302,954
61.29% of 50 DAV
50 DAV is 2,126,000
|
$247.28
1.48%
|
1/31/2019
|
$218.14
|
PP = $206.40
|
|
MB = $216.72
|
Most Recent Note - 3/20/2019 6:08:55 PM
G - Posted a quiet gain today for another new all-time high. Extended from any sound base. Its 50 DMA line ($219.72) defines near-term support above the prior high ($206).
>>> FEATURED STOCK ARTICLE : Pulling Back After 6 Straight Weekly Gains - 3/6/2019 |
View all notes |
Set NEW NOTE alert |
Company Profile |
SEC
News |
Chart |
Request a new note
C
A
S
I |
PANW
-
NYSE
Palo Alto Networks
Computer Sftwr-Security
|
$249.79
|
+3.97
1.62% |
$250.26
|
1,297,369
90.85% of 50 DAV
50 DAV is 1,428,000
|
$260.63
-4.16%
|
2/25/2019
|
$233.54
|
PP = $239.60
|
|
MB = $251.58
|
Most Recent Note - 3/18/2019 11:42:02 AM
Y - Consolidating near its pivot point after a recent slump into the prior base had raised concerns. Reported earnings +44% on +30% sales revenues for the Jan '19 quarter, continuing its strong earnings track record.
>>> FEATURED STOCK ARTICLE : Rebounded Near Prior High With Earnings News Due - 2/25/2019 |
View all notes |
Set NEW NOTE alert |
Company Profile |
SEC
News |
Chart |
Request a new note
C
A
S
I |
ANET
-
NYSE
Arista Networks Inc
TELECOMMUNICATIONS - Communication Equipment
|
$315.02
|
+16.57
5.55% |
$316.67
|
1,662,224
193.51% of 50 DAV
50 DAV is 859,000
|
$313.37
0.53%
|
3/13/2019
|
$295.38
|
PP = $313.37
|
|
MB = $329.04
|
Most Recent Note - 3/21/2019 12:20:47 PM
Y - Gapped up today hitting a new all-time high. A solid gain above the pivot point backed by at least +40% is necessary to trigger a proper technical buy signal.
>>> FEATURED STOCK ARTICLE : Rebounding Near High After Deep Consolidation - 3/13/2019 |
View all notes |
Set NEW NOTE alert |
Company Profile |
SEC
News |
Chart |
Request a new note
C
A
S
I |
PAYC
-
NYSE
Paycom Software Inc
COMPUTER SOFTWARE and SERVICES - Application Software
|
$190.05
|
+8.08
4.44% |
$190.64
|
903,992
140.81% of 50 DAV
50 DAV is 642,000
|
$186.00
2.18%
|
2/6/2019
|
$171.66
|
PP = $164.18
|
|
MB = $172.39
|
Most Recent Note - 3/21/2019 12:48:41 PM
G - Hitting another new all-time with today's big gain. It did not form a sound new base of sufficient length but stubbornly held its ground. Its 50 DMA line and prior high coincide defining important near-term support to watch in the $164 area.
>>> FEATURED STOCK ARTICLE : Consolidating Near All-Time High - 3/8/2019 |
View all notes |
Set NEW NOTE alert |
Company Profile |
SEC
News |
Chart |
Request a new note
C
A
S
I |
PYPL
-
NASDAQ
Paypal Holdings Inc
Finance-CrdtCard/PmtPr
|
$104.15
|
+1.84
1.80% |
$104.56
|
7,185,913
93.08% of 50 DAV
50 DAV is 7,720,000
|
$103.05
1.07%
|
1/24/2019
|
$92.56
|
PP = $93.80
|
|
MB = $98.49
|
Most Recent Note - 3/20/2019 6:16:14 PM
G - Posted another gain today with lighter than average volume for a new high, getting more extended from any sound base. Its 50 DMA line and prior highs in the $94 area define important near-term support to watch on pullbacks.
>>> FEATURED STOCK ARTICLE : Wedging into New High Territory With Gains Lacking Volume - 2/22/2019 |
View all notes |
Set NEW NOTE alert |
Company Profile |
SEC
News |
Chart |
Request a new note
C
A
S
I |
Symbol/Exchange
Company Name
Industry Group |
PRICE |
CHANGE
(%Change) |
Day High |
Volume
(% DAV)
(% 50 day avg vol) |
52 Wk Hi
% From Hi |
Featured
Date |
Price
Featured |
Pivot Featured |
|
Max Buy |
ALRM
-
NASDAQ
Alarm.com Holdings Inc
Security/Sfty
|
$63.03
|
+0.89
1.43% |
$63.62
|
310,632
55.08% of 50 DAV
50 DAV is 564,000
|
$65.85
-4.28%
|
1/22/2019
|
$60.52
|
PP = $60.30
|
|
MB = $63.32
|
Most Recent Note - 3/18/2019 11:26:21 AM
G - Found support near its 50 DMA line ($60.71). Weak action came after it reported earnings +12% on +25% sales revenues for the Dec '18 quarter, below the +25% minimum earnings guideline (C criteria), raising fundamental concerns.
>>> FEATURED STOCK ARTICLE : Volume Totals Cooling While Perched at All-Time High - 2/20/2019 |
View all notes |
Set NEW NOTE alert |
Company Profile |
SEC
News |
Chart |
Request a new note
C
A
S
I |
PLNT
-
NYSE
Planet Fitness Inc Cl A
Leisure-Services
|
$67.65
|
+0.22
0.33% |
$68.34
|
1,244,840
89.43% of 50 DAV
50 DAV is 1,392,000
|
$68.46
-1.19%
|
11/7/2018
|
$57.10
|
PP = $55.45
|
|
MB = $58.22
|
Most Recent Note - 3/20/2019 6:13:54 PM
G - Perched near its all-time high with volume totals cooling after a streak of gains. Its 50 DMA line and prior highs define near-term support in the $59-60 area. Showed bullish after after it recently reported earnings +42% on +30% sales revenues for the Dec '18 quarter.
>>> FEATURED STOCK ARTICLE : Met Distributional Pressure While Hitting New High After Earnings - 2/27/2019 |
View all notes |
Set NEW NOTE alert |
Company Profile |
SEC
News |
Chart |
Request a new note
C
A
S
I |
TEAM
-
NASDAQ
Atlassian Corp Plc Cl A
Comp Sftwr-Spec Enterprs
|
$115.50
|
+2.67
2.37% |
$115.88
|
1,097,108
64.20% of 50 DAV
50 DAV is 1,709,000
|
$113.90
1.40%
|
1/7/2019
|
$94.68
|
PP = $98.31
|
|
MB = $103.23
|
Most Recent Note - 3/20/2019 6:30:23 PM
G - Posted 3 consecutive gains with lighter than average volume, inching into new all-time high territory. Extended from any sound base. Its 50 DMA line ($102) and recent low define near-term support to watch on pullbacks. Fundamentals remain strong.
>>> FEATURED STOCK ARTICLE : Pullback on Higher Volume After Recent Gains With Less Volume - 3/4/2019 |
View all notes |
Set NEW NOTE alert |
Company Profile |
SEC
News |
Chart |
Request a new note
C
A
S
I |
GLOB
-
NYSE
Globant SA
Computer-Tech Services
|
$72.99
|
+1.82
2.56% |
$73.29
|
114,599
53.06% of 50 DAV
50 DAV is 216,000
|
$74.00
-1.36%
|
2/15/2019
|
$69.35
|
PP = $70.00
|
|
MB = $73.50
|
Most Recent Note - 3/19/2019 6:10:13 PM
Y - Volume totals have been cooling while holding its ground stubbornly near its all-time high. Its 50 DMA line ($67.51) and prior lows define important near-term support to watch on pullbacks.
>>> FEATURED STOCK ARTICLE : Volume-Driven Gain From Advanced "3-Weeks Tight" Base - 2/15/2019 |
View all notes |
Set NEW NOTE alert |
Company Profile |
SEC
News |
Chart |
Request a new note
C
A
S
I |
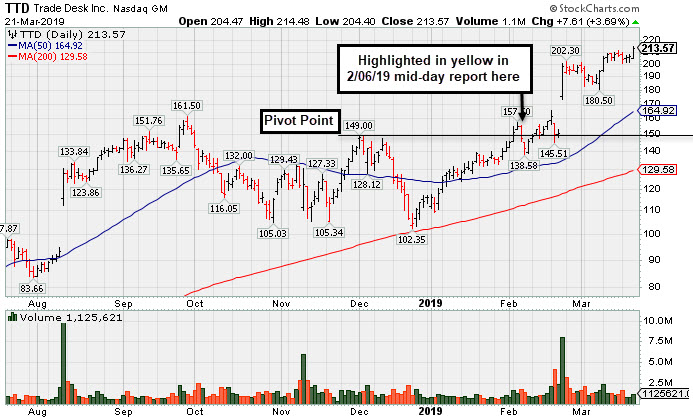
TTD
-
NASDAQ
The Trade Desk Inc Cl A
Comml Svcs-Advertising
|
$213.57
|
+7.61
3.69% |
$214.48
|
1,124,627
80.68% of 50 DAV
50 DAV is 1,394,000
|
$211.87
0.80%
|
2/6/2019
|
$148.65
|
PP = $149.00
|
|
MB = $156.45
|
Most Recent Note - 3/21/2019 6:09:22 PM
G - Posted a 3rd consecutive gain with below average volume for another new all-time high, getting very extended from the prior base. Prior high ($161) defines initial support to watch. Fundamentals are strong. See the latest FSU analysis for more details and a new annotated graph.
>>> FEATURED STOCK ARTICLE : Hit Another New All-Time High Getting Extended From Prior Base - 3/21/2019 |
View all notes |
Set NEW NOTE alert |
Company Profile |
SEC
News |
Chart |
Request a new note
C
A
S
I |
Symbol/Exchange
Company Name
Industry Group |
PRICE |
CHANGE
(%Change) |
Day High |
Volume
(% DAV)
(% 50 day avg vol) |
52 Wk Hi
% From Hi |
Featured
Date |
Price
Featured |
Pivot Featured |
|
Max Buy |