***Last / Change / Volume data in this table is the closing quote data***
Symbol/Exchange
Company Name
Industry Group |
PRICE |
CHANGE
(%Change) |
Day High |
Volume
(% DAV)
(% 50 day avg vol) |
52 Wk Hi
% From Hi |
Featured
Date |
Price
Featured |
Pivot Featured |
|
Max Buy |
MLR
-
NYSE
Miller Industries Inc
AUTOMOTIVE - Auto Parts
|
$33.07
|
+0.46
1.41% |
$33.12
|
33,145
103.58% of 50 DAV
50 DAV is 32,000
|
$35.26
-6.21%
|
11/30/2018
|
$28.35
|
PP = $29.50
|
|
MB = $30.98
|
 Most Recent Note - 3/18/2019 11:33:54 AM
G - Endured distributional pressure over the past 2 weeks. Reported earnings +17% on +13% sales revenues for the Dec '18 quarter, below the +25% minimum guideline (C criteria), raising fundamental concerns. Its 50 DMA line ($31.06) and prior highs in the $29 area define near-term support to watch.
>>> FEATURED STOCK ARTICLE : Extended From Prior Base After Impressive Streak of Gains - 3/1/2019 |
View all notes |
Set NEW NOTE alert |
Company Profile |
SEC
News |
Chart |
Request a new note
C
A
S
I |
NSP
-
NYSE
Insperity Inc
Comml Svcs-Outsourcing
|
$124.46
|
+1.34
1.09% |
$124.76
|
304,962
86.39% of 50 DAV
50 DAV is 353,000
|
$132.50
-6.07%
|
2/11/2019
|
$127.91
|
PP = $121.25
|
|
MB = $127.31
|
Most Recent Note - 3/14/2019 5:02:33 PM
Y - Volume totals have been cooling while quietly consolidating below its "max buy" level. Prior highs in the $119-121 area define important near-term support to watch on pullbacks. See the latest FSU analysis for more details and a new annotated graph.
>>> FEATURED STOCK ARTICLE : Volume Totals Cooling and Consolidating Near Prior Highs - 3/14/2019 |
View all notes |
Set NEW NOTE alert |
Company Profile |
SEC
News |
Chart |
Request a new note
C
A
S
I |
ZBRA
-
NASDAQ
Zebra Tech Corp Cl A
COMPUTER HARDWARE - Computer Peripherals
|
$213.21
|
+1.81
0.86% |
$214.08
|
355,265
71.63% of 50 DAV
50 DAV is 496,000
|
$216.78
-1.65%
|
2/14/2019
|
$198.10
|
PP = $184.85
|
|
MB = $194.09
|
Most Recent Note - 3/18/2019 12:03:21 PM
G - Perched at its all-time high, extended from the prior base. Prior highs in the $184 area define initial support to watch on pullbacks.
>>> FEATURED STOCK ARTICLE : Big Volume-Driven Gain for New High - 2/14/2019 |
View all notes |
Set NEW NOTE alert |
Company Profile |
SEC
News |
Chart |
Request a new note
C
A
S
I |
SPSC
-
NASDAQ
S P S Commerce Inc
COMPUTER SOFTWARE and SERVICES - Application Software
|
$107.48
|
+0.79
0.74% |
$109.49
|
101,514
64.25% of 50 DAV
50 DAV is 158,000
|
$113.31
-5.15%
|
2/13/2019
|
$104.30
|
PP = $100.78
|
|
MB = $105.82
|
Most Recent Note - 3/13/2019 7:10:29 PM
G - Color code is changed to green while consolidating just above its "max buy" level. Prior highs in the $100 area define initial support to watch.
>>> FEATURED STOCK ARTICLE : Gap Up and Big Volume Driven Gain for New High - 2/13/2019 |
View all notes |
Set NEW NOTE alert |
Company Profile |
SEC
News |
Chart |
Request a new note
C
A
S
I |
SSNC
-
NASDAQ
S S & C Technologies
COMPUTER SOFTWARE and SERVICES - Application Software
|
$62.60
|
+0.39
0.63% |
$62.99
|
1,768,837
96.13% of 50 DAV
50 DAV is 1,840,000
|
$64.36
-2.73%
|
2/15/2019
|
$59.73
|
PP = $61.07
|
|
MB = $64.12
|
Most Recent Note - 3/18/2019 11:43:53 AM
Y - Perched near its all-time high, showing resilience. Stalled after a 3/01/19 gain above its pivot point backed by +49% above average volume triggered a technical buy signal.
>>> FEATURED STOCK ARTICLE : Volume-Driven Gain for New High Close - 2/19/2019 |
View all notes |
Set NEW NOTE alert |
Company Profile |
SEC
News |
Chart |
Request a new note
C
A
S
I |
Symbol/Exchange
Company Name
Industry Group |
PRICE |
CHANGE
(%Change) |
Day High |
Volume
(% DAV)
(% 50 day avg vol) |
52 Wk Hi
% From Hi |
Featured
Date |
Price
Featured |
Pivot Featured |
|
Max Buy |
IRBT
-
NASDAQ
Irobot Corp
CONSUMER DURABLES - Electronic Equipment
|
$127.83
|
+3.12
2.50% |
$128.08
|
444,336
53.53% of 50 DAV
50 DAV is 830,000
|
$132.88
-3.80%
|
2/8/2019
|
$104.92
|
PP = $103.63
|
|
MB = $108.81
|
Most Recent Note - 3/18/2019 5:51:04 PM
G - Recent gains have lacked great volume conviction. Consolidating near its all-time high, extended from the previously noted "double bottom" base.
>>> FEATURED STOCK ARTICLE : Consolidating After Getting Extended from Double Bottom Base - 3/12/2019 |
View all notes |
Set NEW NOTE alert |
Company Profile |
SEC
News |
Chart |
Request a new note
C
A
S
I |
ENV
-
NYSE
Envestnet Inc
FINANCIAL SERVICES - Diversified Investments
|
$66.38
|
-0.26
-0.39% |
$67.52
|
339,513
125.75% of 50 DAV
50 DAV is 270,000
|
$66.67
-0.43%
|
3/15/2019
|
$66.05
|
PP = $64.90
|
|
MB = $68.15
|
Most Recent Note - 3/15/2019 5:54:10 PM
Y - Finished strong after highlighted in yellow with pivot point cited based on its 9/14/18 high plus 10 cents in the earlier mid-day report. See the latest FSU analysis for more details and a new annotated graph.
>>> FEATURED STOCK ARTICLE : Volume Heavy Behind Rally to New Highs - 3/15/2019 |
View all notes |
Set NEW NOTE alert |
Company Profile |
SEC
News |
Chart |
Request a new note
C
A
S
I |
LHCG
-
NASDAQ
L H C Group Inc
HEALTH SERVICES - Home Health Care
|
$112.95
|
+1.95
1.76% |
$112.95
|
200,126
76.38% of 50 DAV
50 DAV is 262,000
|
$114.22
-1.11%
|
1/23/2019
|
$107.29
|
PP = $107.61
|
|
MB = $112.99
|
Most Recent Note - 3/18/2019 5:54:26 PM
Y - Posted a gain today with light volume for its second best close ever. Recently found support at its 50 DMA line and formed a base-on-base. Bullish action came after it reported earnings +66% on +75% sales revenues for the Dec '18 quarter.
>>> FEATURED STOCK ARTICLE : Recent Gains for New Highs Lacked Great Volume Conviction - 2/21/2019 |
View all notes |
Set NEW NOTE alert |
Company Profile |
SEC
News |
Chart |
Request a new note
C
A
S
I |
ENSG
-
NASDAQ
Ensign Group Inc
HEALTH SERVICES - Long-Term Care Facilities
|
$50.95
|
+0.48
0.95% |
$51.25
|
260,502
79.18% of 50 DAV
50 DAV is 329,000
|
$54.56
-6.62%
|
2/7/2019
|
$48.71
|
PP = $49.06
|
|
MB = $51.51
|
Most Recent Note - 3/18/2019 11:32:09 AM
Y - Found support while recently consolidating near prior highs in the $48 area, well above its 50 DMA line ($46.48) defining the next important near-term support level to watch.
>>> FEATURED STOCK ARTICLE : Consolidating Near Proir High and Above 50-Day Average - 3/11/2019 |
View all notes |
Set NEW NOTE alert |
Company Profile |
SEC
News |
Chart |
Request a new note
C
A
S
I |
NXST
-
NASDAQ
Nexstar Media Group Cl A
MEDIA - Broadcasting - TV
|
$106.62
|
+0.03
0.03% |
$107.29
|
668,147
123.50% of 50 DAV
50 DAV is 541,000
|
$108.32
-1.57%
|
2/26/2019
|
$94.26
|
PP = $89.76
|
|
MB = $94.25
|
Most Recent Note - 3/13/2019 7:07:11 PM
G - Posted a 4th consecutive gain with near average volume today hitting another new all-time high. Disciplined investors avoid chasing stocks more than +5% above the prior high.
>>> FEATURED STOCK ARTICLE : Twice Average Volume Behind Gain for New High - 2/26/2019 |
View all notes |
Set NEW NOTE alert |
Company Profile |
SEC
News |
Chart |
Request a new note
C
A
S
I |
Symbol/Exchange
Company Name
Industry Group |
PRICE |
CHANGE
(%Change) |
Day High |
Volume
(% DAV)
(% 50 day avg vol) |
52 Wk Hi
% From Hi |
Featured
Date |
Price
Featured |
Pivot Featured |
|
Max Buy |
BSTC
-
NASDAQ
Biospecifics Technologie
Medical-Biomed/Biotech
|
$66.74
|
-2.52
-3.64% |
$70.80
|
39,272
87.27% of 50 DAV
50 DAV is 45,000
|
$73.31
-8.96%
|
1/18/2019
|
$67.40
|
PP = $66.31
|
|
MB = $69.63
|
Most Recent Note - 3/13/2019 7:13:35 PM
Y - Due to report earnings news, and volume and volatility often increase near earnings news. Consolidating near prior highs and above its 50 DMA line ($66.11) defining important near-term support to watch. More damaging losses would raise concerns and trigger a technical sell signal.
>>> FEATURED STOCK ARTICLE : Consolidating Above 50-Day Moving Average and Prior Highs - 3/7/2019 |
View all notes |
Set NEW NOTE alert |
Company Profile |
SEC
News |
Chart |
Request a new note
C
A
S
I |
ULTA
-
NASDAQ
Ulta Beauty Inc
SPECIALTY RETAIL - Specialty Retail, Other
|
$342.22
|
+3.81
1.13% |
$344.53
|
942,540
117.82% of 50 DAV
50 DAV is 800,000
|
$345.24
-0.87%
|
3/15/2019
|
$341.27
|
PP = $322.59
|
|
MB = $338.72
|
Most Recent Note - 3/15/2019 1:27:35 PM
Y - Color code is changed to yellow with new pivot point based on its 11/19/18 high plus 10 cents. Reported earnings +31% sales revenues on +10% sales revenues for the Jan '19 quarter. Hitting new all-time highs with today's "breakaway gap" and big gain backed by heavy volume triggering a technical buy signal. It rebounded impressively after dropped from the Featured Stocks list on 12/10/18.
>>> FEATURED STOCK ARTICLE : Damaging Technical Action Following Latest Strong Earnings Report - 12/10/2018 |
View all notes |
Set NEW NOTE alert |
Company Profile |
SEC
News |
Chart |
Request a new note
C
A
S
I |
UBNT
-
NASDAQ
Ubiquiti Networks
TELECOMMUNICATIONS - Diversified Communication Serv
|
$143.70
|
-1.19
-0.82% |
$146.04
|
219,663
60.68% of 50 DAV
50 DAV is 362,000
|
$148.68
-3.35%
|
2/8/2019
|
$121.97
|
PP = $115.54
|
|
MB = $121.32
|
Most Recent Note - 3/18/2019 5:59:00 PM
G - Still holding its ground in a tight range perched near its all-time high with volume totals cooling, very extended from the prior base. Fundamentals remain strong. Prior high ($115) defines initial support to watch on pullbacks.
>>> FEATURED STOCK ARTICLE : Bullish Action Came Following Another Strong Earnings Report - 3/5/2019 |
View all notes |
Set NEW NOTE alert |
Company Profile |
SEC
News |
Chart |
Request a new note
C
A
S
I |
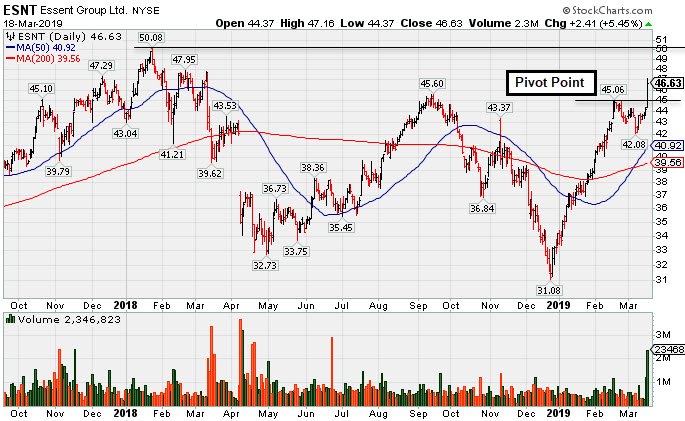
ESNT
-
NYSE
Essent Group Ltd
Finance-MrtgandRel Svc
|
$46.63
|
+2.41
5.45% |
$47.16
|
2,346,498
452.99% of 50 DAV
50 DAV is 518,000
|
$45.60
2.26%
|
3/18/2019
|
$45.84
|
PP = $45.06
|
|
MB = $47.31
|
Most Recent Note - 3/18/2019 5:57:00 PM
Y - Finished strong after highlighted in yellow in the earlier mid-day report with new pivot point cited based on its 2/19/19 high. Triggered a technical buy signal with a big volume-driven gain. Faces some resistance due to overhead supply up to the $50 level. Reported earnings +66% on +20% sales revenues for the Dec '18 quarter, its 4th consecutive comparison above the +25% minimum earnings guideline (C criteria). See the latest FSU analysis for more details and a new annotated graph.
>>> FEATURED STOCK ARTICLE : Big Breakout Gain With +350% Above Average Volume - 3/18/2019 |
View all notes |
Set NEW NOTE alert |
Company Profile |
SEC
News |
Chart |
Request a new note
C
A
S
I |
NOW
-
NYSE
Servicenow Inc
Computer Sftwr-Enterprse
|
$240.98
|
-0.91
-0.38% |
$245.96
|
2,152,481
100.63% of 50 DAV
50 DAV is 2,139,000
|
$245.33
-1.77%
|
1/31/2019
|
$218.14
|
PP = $206.40
|
|
MB = $216.72
|
Most Recent Note - 3/13/2019 7:06:22 PM
G - Perched near its all-time high after another gain today with lighter volume, extended from any sound base. Its 50 DMA line ($213) defines near-term support above the prior high ($206).
>>> FEATURED STOCK ARTICLE : Pulling Back After 6 Straight Weekly Gains - 3/6/2019 |
View all notes |
Set NEW NOTE alert |
Company Profile |
SEC
News |
Chart |
Request a new note
C
A
S
I |
Symbol/Exchange
Company Name
Industry Group |
PRICE |
CHANGE
(%Change) |
Day High |
Volume
(% DAV)
(% 50 day avg vol) |
52 Wk Hi
% From Hi |
Featured
Date |
Price
Featured |
Pivot Featured |
|
Max Buy |
PANW
-
NYSE
Palo Alto Networks
Computer Sftwr-Security
|
$241.01
|
+1.29
0.54% |
$243.12
|
1,219,650
85.11% of 50 DAV
50 DAV is 1,433,000
|
$260.63
-7.53%
|
2/25/2019
|
$233.54
|
PP = $239.60
|
|
MB = $251.58
|
Most Recent Note - 3/18/2019 11:42:02 AM
Y - Consolidating near its pivot point after a recent slump into the prior base had raised concerns. Reported earnings +44% on +30% sales revenues for the Jan '19 quarter, continuing its strong earnings track record.
>>> FEATURED STOCK ARTICLE : Rebounded Near Prior High With Earnings News Due - 2/25/2019 |
View all notes |
Set NEW NOTE alert |
Company Profile |
SEC
News |
Chart |
Request a new note
C
A
S
I |
ANET
-
NYSE
Arista Networks Inc
TELECOMMUNICATIONS - Communication Equipment
|
$299.20
|
+2.44
0.82% |
$304.97
|
1,031,687
118.04% of 50 DAV
50 DAV is 874,000
|
$313.37
-4.52%
|
3/13/2019
|
$295.38
|
PP = $313.37
|
|
MB = $329.04
|
Most Recent Note - 3/13/2019 7:04:15 PM
Y - Posted a 3rd consecutive gain today while highlighted in yellow in the earlier mid-day report (read here) with new pivot point cited based on its 8/24/18 high plus 10 cents. Challenging previously stubborn resistance in the $311-313 area with recent gains lacking great volume conviction. Subsequent gains for new highs backed by at least +40% may trigger a technical buy signal. Fundamentals remained strong through the Dec '18 quarter. Went through a deep consolidation below its 200 DMA line after dropped from the Featured Stocks list on 10/05/18. See the latest FSU analysis for more details and a new annotated graph.
>>> FEATURED STOCK ARTICLE : Rebounding Near High After Deep Consolidation - 3/13/2019 |
View all notes |
Set NEW NOTE alert |
Company Profile |
SEC
News |
Chart |
Request a new note
C
A
S
I |
PAYC
-
NYSE
Paycom Software Inc
COMPUTER SOFTWARE and SERVICES - Application Software
|
$181.69
|
-0.25
-0.14% |
$183.50
|
466,099
71.27% of 50 DAV
50 DAV is 654,000
|
$186.00
-2.32%
|
2/6/2019
|
$171.66
|
PP = $164.18
|
|
MB = $172.39
|
Most Recent Note - 3/14/2019 5:04:50 PM
G - Posted a gain on average volume today for its second best close of all time. It has not formed a sound new base of sufficient length. The prior high ($164) defines initial support to watch above its 50 DMA line ($157.61).
>>> FEATURED STOCK ARTICLE : Consolidating Near All-Time High - 3/8/2019 |
View all notes |
Set NEW NOTE alert |
Company Profile |
SEC
News |
Chart |
Request a new note
C
A
S
I |
PYPL
-
NASDAQ
Paypal Holdings Inc
Finance-CrdtCard/PmtPr
|
$100.27
|
-0.46
-0.46% |
$101.83
|
5,463,358
68.96% of 50 DAV
50 DAV is 7,922,000
|
$101.26
-0.98%
|
1/24/2019
|
$92.56
|
PP = $93.80
|
|
MB = $98.49
|
Most Recent Note - 3/13/2019 7:18:22 PM
G - Posted a solid gain today with +18% above average volume and color code is changed to green after it finished above its "max buy" level. Recent gains into new high territory came with lackluster volume, not indicative of great institutional buying demand. Prior highs in the $92 area define support above its 50 DMA line ($92.68).
>>> FEATURED STOCK ARTICLE : Wedging into New High Territory With Gains Lacking Volume - 2/22/2019 |
View all notes |
Set NEW NOTE alert |
Company Profile |
SEC
News |
Chart |
Request a new note
C
A
S
I |
ALRM
-
NASDAQ
Alarm.com Holdings Inc
Security/Sfty
|
$61.72
|
+0.73
1.20% |
$62.16
|
372,294
64.19% of 50 DAV
50 DAV is 580,000
|
$65.85
-6.27%
|
1/22/2019
|
$60.52
|
PP = $60.30
|
|
MB = $63.32
|
Most Recent Note - 3/18/2019 11:26:21 AM
G - Found support near its 50 DMA line ($60.71). Weak action came after it reported earnings +12% on +25% sales revenues for the Dec '18 quarter, below the +25% minimum earnings guideline (C criteria), raising fundamental concerns.
>>> FEATURED STOCK ARTICLE : Volume Totals Cooling While Perched at All-Time High - 2/20/2019 |
View all notes |
Set NEW NOTE alert |
Company Profile |
SEC
News |
Chart |
Request a new note
C
A
S
I |
Symbol/Exchange
Company Name
Industry Group |
PRICE |
CHANGE
(%Change) |
Day High |
Volume
(% DAV)
(% 50 day avg vol) |
52 Wk Hi
% From Hi |
Featured
Date |
Price
Featured |
Pivot Featured |
|
Max Buy |
PLNT
-
NYSE
Planet Fitness Inc Cl A
Leisure-Services
|
$67.25
|
-0.05
-0.07% |
$67.86
|
985,739
69.37% of 50 DAV
50 DAV is 1,421,000
|
$67.99
-1.09%
|
11/7/2018
|
$57.10
|
PP = $55.45
|
|
MB = $58.22
|
Most Recent Note - 3/13/2019 7:09:12 PM
G - Posted a 12th consecutive gain today with ever-decreasing volume while hitting another new all-time high. Rallying after testing support at its 50 DMA line ($58.77). Reported earnings +42% on +30% sales revenues for the Dec '18 quarter.
>>> FEATURED STOCK ARTICLE : Met Distributional Pressure While Hitting New High After Earnings - 2/27/2019 |
View all notes |
Set NEW NOTE alert |
Company Profile |
SEC
News |
Chart |
Request a new note
C
A
S
I |
TEAM
-
NASDAQ
Atlassian Corp Plc Cl A
Comp Sftwr-Spec Enterprs
|
$111.22
|
+0.95
0.86% |
$111.73
|
724,327
40.47% of 50 DAV
50 DAV is 1,790,000
|
$112.58
-1.21%
|
1/7/2019
|
$94.68
|
PP = $98.31
|
|
MB = $103.23
|
Most Recent Note - 3/13/2019 12:36:37 PM
G - Posted 4 consecutive gains with light or average volume, challenging its all-time high, extended from any sound base. Prior high ($98.21) and 50 DMA line ($99.84) define near-term support to watch on pullbacks. Fundamentals remain strong.
>>> FEATURED STOCK ARTICLE : Pullback on Higher Volume After Recent Gains With Less Volume - 3/4/2019 |
View all notes |
Set NEW NOTE alert |
Company Profile |
SEC
News |
Chart |
Request a new note
C
A
S
I |
GLOB
-
NYSE
Globant SA
Computer-Tech Services
|
$70.88
|
-1.44
-1.99% |
$72.90
|
168,955
74.76% of 50 DAV
50 DAV is 226,000
|
$74.00
-4.22%
|
2/15/2019
|
$69.35
|
PP = $70.00
|
|
MB = $73.50
|
Most Recent Note - 3/13/2019 7:15:52 PM
Y - Posted a solid gain today with +33% above average volume. Recently sputtering since rallying from an advanced "3-weeks tight" base. Prior low ($65.73 on 2/08/19) defines near-term support above its 50 DMA line ($66.13).
>>> FEATURED STOCK ARTICLE : Volume-Driven Gain From Advanced "3-Weeks Tight" Base - 2/15/2019 |
View all notes |
Set NEW NOTE alert |
Company Profile |
SEC
News |
Chart |
Request a new note
C
A
S
I |
TTD
-
NASDAQ
The Trade Desk Inc Cl A
Comml Svcs-Advertising
|
$203.75
|
-3.25
-1.57% |
$209.74
|
1,650,061
118.79% of 50 DAV
50 DAV is 1,389,000
|
$211.87
-3.83%
|
2/6/2019
|
$148.65
|
PP = $149.00
|
|
MB = $156.45
|
Most Recent Note - 3/18/2019 11:45:33 AM
G - Perched at its all-time high, very extended from the prior base. Prior high ($161) defines initial support to watch. Bullish action came after it recently reported earnings +102% on +56% sales revenues for the Dec '18 quarter.
>>> FEATURED STOCK ARTICLE : Near High After Third Consecutive Gain with Light Volume - 2/12/2019 |
View all notes |
Set NEW NOTE alert |
Company Profile |
SEC
News |
Chart |
Request a new note
C
A
S
I |