You are not logged in.
This means you
CAN ONLY VIEW reports that were published prior to Tuesday, April 1, 2025.
You
MUST UPGRADE YOUR MEMBERSHIP if you want to see any current reports.
AFTER MARKET UPDATE - FRIDAY, JANUARY 31ST, 2025
Previous After Market Report Next After Market Report >>>
|
|
|
|
DOW |
-337.47 |
44,544.66 |
-0.75% |
|
Volume |
1,289,933,428 |
+18% |
|
Volume |
8,342,680,700 |
+24% |
|
NASDAQ |
-54.31 |
19,627.44 |
-0.28% |
|
Advancers |
747 |
28% |
|
Advancers |
1,509 |
35% |
|
S&P 500 |
-30.64 |
6,040.53 |
-0.50% |
|
Decliners |
1,941 |
72% |
|
Decliners |
2,823 |
65% |
|
Russell 2000 |
-19.76 |
2,287.69 |
-0.86% |
|
52 Wk Highs |
95 |
|
|
52 Wk Highs |
114 |
|
|
S&P 600 |
-12.15 |
1,448.24 |
-0.83% |
|
52 Wk Lows |
28 |
|
|
52 Wk Lows |
97 |
|
|
 |
Weak Finish Friday Followed News of New Tariffs
Kenneth J. Gruneisen - Passed the CAN SLIM® Master's Exam
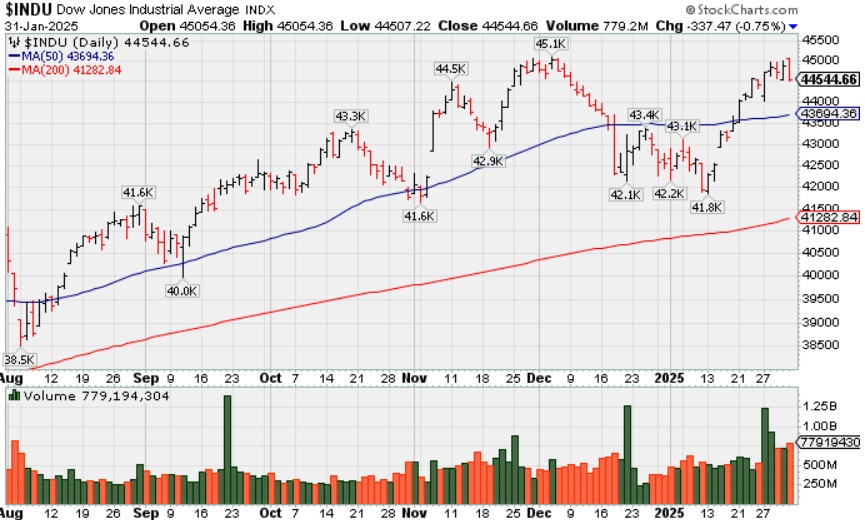
The Dow Jones Industrial Average fell -0.8%, the S&P 500 registered a -0.5% decline, and the Nasdaq Composite was -0.3% lower on Friday. Volume totals reported were higher than the prior session totals on the NYSE and on the Nasdaq exchange, action indicative of increasing institutional selling pressure termed "distribution". Breadth was negative as decliners led advancer by almost a 3-1 margin on the NYSE and by nearly 2-1 at the Nasdaq exchange. There were 55 high-ranked companies from the Leaders List that hit new 52-week highs and were listed on the BreakOuts Page, versus 76 on the prior session. New 52-week highs totals contracted yet still outnumbered new 52-week lows on the NYSE and on the Nasdaq exchange. The major indices shook off recent pressure (M criteria) as leadership improved meaningfully, however healthy leadership remains necessary in order to avoid a more worrisome correction. Disciplined investors know to only buy stocks meeting all key criteria as they emerge from properly formed bases.
PICTURED: The Dow Jones Industrial Average has been hovering near its all-time high.
26 of the 30 Dow components ended lower. Nine of the 11 S&P 500 sectors closed lower. Market weakness on Friday afternoon came as the White House confirmed that 25% tariffs for Canada and Mexico, and a 10% tariff for China, will begin on February 1. The basis for the tariff actions were tied to immigration, trade deficit, and fentanyl issues.
Apple (AAPL -0.7%) ended slightly lower after trading up as much as 4.0% after reporting earnings. AbbVie (ABBV +4.7%) and Atlassian (TEAM +14.9%) were among the earnings-related winners. Exxon Mobil (XOM -2.5%), Chevron (CVX -4.6%), and Colgate-Palmolive (CL -4.6%) each lost ground.
The core-PCE Price Index (the Fed's preferred inflation gauge) was up 2.8% year-over-year for the third month in a row following a 0.2% month-over-month increase. However, Treasury yields jumped in response to the tariff talk. The 10-yr yield settled six basis points higher at 4.57% and the 2-yr yield rose four basis points to 4.24%.
|
 Kenneth J. Gruneisen started out as a licensed stockbroker in August 1987, a couple of months prior to the historic stock market crash that took the Dow Jones Industrial Average down -22.6% in a single day. He has published daily fact-based fundamental and technical analysis on high-ranked stocks online for two decades. Through FACTBASEDINVESTING.COM, Kenneth provides educational articles, news, market commentary, and other information regarding proven investment systems that work in good times and bad.
Comments contained in the body of this report are technical opinions only and are not necessarily those of Gruneisen Growth Corp. The material herein has been obtained from sources believed to be reliable and accurate, however, its accuracy and completeness cannot be guaranteed. Our firm, employees, and customers may effect transactions, including transactions contrary to any recommendation herein, or have positions in the securities mentioned herein or options with respect thereto. Any recommendation contained in this report may not be suitable for all investors and it is not to be deemed an offer or solicitation on our part with respect to the purchase or sale of any securities. |
|
 |
Retail Index Edged Higher Amid Broader Losses
Kenneth J. Gruneisen - Passed the CAN SLIM® Master's Exam
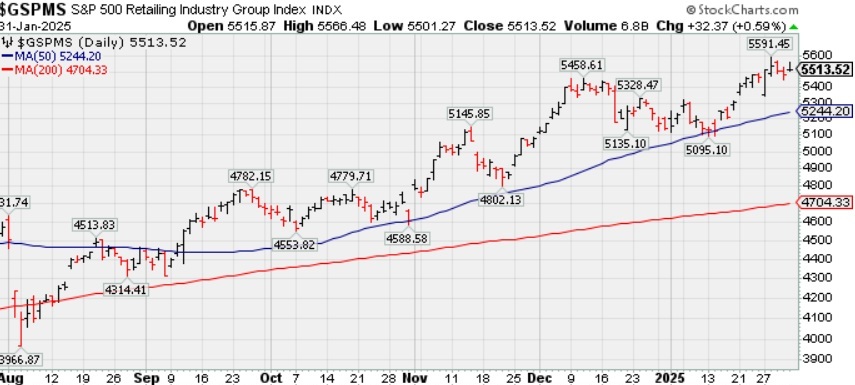
The Broker/Dealer Index ($XBD -0.71%) and the Bank Index ($BKX -0.63%) both finished lower while the Retail Index ($RLX +0.59%) edged higher. The tech sector was mixed as the Networking Index ($NWX +1.91%) posted a standout gain while the Biotech Index ($BTK -0.41%) and the Semiconductor Index ($SOX -0.29%) ended slightly lower. Commodity-linked groups had a negative bias as the Gold & Silver Index ($XAU -1.32%), Oil Services Index ($OSX -1.43%), and the Integrated Oil Index ($XOI -2.92%) ended unanimously lower.
PICTURED: The Retail Index ($RLX +0.59%) recently found prompt support at its 50-day moving average (DMA) line and rallied to new all-time highs.
| Oil Services |
$OSX |
72.56 |
-1.05 |
-1.43% |
-0.05% |
| Integrated Oil |
$XOI |
1,816.10 |
-54.71 |
-2.92% |
+2.98% |
| Semiconductor |
$SOX |
5,015.85 |
-14.68 |
-0.29% |
+0.72% |
| Networking |
$NWX |
1,314.52 |
+24.57 |
+1.91% |
+5.28% |
| Broker/Dealer |
$XBD |
901.68 |
-6.46 |
-0.71% |
+11.96% |
| Retail Index |
$RLX |
5,513.52 |
+32.37 |
+0.59% |
+6.55% |
| Gold & Silver |
$XAU |
153.99 |
-2.06 |
-1.32% |
+12.26% |
| Bank |
$BKX |
138.50 |
-0.88 |
-0.63% |
+8.65% |
| Biotech |
$BTK |
6,267.04 |
-26.02 |
-0.41% |
+9.07% |
|
|
|
 |
Featured Stocks
Kenneth J. Gruneisen - Passed the CAN SLIM® Master's Exam
|
|
|
Color Codes Explained :
Y - Better candidates highlighted by our
staff of experts.
G - Previously featured
in past reports as yellow but may no longer be buyable under the
guidelines.
***Last / Change / Volume data in this table is the closing quote data***
Symbol/Exchange
Company Name
Industry Group |
PRICE |
CHANGE
(%Change) |
Day High |
Volume
(% DAV)
(% 50 day avg vol) |
52 Wk Hi
% From Hi |
Featured
Date |
Price
Featured |
Pivot Featured |
|
Max Buy |
 TXRH
-
NASDAQ
TXRH
-
NASDAQ
Texas Roadhouse Inc
LEISURE - Restaurants
|
$181.10
|
-1.55
-0.85% |
$182.37
|
853,658
248.88% of 50 DAV
50 DAV is 343,000
|
$206.04
-12.10%
|
7/26/2024
|
$173.08
|
PP = $175.82
|
|
MB = $184.61
|
 Most Recent Note - 1/31/2025 11:31:31 PM
Pulled back for a small loss today with +19% above average volume. Recently finding support above its 200 DMA line ($175). Its Relative Strength Rating has slumped to 72, below the 80+ minimum guideline for buy candidates. Its 50 DMA line ($187) is now downward sloping and has acted as resistance. A rebound above that important short-term average is needed for its outlook to improve. It will be dropped from the Featured Stocks list tonight.
>>> FEATURED STOCK ARTICLE : Lingering Below 50-Day Moving Average Line - 1/23/2025 |
View all notes |
Set NEW NOTE alert |
Company Profile |
SEC
News |
Chart |
Request a new note
C
A
S
I |
HWM
-
NYSE
Howmet Aerospace
Aerospace/Defense
|
$126.58
|
-0.79
-0.62% |
$128.31
|
2,363,137
94.75% of 50 DAV
50 DAV is 2,494,000
|
$129.10
-1.95%
|
1/8/2025
|
$115.05
|
PP = $120.81
|
|
MB = $126.85
|
Most Recent Note - 1/28/2025 5:15:08 PM
Y - Posted a gain today with above average volume, consolidating near its all-time high. Recent volume-driven gains above the pivot point triggered a new (or add-on) technical buy signal. Near-term support to watch is the prior high ($120.71 on 1/06/25) and its 50 DMA line ($116). Fundamentals remain strong.
>>> FEATURED STOCK ARTICLE : Extended From Prior Base and Perched at High - 12/5/2024 |
View all notes |
Set NEW NOTE alert |
Company Profile |
SEC
News |
Chart |
Request a new note
C
A
S
I |
NGVC
-
NYSE
Natural Grocers
Retail-Super/Mini Mkts
|
$43.54
|
-0.54
-1.23% |
$44.50
|
88,260
76.75% of 50 DAV
50 DAV is 115,000
|
$47.57
-8.47%
|
11/5/2024
|
$30.57
|
PP = $30.42
|
|
MB = $31.94
|
Most Recent Note - 1/29/2025 6:12:20 PM
G - Posted a 3rd consecutive gain today with average volume. Found support recently at its 50 DMA line ($40.88). More damaging losses would raise serious concerns and trigger a worrisome technical sell signal. Reported Sep '24 quarterly earnings +50% on +9% sales revenues versus the year-ago period.
>>> FEATURED STOCK ARTICLE : Consolidating After Considerable Rally to New Highs - 12/16/2024 |
View all notes |
Set NEW NOTE alert |
Company Profile |
SEC
News |
Chart |
Request a new note
C
A
S
I |
CLS
-
NYSE
Celestica
Elec-Contract Mfg
|
$123.47
|
+9.32
8.16% |
$133.67
|
11,231,864
380.35% of 50 DAV
50 DAV is 2,953,000
|
$131.23
-5.91%
|
10/11/2024
|
$57.62
|
PP = $63.59
|
|
MB = $66.77
|
Most Recent Note - 1/31/2025 1:22:16 PM
G - Gapped up today hitting a new all-time high with its 4th consecutive big volume-driven gain, promptly rebounding above its 50 DMA line ($97.55). It has not formed a sound base but faces no resistance due to overhead supply.
>>> FEATURED STOCK ARTICLE : New High After 6th Consecutive Gain - 1/22/2025 |
View all notes |
Set NEW NOTE alert |
Company Profile |
SEC
News |
Chart |
Request a new note
C
A
S
I |
RMD
-
NYSE
ResMed
Medical-Products
|
$236.18
|
-21.47
-8.33% |
$259.95
|
2,599,352
326.55% of 50 DAV
50 DAV is 796,000
|
$263.05
-10.21%
|
10/25/2024
|
$256.64
|
PP = $255.28
|
|
MB = $268.04
|
Most Recent Note - 1/31/2025 11:27:17 PM
G - Abruptly retreated after hitting a new 52-week high and violated its 50 DMA line ($240) with a damaging volume-driven loss triggering a technical sell signal and its color code is changed to green. Only a prompt rebound above the 50 DMA line would help its outlook improve. Its Relative Strength Rating is 80, at the 80+ minimum guideline for buy candidates.
>>> FEATURED STOCK ARTICLE : Recent Gains Challenged 52-week High - 1/29/2025 |
View all notes |
Set NEW NOTE alert |
Company Profile |
SEC
News |
Chart |
Request a new note
C
A
S
I |
Symbol/Exchange
Company Name
Industry Group |
PRICE |
CHANGE
(%Change) |
Day High |
Volume
(% DAV)
(% 50 day avg vol) |
52 Wk Hi
% From Hi |
Featured
Date |
Price
Featured |
Pivot Featured |
|
Max Buy |
ATGE
-
NYSE
Adtalem Global Education
Consumer Svcs-Education
|
$107.13
|
+4.71
4.60% |
$112.44
|
920,591
243.54% of 50 DAV
50 DAV is 378,000
|
$103.15
3.86%
|
12/31/2024
|
$91.50
|
PP = $93.03
|
|
MB = $97.68
|
Most Recent Note - 1/31/2025 1:00:45 PM
G - Gapped up today hitting a new all-time high. Its 50 DMA line ($92.85) defines initial support to watch. Fundamentals remain strong.
>>> FEATURED STOCK ARTICLE : Hovering Near High With Volume Totals Cooling - 12/4/2024 |
View all notes |
Set NEW NOTE alert |
Company Profile |
SEC
News |
Chart |
Request a new note
C
A
S
I |
ATAT
-
NASDAQ
Atour Lifestyle Hldgs ADR
Leisure-Lodging
|
$27.41
|
-0.79
-2.80% |
$28.40
|
898,169
75.67% of 50 DAV
50 DAV is 1,187,000
|
$29.90
-8.33%
|
12/9/2024
|
$29.34
|
PP = $29.25
|
|
MB = $30.71
|
Most Recent Note - 1/28/2025 5:16:43 PM
Y - Posted a small gain today with below average volume. Consolidating after a rebound above its 50 DMA line ($26.52) helped its outlook to improve.
>>> FEATURED STOCK ARTICLE : Volume Above Average Behind Breakout Gain - 12/9/2024 |
View all notes |
Set NEW NOTE alert |
Company Profile |
SEC
News |
Chart |
Request a new note
C
A
S
I |
LRN
-
NYSE
Stride
Consumer Svcs-Education
|
$134.90
|
+0.77
0.57% |
$137.54
|
1,286,080
171.71% of 50 DAV
50 DAV is 749,000
|
$137.25
-1.71%
|
1/10/2025
|
$114.31
|
PP = $112.90
|
|
MB = $118.55
|
Most Recent Note - 1/29/2025 12:43:07 PM
G - Gapped up today hitting a new all-time high, getting very extended from any sound base. Fundamentals remain strong after reporting Dec '24 quarterly earnings +32% on +16% sales revenues versus the year-ago period. Prior high ($112.80 on 12/04/24) defines near-term support above its 50 DMA line ($108.67).
>>> FEATURED STOCK ARTICLE : Encountered Distributional Pressure Amid Broader Weakness - 1/10/2025 |
View all notes |
Set NEW NOTE alert |
Company Profile |
SEC
News |
Chart |
Request a new note
C
A
S
I |
HUBS
-
NYSE
HubSpot
Comp Sftwr-Spec Enterprs
|
$779.53
|
+7.54
0.98% |
$800.00
|
515,225
117.36% of 50 DAV
50 DAV is 439,000
|
$811.79
-3.97%
|
1/27/2025
|
$768.96
|
PP = $762.57
|
|
MB = $800.70
|
Most Recent Note - 1/28/2025 5:10:18 PM
Y - Hit a new 52-week high with today's 2nd consecutive gain backed by +103% above average volume triggering a technical buy signal. Color code was changed to yellow when highlighted in the prior mid-day report with new pivot point cited based on its 12/04/24 high plus 10 cents, rallying from support near its 50 DMA line ($717). It was noted - "A gain and strong close above the pivot point may clinch a technical buy signal. Fundamentals remain strong. It went through a deep consolidation and rebounded since dropped from the Featured Stocks list when last noted on 5/02/24." See the latest FSU analysis for more details and a new annotated graph.
>>> FEATURED STOCK ARTICLE : Breakout Backed by Volume Twice the Average Daily - 1/28/2025 |
View all notes |
Set NEW NOTE alert |
Company Profile |
SEC
News |
Chart |
Request a new note
C
A
S
I |
NOW
-
NYSE
ServiceNow
Computer Sftwr-Enterprse
|
$1,018.38
|
+5.63
0.56% |
$1,035.75
|
2,867,304
207.32% of 50 DAV
50 DAV is 1,383,000
|
$1,198.09
-15.00%
|
1/27/2025
|
$771.75
|
PP = $1,158.00
|
|
MB = $1,215.90
|
Most Recent Note - 1/31/2025 1:42:49 PM
G - Holding its ground today after gapping down on the prior session violating its 50 DMA line ($1,080) and undercutting the prior low ($999 on 1/13/25) with a volume-driven loss triggering a technical sell signal. Color code is changed to green, and a rebound above the 50 DMA line is needed for its outlook to improve. It abruptly retreated from its all-time high after reporting Dec '24 quarterly earnings +18% on +21% sales revenues versus the year-ago period. Volume and volatility often increase near earnings news.
>>> FEATURED STOCK ARTICLE : Hit New High but Ended Session Below the New Pivot Point Cited - 1/27/2025 |
View all notes |
Set NEW NOTE alert |
Company Profile |
SEC
News |
Chart |
Request a new note
C
A
S
I |
Symbol/Exchange
Company Name
Industry Group |
PRICE |
CHANGE
(%Change) |
Day High |
Volume
(% DAV)
(% 50 day avg vol) |
52 Wk Hi
% From Hi |
Featured
Date |
Price
Featured |
Pivot Featured |
|
Max Buy |
|
|
|
THESE ARE NOT BUY RECOMMENDATIONS!
Comments contained in the body of this report are technical
opinions only. The material herein has been obtained
from sources believed to be reliable and accurate, however,
its accuracy and completeness cannot be guaranteed.
This site is not an investment advisor, hence it does
not endorse or recommend any securities or other investments.
Any recommendation contained in this report may not
be suitable for all investors and it is not to be deemed
an offer or solicitation on our part with respect to
the purchase or sale of any securities. All trademarks,
service marks and trade names appearing in this report
are the property of their respective owners, and are
likewise used for identification purposes only.
This report is a service available
only to active Paid Premium Members.
You may opt-out of receiving report notifications
at any time. Questions or comments may be submitted
by writing to Premium Membership Services 665 S.E. 10 Street, Suite 201 Deerfield Beach, FL 33441-5634 or by calling 1-800-965-8307
or 954-785-1121.
|
|
|