You are not logged in.
This means you
CAN ONLY VIEW reports that were published prior to Monday, March 31, 2025.
You
MUST UPGRADE YOUR MEMBERSHIP if you want to see any current reports.
AFTER MARKET UPDATE - MONDAY, FEBRUARY 3RD, 2025
Previous After Market Report Next After Market Report >>>
|
|
|
|
DOW |
-122.75 |
44,421.91 |
-0.28% |
|
Volume |
1,105,730,642 |
-14% |
|
Volume |
8,479,938,900 |
+2% |
|
NASDAQ |
-235.49 |
19,391.96 |
-1.20% |
|
Advancers |
870 |
32% |
|
Advancers |
1,427 |
32% |
|
S&P 500 |
-45.96 |
5,994.57 |
-0.76% |
|
Decliners |
1,847 |
68% |
|
Decliners |
2,982 |
68% |
|
Russell 2000 |
-29.28 |
2,258.42 |
-1.28% |
|
52 Wk Highs |
38 |
|
|
52 Wk Highs |
63 |
|
|
S&P 600 |
-21.18 |
1,427.06 |
-1.46% |
|
52 Wk Lows |
98 |
|
|
52 Wk Lows |
235 |
|
|
 |
Breadth Turned Negative as Leadership Waned Again
Kenneth J. Gruneisen - Passed the CAN SLIM® Master's Exam
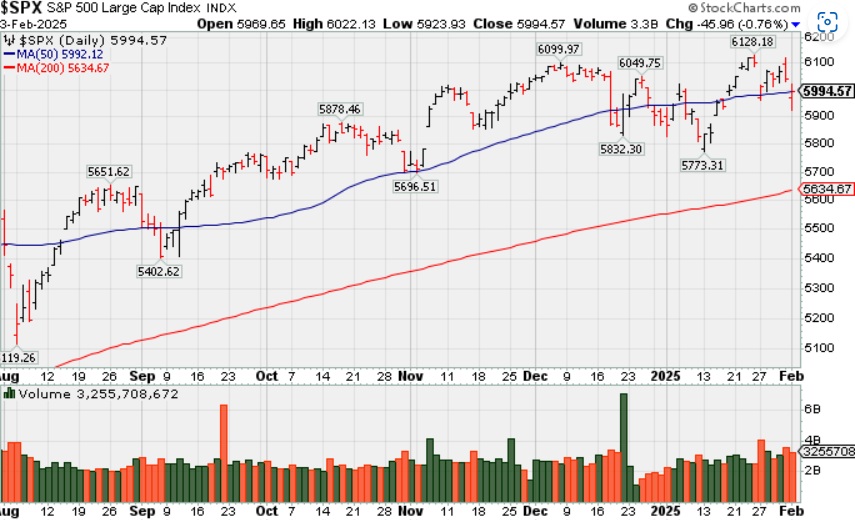
The major indices ended lower on Monday. Volume totals reported were lighter than the prior session on the NYSE and slightly higer on the Nasdaq exchange. Breadth was negative as decliners led advancers by more than a 2-1 margin on the NYSE and on the Nasdaq exchange. Leadership waned as there were 22 high-ranked companies from the Leaders List that hit new 52-week highs and were listed on the BreakOuts Page, versus 56 on the prior session. New 52-week highs totals contracted and were outnumbered by new 52-week lows on the NYSE and on the Nasdaq exchange. The major indices have come under recent pressure (M criteria) as leadership has thinned again. Healthy leadership remains necessary in order to avoid a more worrisome correction. Disciplined investors know to only buy stocks meeting all key criteria as they emerge from properly formed bases.
PICTURED: The S&P 500 Index slumped near its 50-day moving average (DMA) line after recently churning higher volume near its all-time high.
Fears about tariffs impacting growth and pressuring inflation higher led the S&P 500 and Nasdaq Composite to trade down as much as 1.9% and 2.5%, respectively, and the Dow Jones Industrial Average was more than 650 points lower at its worst level. The weakness followed news that the US imposed a 25% tariff on imported goods from Canada and Mexico (only 10% for Canadian energy) and a 10% tariff on imported goods from China. News emerged, however, that Mexico's President Claudia Sheinbaum had a "good call" with President Trump and he agreed to "pause tariffs for one month." President Trump confirmed the update.
Heavily-weighted sectors like information technology (-1.8%), consumer discretionary (-1.4%), and financials (-0.4%) faced pressure. Consumer staples (+0.7%), utilities (+0.5%), and the energy (+0.4%) sector closed higher. Treasuries settled mixed as the 10-yr yield settled three basis points lower at 4.54% and the 2-yr yield settled three basis points higher at 4.27%. |
 Kenneth J. Gruneisen started out as a licensed stockbroker in August 1987, a couple of months prior to the historic stock market crash that took the Dow Jones Industrial Average down -22.6% in a single day. He has published daily fact-based fundamental and technical analysis on high-ranked stocks online for two decades. Through FACTBASEDINVESTING.COM, Kenneth provides educational articles, news, market commentary, and other information regarding proven investment systems that work in good times and bad.
Comments contained in the body of this report are technical opinions only and are not necessarily those of Gruneisen Growth Corp. The material herein has been obtained from sources believed to be reliable and accurate, however, its accuracy and completeness cannot be guaranteed. Our firm, employees, and customers may effect transactions, including transactions contrary to any recommendation herein, or have positions in the securities mentioned herein or options with respect thereto. Any recommendation contained in this report may not be suitable for all investors and it is not to be deemed an offer or solicitation on our part with respect to the purchase or sale of any securities. |
|
 |
Gold & Silver Index Higher Amid Broader Group Losses
Kenneth J. Gruneisen - Passed the CAN SLIM® Master's Exam
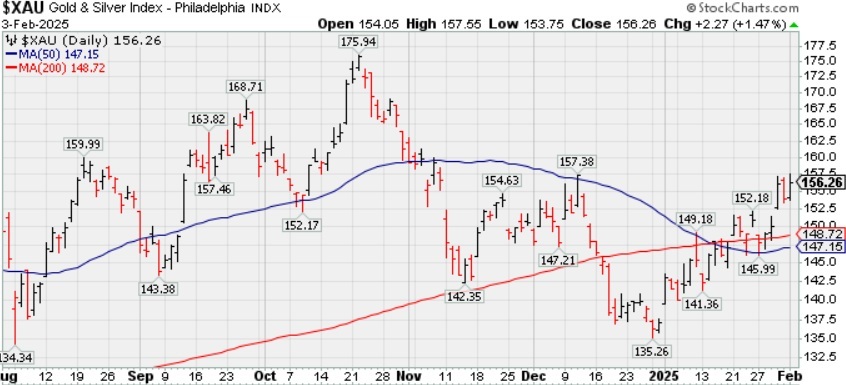
The Bank Index ($BKX -1.51%) and the Broker/Dealer Index ($XBD -0.38%) ended lower while the Retail Index ($RLX -0.24%) also ended slightly lower. The tech sector had a negative bias as the Semiconductor Index ($SOX -1.82%) outpaced the Networking Index ($NWX -0.90%) and the Biotech Index ($BTK -0.95%) to the downside. The Gold & Silver Index ($XAU +1.47%) posted a solid gain and the Oil Services Index ($OSX +0.16%) inched higher while the Integrated Oil Index ($XOI -0.71%) ended lower.
PICTURED: The Gold & Silver Index ($XAU +1.47%) was an outlier as it rose on Monday, making further progress above its 50-day and 200-day moving average (DMA) lines.
| Oil Services |
$OSX |
72.05 |
-0.52 |
-0.71% |
-0.76% |
| Integrated Oil |
$XOI |
1,819.09 |
+2.98 |
+0.16% |
+3.15% |
| Semiconductor |
$SOX |
4,924.81 |
-91.04 |
-1.82% |
-1.11% |
| Networking |
$NWX |
1,302.67 |
-11.85 |
-0.90% |
+4.33% |
| Broker/Dealer |
$XBD |
898.22 |
-3.47 |
-0.38% |
+11.53% |
| Retail Index |
$RLX |
5,500.03 |
-13.49 |
-0.24% |
+6.29% |
| Gold & Silver |
$XAU |
156.26 |
+2.27 |
+1.47% |
+13.91% |
| Bank |
$BKX |
136.41 |
-2.09 |
-1.51% |
+7.01% |
| Biotech |
$BTK |
6,207.52 |
-59.52 |
-0.95% |
+8.04% |
|
|
|
 |
Featured Stocks
Kenneth J. Gruneisen - Passed the CAN SLIM® Master's Exam
Symbol/Exchange
Company Name
Industry Group | PRICE | CHANGE
(%Change) | Day High | Volume
(% DAV)
(% 50 day avg vol) | 52 Wk Hi
% From Hi | Featured
Date | Price
Featured | Pivot Featured | | Max Buy |  HWM - NYSE HWM - NYSE
Howmet Aerospace
Aerospace/Defense | $126.38 | -0.20
-0.16% | $127.05 | 1,907,689
76.40% of 50 DAV
50 DAV is 2,497,000 | $129.10
-2.11%
| 1/8/2025 | $115.05 | PP = $120.81 | | MB = $126.85 | Most Recent Note - 1/28/2025 5:15:08 PM
Y - Posted a gain today with above average volume, consolidating near its all-time high. Recent volume-driven gains above the pivot point triggered a new (or add-on) technical buy signal. Near-term support to watch is the prior high ($120.71 on 1/06/25) and its 50 DMA line ($116). Fundamentals remain strong.
>>> FEATURED STOCK ARTICLE : Extended From Prior Base and Perched at High - 12/5/2024 | View all notes | Set NEW NOTE alert | Company Profile | SEC News | Chart | Request a new note C A S I | NGVC - NYSE
Natural Grocers
Retail-Super/Mini Mkts | $44.20 | +0.66
1.52% | $44.28 | 113,548
97.89% of 50 DAV
50 DAV is 116,000 | $47.57
-7.08%
| 11/5/2024 | $30.57 | PP = $30.42 | | MB = $31.94 | Most Recent Note - 1/29/2025 6:12:20 PM
G - Posted a 3rd consecutive gain today with average volume. Found support recently at its 50 DMA line ($40.88). More damaging losses would raise serious concerns and trigger a worrisome technical sell signal. Reported Sep ''24 quarterly earnings +50% on +9% sales revenues versus the year-ago period.
>>> FEATURED STOCK ARTICLE : Consolidating After Considerable Rally to New Highs - 12/16/2024 | View all notes | Set NEW NOTE alert | Company Profile | SEC News | Chart | Request a new note C A S I | CLS - NYSE
Celestica
Elec-Contract Mfg | $120.88 | -2.59
-2.10% | $126.15 | 8,342,022
267.89% of 50 DAV
50 DAV is 3,114,000 | $133.67
-9.57%
| 10/11/2024 | $57.62 | PP = $63.59 | | MB = $66.77 |  Most Recent Note - 2/3/2025 7:16:27 PM Most Recent Note - 2/3/2025 7:16:27 PM
G - Pulled back and traded in a wider than usual intra-day range today after hitting a new all-time high with 4 consecutive big volume-driven gains. Promptly rebounded above its 50 DMA line ($98.23). It has not formed a sound base but faces no resistance due to overhead supply.
>>> FEATURED STOCK ARTICLE : New High After 6th Consecutive Gain - 1/22/2025 | View all notes | Set NEW NOTE alert | Company Profile | SEC News | Chart | Request a new note C A S I | RMD - NYSE
Resmed Inc
HEALTH SERVICES - Medical Appliances and Equipment | $240.55 | +4.37
1.85% | $244.29 | 1,978,791
239.39% of 50 DAV
50 DAV is 826,600 | $263.05
-8.55%
| 10/25/2024 | $256.64 | PP = $255.28 | | MB = $268.04 | Most Recent Note - 1/31/2025 11:27:17 PM
G - Abruptly retreated after hitting a new 52-week high and violated its 50 DMA line ($240) with a damaging volume-driven loss triggering a technical sell signal and its color code is changed to green. Only a prompt rebound above the 50 DMA line would help its outlook improve. Its Relative Strength Rating is 80, at the 80+ minimum guideline for buy candidates.
>>> FEATURED STOCK ARTICLE : Recent Gains Challenged 52-week High - 1/29/2025 | View all notes | Set NEW NOTE alert | Company Profile | SEC News | Chart | Request a new note C A S I | ATGE - NYSE
Adtalem Global Education
Consumer Svcs-Education | $104.75 | -2.38
-2.22% | $105.23 | 646,038
169.12% of 50 DAV
50 DAV is 382,000 | $112.44
-6.84%
| 12/31/2024 | $91.50 | PP = $93.03 | | MB = $97.68 | Most Recent Note - 2/3/2025 7:14:13 PM
G - Pulled back today after hitting a new all-time high on the prior session. Its 50 DMA line ($93.20) defines initial support to watch. Fundamentals remain strong.
>>> FEATURED STOCK ARTICLE : Hovering Near High With Volume Totals Cooling - 12/4/2024 | View all notes | Set NEW NOTE alert | Company Profile | SEC News | Chart | Request a new note C A S I | Symbol/Exchange
Company Name
Industry Group | PRICE | CHANGE
(%Change) | Day High | Volume
(% DAV)
(% 50 day avg vol) | 52 Wk Hi
% From Hi | Featured
Date | Price
Featured | Pivot Featured | | Max Buy | ATAT - NASDAQ
Atour Lifestyle Hldgs ADR
Leisure-Lodging | $27.11 | -0.30
-1.09% | $27.52 | 601,249
50.74% of 50 DAV
50 DAV is 1,185,000 | $29.90
-9.33%
| 12/9/2024 | $29.34 | PP = $29.25 | | MB = $30.71 | Most Recent Note - 1/28/2025 5:16:43 PM
Y - Posted a small gain today with below average volume. Consolidating after a rebound above its 50 DMA line ($26.52) helped its outlook to improve.
>>> FEATURED STOCK ARTICLE : Volume Above Average Behind Breakout Gain - 12/9/2024 | View all notes | Set NEW NOTE alert | Company Profile | SEC News | Chart | Request a new note C A S I | LRN - NYSE
Stride
Consumer Svcs-Education | $137.66 | +2.76
2.05% | $138.43 | 1,198,354
156.65% of 50 DAV
50 DAV is 765,000 | $137.54
0.09%
| 1/10/2025 | $114.31 | PP = $112.90 | | MB = $118.55 | Most Recent Note - 2/3/2025 7:18:52 PM
G - Hit yet another new all-time high with today''s 5th consecutive volume-driven gain, getting very extended from any sound base. Fundamentals remain strong after reporting Dec ''24 quarterly earnings +32% on +16% sales revenues versus the year-ago period. Prior high ($112.80 on 12/04/24) defines near-term support above its 50 DMA line ($110.75).
>>> FEATURED STOCK ARTICLE : Encountered Distributional Pressure Amid Broader Weakness - 1/10/2025 | View all notes | Set NEW NOTE alert | Company Profile | SEC News | Chart | Request a new note C A S I | HUBS - NYSE
HubSpot
Comp Sftwr-Spec Enterprs | $764.92 | -14.61
-1.87% | $773.00 | 445,937
101.35% of 50 DAV
50 DAV is 440,000 | $811.79
-5.77%
| 1/27/2025 | $768.96 | PP = $762.57 | | MB = $800.70 | Most Recent Note - 1/28/2025 5:10:18 PM
Y - Hit a new 52-week high with today''s 2nd consecutive gain backed by +103% above average volume triggering a technical buy signal. Color code was changed to yellow when highlighted in the prior mid-day report with new pivot point cited based on its 12/04/24 high plus 10 cents, rallying from support near its 50 DMA line ($717). It was noted - "A gain and strong close above the pivot point may clinch a technical buy signal. Fundamentals remain strong. It went through a deep consolidation and rebounded since dropped from the Featured Stocks list when last noted on 5/02/24." See the latest FSU analysis for more details and a new annotated graph.
>>> FEATURED STOCK ARTICLE : Breakout Backed by Volume Twice the Average Daily - 1/28/2025 | View all notes | Set NEW NOTE alert | Company Profile | SEC News | Chart | Request a new note C A S I | NOW - NYSE
ServiceNow
Computer Sftwr-Enterprse | $1,020.94 | +2.56
0.25% | $1,031.00 | 2,014,190
142.85% of 50 DAV
50 DAV is 1,410,000 | $1,198.09
-14.79%
| 1/27/2025 | $771.75 | PP = $1,158.00 | | MB = $1,215.90 | Most Recent Note - 1/31/2025 1:42:49 PM
G - Holding its ground today after gapping down on the prior session violating its 50 DMA line ($1,080) and undercutting the prior low ($999 on 1/13/25) with a volume-driven loss triggering a technical sell signal. Color code is changed to green, and a rebound above the 50 DMA line is needed for its outlook to improve. It abruptly retreated from its all-time high after reporting Dec '24 quarterly earnings +18% on +21% sales revenues versus the year-ago period. Volume and volatility often increase near earnings news.
>>> FEATURED STOCK ARTICLE : Hit New High but Ended Session Below the New Pivot Point Cited - 1/27/2025 | View all notes | Set NEW NOTE alert | Company Profile | SEC News | Chart | Request a new note C A S I |
|
|
|
Color Codes Explained :
Y - Better candidates highlighted by our
staff of experts.
G - Previously featured
in past reports as yellow but may no longer be buyable under the
guidelines.
***Last / Change / Volume data in this table is the closing quote data***
|
|
|
THESE ARE NOT BUY RECOMMENDATIONS!
Comments contained in the body of this report are technical
opinions only. The material herein has been obtained
from sources believed to be reliable and accurate, however,
its accuracy and completeness cannot be guaranteed.
This site is not an investment advisor, hence it does
not endorse or recommend any securities or other investments.
Any recommendation contained in this report may not
be suitable for all investors and it is not to be deemed
an offer or solicitation on our part with respect to
the purchase or sale of any securities. All trademarks,
service marks and trade names appearing in this report
are the property of their respective owners, and are
likewise used for identification purposes only.
This report is a service available
only to active Paid Premium Members.
You may opt-out of receiving report notifications
at any time. Questions or comments may be submitted
by writing to Premium Membership Services 665 S.E. 10 Street, Suite 201 Deerfield Beach, FL 33441-5634 or by calling 1-800-965-8307
or 954-785-1121.
|
|
|