You are not logged in.
This means you
CAN ONLY VIEW reports that were published prior to Tuesday, April 15, 2025.
You
MUST UPGRADE YOUR MEMBERSHIP if you want to see any current reports.
AFTER MARKET UPDATE - THURSDAY, NOVEMBER 16TH, 2023
Previous After Market Report Next After Market Report >>>
|
|
|
|
DOW |
-45.74 |
34,945.47 |
-0.13% |
|
Volume |
906,293,358 |
-10% |
|
Volume |
4,558,808,900 |
-10% |
|
NASDAQ |
+9.84 |
14,113.67 |
+0.07% |
|
Advancers |
1,056 |
38% |
|
Advancers |
1,458 |
34% |
|
S&P 500 |
+5.36 |
4,508.24 |
+0.12% |
|
Decliners |
1,738 |
62% |
|
Decliners |
2,802 |
66% |
|
Russell 2000 |
-27.46 |
1,773.76 |
-1.52% |
|
52 Wk Highs |
41 |
|
|
52 Wk Highs |
50 |
|
|
S&P 600 |
-18.50 |
1,158.55 |
-1.57% |
|
52 Wk Lows |
22 |
|
|
52 Wk Lows |
131 |
|
|
 |
Leadership Thinned and Indices Were Little Changed
Kenneth J. Gruneisen - Passed the CAN SLIM® Master's Exam
The S&P 500 and the Nasdaq Composite eked out slim gains but the Dow Industrials ended lower. Volume was lighter than the prior session on the NYSE and on the Nasdaq exchange. Decliners led advancers by more than a 3-2 margin on the NYSE and nearly 2-1 on the Nasdaq exchange. There were 28 high-ranked companies from the Leaders List that hit new 52-week highs and were listed on the BreakOuts Page, versus the total of 87 on the prior session. New 52-week highs outnumbered new 52-week lows on the NYSE but new lows outnumbered new highs on the Nasdaq exchange. The major indices are in a confirmed uptrend (M criteria). New buying efforts should be only made in stocks fitting all key criteria of the fact-based investment system.
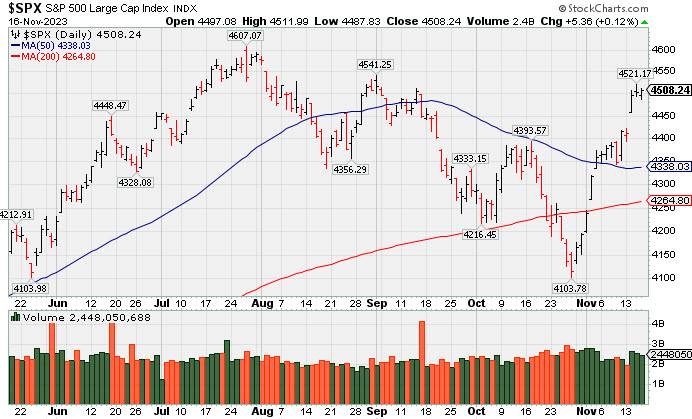
PICTURED: The S&P 500 Index closed -2.5% off its 52-week high while posting its 12th gain in the span of 14 sessions. Four of the 11 S&P 500 sectors declined. The energy sector (-2.1%) saw the largest loss, falling as oil prices slid ($72.92/bbl, -3.64, -4.8%) in response to slowdown worries and technical selling after closing Wednesday below their 200-day moving average. The consumer staples sector (-1.2%) was also a poor performer. Communication services (+0.9%) and the information technology (+0.7%) sector registered gains.
Big negative reactions to disappointing earnings and/or guidance from Walmart (WMT -8.09%), Cisco (CSCO -9.83%), and Palo Alto Networks (PANW -5.42%) created pressure on the market. Small and mid cap stocks lagged their larger peers after outperforming all week. The Russell 2000 fell 1.6%, weighed down by its energy components.
The 10-yr note yield fell nine basis points to 4.45% and the 2-yr note yield declined six basis points to 4.85%.
|
 Kenneth J. Gruneisen started out as a licensed stockbroker in August 1987, a couple of months prior to the historic stock market crash that took the Dow Jones Industrial Average down -22.6% in a single day. He has published daily fact-based fundamental and technical analysis on high-ranked stocks online for two decades. Through FACTBASEDINVESTING.COM, Kenneth provides educational articles, news, market commentary, and other information regarding proven investment systems that work in good times and bad.
Comments contained in the body of this report are technical opinions only and are not necessarily those of Gruneisen Growth Corp. The material herein has been obtained from sources believed to be reliable and accurate, however, its accuracy and completeness cannot be guaranteed. Our firm, employees, and customers may effect transactions, including transactions contrary to any recommendation herein, or have positions in the securities mentioned herein or options with respect thereto. Any recommendation contained in this report may not be suitable for all investors and it is not to be deemed an offer or solicitation on our part with respect to the purchase or sale of any securities. |
|
 |
Energy, Financial, Retail and Tech Groups Fell
Kenneth J. Gruneisen - Passed the CAN SLIM® Master's Exam
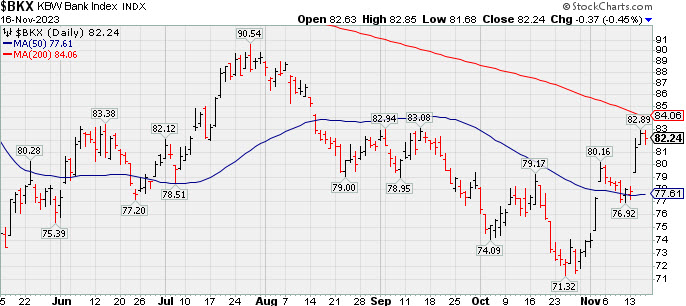
The Retail Index ($RLX -0.61%), Bank Index ($BKX -0.45%), and the Broker/Dealer Index ($XBD -1.21%) each lost ground. The tech sector saw a small gain for the Semiconductor Index ($SOX +0.32%) but losses for the Networking Index ($NWX -3.27%) and the Biotech Index ($BTK -0.80%). Commodity-linked groups were mixed as the Gold & Silver Index ($XAU +1.59%) posted a gain while the Integrated Oil Index ($XOI -2.35%) and the Oil Services Index ($OSX -3.59%) both suffered big losses.
PICTURED: The Bank Index ($BKX -0.45%) pulled back today after recently rebounding near its 200-day moving average (DMA) line.
| Oil Services |
$OSX |
82.39 |
-3.07 |
-3.59% |
-1.76% |
| Integrated Oil |
$XOI |
1,805.19 |
-43.37 |
-2.35% |
+1.00% |
| Semiconductor |
$SOX |
3,724.10 |
+12.01 |
+0.32% |
+47.07% |
| Networking |
$NWX |
707.55 |
-23.90 |
-3.27% |
-9.67% |
| Broker/Dealer |
$XBD |
485.94 |
-5.48 |
-1.12% |
+8.20% |
| Retail |
$RLX |
3,610.14 |
-22.22 |
-0.61% |
+31.09% |
| Gold & Silver |
$XAU |
113.35 |
+1.78 |
+1.59% |
-6.21% |
| Bank |
$BKX |
82.24 |
-0.37 |
-0.45% |
-18.45% |
| Biotech |
$BTK |
4,749.20 |
-38.16 |
-0.80% |
-10.07% |
|
|
|
 |
Featured Stocks
Kenneth J. Gruneisen - Passed the CAN SLIM® Master's Exam
|
|
|
Color Codes Explained :
Y - Better candidates highlighted by our
staff of experts.
G - Previously featured
in past reports as yellow but may no longer be buyable under the
guidelines.
***Last / Change / Volume data in this table is the closing quote data***
Symbol/Exchange
Company Name
Industry Group |
PRICE |
CHANGE
(%Change) |
Day High |
Volume
(% DAV)
(% 50 day avg vol) |
52 Wk Hi
% From Hi |
Featured
Date |
Price
Featured |
Pivot Featured |
|
Max Buy |
 ANET
-
NYSE
ANET
-
NYSE
Arista Networks
Computer-Networking
|
$213.30
|
-0.44
-0.21% |
$214.84
|
1,990,225
91.21% of 50 DAV
50 DAV is 2,182,000
|
$218.36
-2.32%
|
10/31/2023
|
$188.84
|
PP = $198.80
|
|
MB = $208.74
|
Most Recent Note - 11/15/2023 5:16:38 PM
G - There was a "negative reversal" today after quietly hitting another new all-time high. Prior highs in the $198 area define near-term support above its 50 DMA line ($192.78). Fundamentals remain strong.
>>> FEATURED STOCK ARTICLE : Powerful Gain Following Earnings Report for Arista Networks - 10/31/2023 |
View all notes |
Set NEW NOTE alert |
Company Profile |
SEC
News |
Chart |
Request a new note
C
A
S
I |
NVO
-
NYSE
Novo Nordisk ADR
Medical-Ethical Drugs
|
$99.53
|
+3.10
3.21% |
$99.63
|
4,918,375
96.99% of 50 DAV
50 DAV is 5,071,000
|
$104.00
-4.30%
|
11/2/2023
|
$100.97
|
PP = $104.10
|
|
MB = $109.31
|
 Most Recent Note - 11/16/2023 4:43:45 PM
Y - Gapped up today following 3 consecutive losses, finding prompt support at its 50 DMA line ($96.22). It remains perched only -4.3% off its 52-week high. Subsequent gains for new highs backed by at least +40% above average volume are needed to trigger a technical buy signal. More damaging losses would raise concerns.
>>> FEATURED STOCK ARTICLE : Approaching Prior High With Strong Fundamentals - 11/2/2023 |
View all notes |
Set NEW NOTE alert |
Company Profile |
SEC
News |
Chart |
Request a new note
C
A
S
I |
QLYS
-
NASDAQ
Qualys
Computer Sftwr-Security
|
$174.95
|
+0.10
0.06% |
$176.15
|
225,993
65.32% of 50 DAV
50 DAV is 346,000
|
$177.40
-1.38%
|
11/3/2023
|
$167.50
|
PP = $165.03
|
|
MB = $173.28
|
Most Recent Note - 11/15/2023 5:34:08 PM
G - Pulled back with lighter volume today after 4 consecutive gains to new all-time highs. Prior high ($165) defines initial support to watch on pullbacks.
>>> FEATURED STOCK ARTICLE : Powerful Breakout for Qualys - 11/3/2023 |
View all notes |
Set NEW NOTE alert |
Company Profile |
SEC
News |
Chart |
Request a new note
C
A
S
I |
AXON
-
NASDAQ
Axon Enterprise
Security/Sfty
|
$222.80
|
+1.72
0.78% |
$223.81
|
322,047
67.37% of 50 DAV
50 DAV is 478,000
|
$231.71
-3.85%
|
11/8/2023
|
$127.84
|
PP = $223.30
|
|
MB = $234.47
|
Most Recent Note - 11/15/2023 5:20:34 PM
Y - Reversed into the red and closed near the session low today after 3 consecutive small gains. Undercut the new pivot point last week following a noted technical breakout. More damaging losses below the recent low ($212.89 on 11/09/23) would raise greater concerns.
>>> FEATURED STOCK ARTICLE : Breakout for Axon as it Returns to Featured Stocks List - 11/8/2023 |
View all notes |
Set NEW NOTE alert |
Company Profile |
SEC
News |
Chart |
Request a new note
C
A
S
I |
TDG
-
NYSE
TransDigm Group
Aerospace/Defense
|
$986.95
|
-7.21
-0.73% |
$997.83
|
278,648
110.57% of 50 DAV
50 DAV is 252,000
|
$1,013.08
-2.58%
|
11/9/2023
|
$982.68
|
PP = $940.10
|
|
MB = $987.11
|
Most Recent Note - 11/15/2023 5:35:43 PM
G - Today's loss broke a streak of 13 consecutive gains. Ended near the session low on the prior session after trading above the $1,000 threshold. Fundamentals remain strong. Prior high ($940) defines initial support to watch on pullbacks.
>>> FEATURED STOCK ARTICLE : TransDigm's Big Gap Up Gain Triggered Technical Buy Signal - 11/9/2023 |
View all notes |
Set NEW NOTE alert |
Company Profile |
SEC
News |
Chart |
Request a new note
C
A
S
I |
Symbol/Exchange
Company Name
Industry Group |
PRICE |
CHANGE
(%Change) |
Day High |
Volume
(% DAV)
(% 50 day avg vol) |
52 Wk Hi
% From Hi |
Featured
Date |
Price
Featured |
Pivot Featured |
|
Max Buy |
PANW
-
NASDAQ
Palo Alto Networks
Computer Sftwr-Security
|
$242.30
|
-13.88
-5.42% |
$244.80
|
15,536,854
499.10% of 50 DAV
50 DAV is 3,113,000
|
$265.90
-8.88%
|
11/13/2023
|
$255.90
|
PP = $266.00
|
|
MB = $279.30
|
Most Recent Note - 11/16/2023 12:43:27 PM
Y - Gapped down undercutting its 50 DMA line ($244.62) yet rebounded from the earlier low after testing the prior low ($233.81 on 11/06/23). Reporting Oct '23 quarterly earnings +66% on +20% sales revenues versus the year-ago period. There was a "negative reversal" on the prior session after challenging its 52-week high. Volume and volatility often increase near earnings news.
>>> FEATURED STOCK ARTICLE : Earnings New Due While Perched Near Prior High - 11/13/2023 |
View all notes |
Set NEW NOTE alert |
Company Profile |
SEC
News |
Chart |
Request a new note
C
A
S
I |
|
|
|
THESE ARE NOT BUY RECOMMENDATIONS!
Comments contained in the body of this report are technical
opinions only. The material herein has been obtained
from sources believed to be reliable and accurate, however,
its accuracy and completeness cannot be guaranteed.
This site is not an investment advisor, hence it does
not endorse or recommend any securities or other investments.
Any recommendation contained in this report may not
be suitable for all investors and it is not to be deemed
an offer or solicitation on our part with respect to
the purchase or sale of any securities. All trademarks,
service marks and trade names appearing in this report
are the property of their respective owners, and are
likewise used for identification purposes only.
This report is a service available
only to active Paid Premium Members.
You may opt-out of receiving report notifications
at any time. Questions or comments may be submitted
by writing to Premium Membership Services 665 S.E. 10 Street, Suite 201 Deerfield Beach, FL 33441-5634 or by calling 1-800-965-8307
or 954-785-1121.
|
|
|