You are not logged in.
This means you
CAN ONLY VIEW reports that were published prior to Tuesday, April 15, 2025.
You
MUST UPGRADE YOUR MEMBERSHIP if you want to see any current reports.
AFTER MARKET UPDATE - WEDNESDAY, NOVEMBER 15TH, 2023
Previous After Market Report Next After Market Report >>>
|
|
|
|
DOW |
+163.51 |
34,991.21 |
+0.47% |
|
Volume |
1,003,626,898 |
-6% |
|
Volume |
5,090,853,600 |
-6% |
|
NASDAQ |
+9.45 |
14,103.84 |
+0.07% |
|
Advancers |
1,524 |
54% |
|
Advancers |
2,394 |
56% |
|
S&P 500 |
+7.18 |
4,502.88 |
+0.16% |
|
Decliners |
1,283 |
46% |
|
Decliners |
1,887 |
44% |
|
Russell 2000 |
+2.90 |
1,801.22 |
+0.16% |
|
52 Wk Highs |
90 |
|
|
52 Wk Highs |
137 |
|
|
S&P 600 |
+2.33 |
1,177.05 |
+0.20% |
|
52 Wk Lows |
11 |
|
|
52 Wk Lows |
115 |
|
|
 |
Major Indices Rose Slightly With Lighter Volume Totals
Kenneth J. Gruneisen - Passed the CAN SLIM® Master's Exam
The Dow Jones Industrial Average led as the major indices posted small gains on Wednesday. Volume was lighter than the prior session on the NYSE and on the Nasdaq exchange. Advancers led decliners by almost 5-4 on the NYSE and 4-3 on the Nasdaq exchange. There were 87 high-ranked companies from the Leaders List that hit new 52-week highs and were listed on the BreakOuts Page, versus the total of 86 on the prior session. New 52-week highs outnumbered new 52-week lows on the NYSE and on the Nasdaq exchange. The major indices are in a confirmed uptrend (M criteria). New buying efforts should be only made in stocks fitting all key criteria of the fact-based investment system.
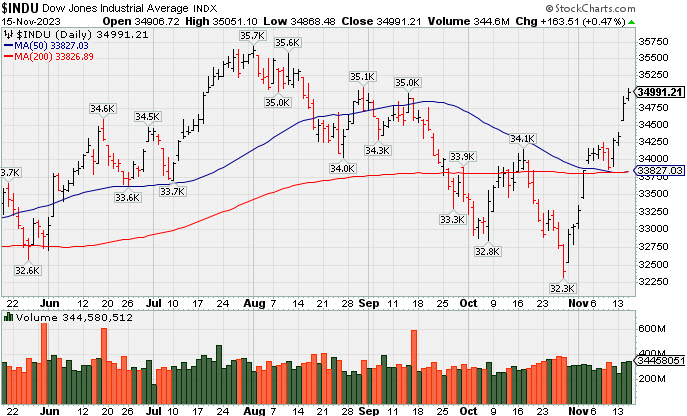
PICTURED: The Dow Jones Industrial Average challenged its August 31st high and closed less than -2% off its 52-week high while posting its 11th gain in the span of 13 sessions. The 2-yr note yield rose nine basis points to 4.91% and the 10-yr note yield also rose nine basis points to 4.54%. Hope that the Fed is done raising rates contributed to the positive bias while the latest economic data seemed consistent with a soft landing scenario for the economy.
Target (TGT +18.01%) gapped up for a considerable volume-driven gain following better-than-expected earnings results. Seven of the 11 S&P 500 sectors rose. Consumer staples (+0.7%), communication services (+0.6%), and financials (+0.6%) led gainers while the energy (-0.3%), utilities (-0.3%), and information technology (-0.1%) sectors fell.
Total retail sales declined 0.1% month-over-month in October and sales, excluding autos, increased just 0.1%. The retail sales data are not adjusted for inflation, so these weak month-over-month changes signify a weakening in demand for goods. The Producer Price Index declined 0.5% month-over-month and was up just 1.3% year-over-year versus 2.1% in September. Excluding food and energy, the index for final demand was unchanged month-over-month and up 2.4% year-over-year versus 2.7% in September.
President Biden and President Xi met at the APEC Summit and gave introductory remarks, but there was no public discussion of policy issues. President Biden will hold a press conference tonight. |
 Kenneth J. Gruneisen started out as a licensed stockbroker in August 1987, a couple of months prior to the historic stock market crash that took the Dow Jones Industrial Average down -22.6% in a single day. He has published daily fact-based fundamental and technical analysis on high-ranked stocks online for two decades. Through FACTBASEDINVESTING.COM, Kenneth provides educational articles, news, market commentary, and other information regarding proven investment systems that work in good times and bad.
Comments contained in the body of this report are technical opinions only and are not necessarily those of Gruneisen Growth Corp. The material herein has been obtained from sources believed to be reliable and accurate, however, its accuracy and completeness cannot be guaranteed. Our firm, employees, and customers may effect transactions, including transactions contrary to any recommendation herein, or have positions in the securities mentioned herein or options with respect thereto. Any recommendation contained in this report may not be suitable for all investors and it is not to be deemed an offer or solicitation on our part with respect to the purchase or sale of any securities. |
|
 |
Financial and Tech Indexes Rose
Kenneth J. Gruneisen - Passed the CAN SLIM® Master's Exam
The Retail Index ($RLX -0.92%) fell while the Bank Index ($BKX +1.43%) and the Broker/Dealer Index ($XBD +0.70%) each posted influential gains. The tech sector had a positive bias as the Semiconductor Index ($SOX +0.72%), Networking Index ($NWX +0.61%), and the Biotech Index ($BTK +0.37%) each posted gains of less than +1%. Commodity-linked groups had a negative bias as the Gold & Silver Index ($XAU -0.49%), Integrated Oil Index ($XOI -0.33%), and the Oil Services Index ($OSX -1.37%) each lost ground.
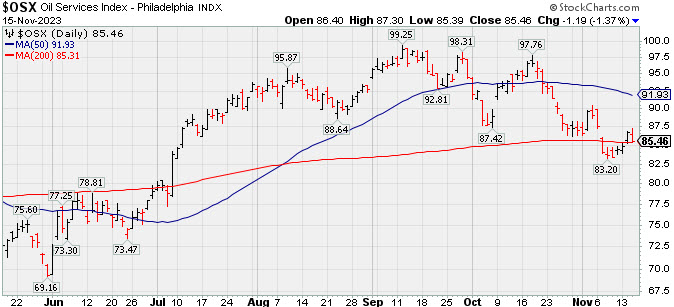
PICTURED: The Oil Services Index ($OSX -1.37%) pulled back today after recently rebounding above its 200-day moving average (DMA) line during a streak of 4 straight gains.
| Oil Services |
$OSX |
85.46 |
-1.19 |
-1.37% |
+1.91% |
| Integrated Oil |
$XOI |
1,848.57 |
-6.03 |
-0.33% |
+3.43% |
| Semiconductor |
$SOX |
3,712.09 |
+26.52 |
+0.72% |
+46.60% |
| Networking |
$NWX |
731.45 |
+4.45 |
+0.61% |
-6.62% |
| Broker/Dealer |
$XBD |
491.42 |
+3.41 |
+0.70% |
+9.42% |
| Retail |
$RLX |
3,632.36 |
-33.87 |
-0.92% |
+31.89% |
| Gold & Silver |
$XAU |
111.58 |
-0.54 |
-0.49% |
-7.68% |
| Bank |
$BKX |
82.61 |
+1.16 |
+1.43% |
-18.09% |
| Biotech |
$BTK |
4,787.36 |
+17.68 |
+0.37% |
-9.35% |
|
|
|
 |
Featured Stocks
Kenneth J. Gruneisen - Passed the CAN SLIM® Master's Exam
|
|
|
Color Codes Explained :
Y - Better candidates highlighted by our
staff of experts.
G - Previously featured
in past reports as yellow but may no longer be buyable under the
guidelines.
***Last / Change / Volume data in this table is the closing quote data***
Symbol/Exchange
Company Name
Industry Group |
PRICE |
CHANGE
(%Change) |
Day High |
Volume
(% DAV)
(% 50 day avg vol) |
52 Wk Hi
% From Hi |
Featured
Date |
Price
Featured |
Pivot Featured |
|
Max Buy |
 ANET
-
NYSE
ANET
-
NYSE
Arista Networks
Computer-Networking
|
$213.74
|
-1.46
-0.68% |
$218.36
|
1,836,635
84.72% of 50 DAV
50 DAV is 2,168,000
|
$216.89
-1.45%
|
10/31/2023
|
$188.84
|
PP = $198.80
|
|
MB = $208.74
|
 Most Recent Note - 11/15/2023 5:16:38 PM
G - There was a "negative reversal" today after quietly hitting another new all-time high. Prior highs in the $198 area define near-term support above its 50 DMA line ($192.78). Fundamentals remain strong.
>>> FEATURED STOCK ARTICLE : Powerful Gain Following Earnings Report for Arista Networks - 10/31/2023 |
View all notes |
Set NEW NOTE alert |
Company Profile |
SEC
News |
Chart |
Request a new note
C
A
S
I |
NVO
-
NYSE
Novo Nordisk ADR
Medical-Ethical Drugs
|
$96.43
|
-2.77
-2.79% |
$98.81
|
7,027,697
141.20% of 50 DAV
50 DAV is 4,977,000
|
$104.00
-7.28%
|
11/2/2023
|
$100.97
|
PP = $104.10
|
|
MB = $109.31
|
Most Recent Note - 11/15/2023 5:32:39 PM
Y - Pulled back today for a 3rd consecutive loss with above-average volume, testing its 50 DMA line ($96.18). It remains perched only -7.3% off its 52-week high. Subsequent gains for new highs backed by at least +40% above average volume are needed to trigger a technical buy signal. More damaging losses would raise concerns.
>>> FEATURED STOCK ARTICLE : Approaching Prior High With Strong Fundamentals - 11/2/2023 |
View all notes |
Set NEW NOTE alert |
Company Profile |
SEC
News |
Chart |
Request a new note
C
A
S
I |
QLYS
-
NASDAQ
Qualys
Computer Sftwr-Security
|
$174.85
|
-1.70
-0.96% |
$177.03
|
318,955
92.18% of 50 DAV
50 DAV is 346,000
|
$177.40
-1.44%
|
11/3/2023
|
$167.50
|
PP = $165.03
|
|
MB = $173.28
|
Most Recent Note - 11/15/2023 5:34:08 PM
G - Pulled back with lighter volume today after 4 consecutive gains to new all-time highs. Prior high ($165) defines initial support to watch on pullbacks.
>>> FEATURED STOCK ARTICLE : Powerful Breakout for Qualys - 11/3/2023 |
View all notes |
Set NEW NOTE alert |
Company Profile |
SEC
News |
Chart |
Request a new note
C
A
S
I |
AXON
-
NASDAQ
Axon Enterprise
Security/Sfty
|
$221.19
|
-0.39
-0.18% |
$225.38
|
530,147
111.85% of 50 DAV
50 DAV is 474,000
|
$231.71
-4.54%
|
11/8/2023
|
$127.84
|
PP = $223.30
|
|
MB = $234.47
|
Most Recent Note - 11/15/2023 5:20:34 PM
Y - Reversed into the red and closed near the session low today after 3 consecutive small gains. Undercut the new pivot point last week following a noted technical breakout. More damaging losses below the recent low ($212.89 on 11/09/23) would raise greater concerns.
>>> FEATURED STOCK ARTICLE : Breakout for Axon as it Returns to Featured Stocks List - 11/8/2023 |
View all notes |
Set NEW NOTE alert |
Company Profile |
SEC
News |
Chart |
Request a new note
C
A
S
I |
TDG
-
NYSE
TransDigm Group
Aerospace/Defense
|
$994.16
|
-2.58
-0.26% |
$998.58
|
318,281
127.31% of 50 DAV
50 DAV is 250,000
|
$1,013.08
-1.87%
|
11/9/2023
|
$982.68
|
PP = $940.10
|
|
MB = $987.11
|
Most Recent Note - 11/15/2023 5:35:43 PM
G - Today's loss broke a streak of 13 consecutive gains. Ended near the session low on the prior session after trading above the $1,000 threshold. Fundamentals remain strong. Prior high ($940) defines initial support to watch on pullbacks.
>>> FEATURED STOCK ARTICLE : TransDigm's Big Gap Up Gain Triggered Technical Buy Signal - 11/9/2023 |
View all notes |
Set NEW NOTE alert |
Company Profile |
SEC
News |
Chart |
Request a new note
C
A
S
I |
Symbol/Exchange
Company Name
Industry Group |
PRICE |
CHANGE
(%Change) |
Day High |
Volume
(% DAV)
(% 50 day avg vol) |
52 Wk Hi
% From Hi |
Featured
Date |
Price
Featured |
Pivot Featured |
|
Max Buy |
PANW
-
NASDAQ
Palo Alto Networks
Computer Sftwr-Security
|
$256.18
|
-4.99
-1.91% |
$264.75
|
7,009,525
236.73% of 50 DAV
50 DAV is 2,961,000
|
$265.90
-3.66%
|
11/13/2023
|
$255.90
|
PP = $266.00
|
|
MB = $279.30
|
Most Recent Note - 11/15/2023 12:58:18 PM
Y - Reversed into the red from an early gain today that challenged its 52-week high following 4 consecutive volume-driven gains. Subsequent gains above the pivot point backed by at least +40% above average volume are needed to trigger a proper technical buy signal. Due to report Oct '23 quarterly results on 11/15/23. Volume and volatility often increase near earnings news.
>>> FEATURED STOCK ARTICLE : Earnings New Due While Perched Near Prior High - 11/13/2023 |
View all notes |
Set NEW NOTE alert |
Company Profile |
SEC
News |
Chart |
Request a new note
C
A
S
I |
|
|
|
THESE ARE NOT BUY RECOMMENDATIONS!
Comments contained in the body of this report are technical
opinions only. The material herein has been obtained
from sources believed to be reliable and accurate, however,
its accuracy and completeness cannot be guaranteed.
This site is not an investment advisor, hence it does
not endorse or recommend any securities or other investments.
Any recommendation contained in this report may not
be suitable for all investors and it is not to be deemed
an offer or solicitation on our part with respect to
the purchase or sale of any securities. All trademarks,
service marks and trade names appearing in this report
are the property of their respective owners, and are
likewise used for identification purposes only.
This report is a service available
only to active Paid Premium Members.
You may opt-out of receiving report notifications
at any time. Questions or comments may be submitted
by writing to Premium Membership Services 665 S.E. 10 Street, Suite 201 Deerfield Beach, FL 33441-5634 or by calling 1-800-965-8307
or 954-785-1121.
|
|
|