Damaging Losses Hurt Companies That Make Recreational Vehicles - Friday, January 26, 2018
Holding Ground in Tight Range Near High - Wednesday, December 27, 2017
Very Extended From Prior Base and Hovering Near Record High - Thursday, December 7, 2017
Encountered Distributional Pressure After Getting Extended From Base - Friday, November 10, 2017
Extended From Prior Base With Volume Totals Cooling - Friday, October 13, 2017
Wedged to New High Then Ended the Session Weak - Monday, September 18, 2017
Slump Below 50-Day Average Hurt Technical Stance - Monday, August 21, 2017
Still Faces Some Resistance Due to Overhead Supply - Thursday, July 20, 2017
Some Overhead Supply Remains After Latest Technical Breakout - Thursday, June 8, 2017
Rose From Support at 50-Day Moving Average Line - Tuesday, January 24, 2017
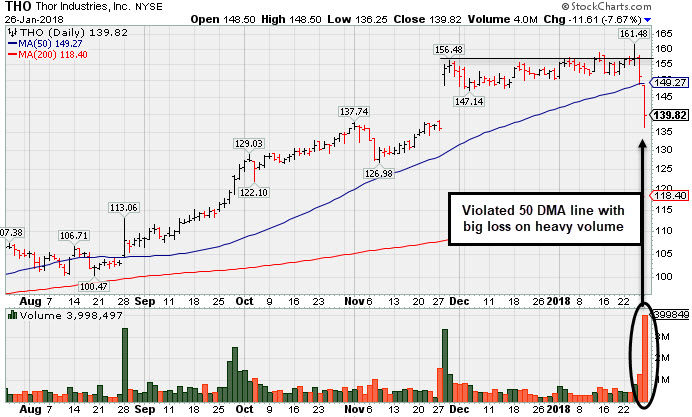
Damaging Losses Hurt Companies That Make Recreational Vehicles - Friday, January 26, 2018
Thor Industries Inc (THO -$11.10 or -7.33% to $140.33) gapped down today violating its 50-day moving average (DMA) line ($149.48) with a 2nd consecutive big loss on even heavier volume. There were big losses from most other companies in the same industry group. The weak action was indicative of distributional pressure and triggered a technical sell signal. Its color code was changed to green. Only a prompt rebound above the 50 DMA line would help its outlook improve.
Fundamentals remain strong. Recently it reported earnings +63% on +31% sales revenues for the Oct '17 quarter, continuing its strong earnings track record. The past 5 quarters were above the +25% minimum earnings guideline (C criteria) of the fact-based investment system. Its annual earnings history (A criteria) has been good. Return on Equity is reported at 26%, well above the 17% minimum guideline.
The Elkhart, IN based Building - Mobile/Mfg & RV firm failed to produce volume-driven gains and trigger a convincing technical buy signal after last shown in this FSU section on 12/27/17 with an annotated graph under the headline, "Holding Ground in Tight Range Near High".
THO has earned a current Timeliness rating of A and a Sponsorship rating of C. The number of top-rated funds owning its shares rose from 489 in Mar '16 to 643 in Dec '17. Its current Up/Down Volume Ratio of 1.0 is an unbiased indication its shares have been neutral concerning accumulation/distribution over the past 50 days (I criteria). Its small supply of only 49.5 million shares (S criteria) in the public float can contribute to greater volatility in the event of institutional buying or selling.
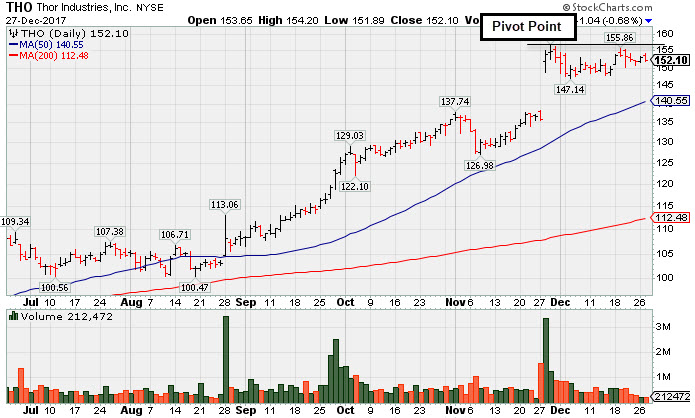
Holding Ground in Tight Range Near High - Wednesday, December 27, 2017
Thor Industries Inc (THO -$1.04 or -0.68% to $152.10) has been holding its ground stubbornly near its all-time high while volume totals have been cooling. Regular readers saw it noted on 12/19/17 after an advanced "3-week tight" base was identified. A new pivot point was cited while its color code was changed to yellow. Subsequent gains above the pivot point backed by at least +40% above average volume may trigger a new (or add-on) technical buys signal.
Its 50-day moving average (DMA) line ($140.90) and prior highs in the $138 area define near-term support to watch. Fundamentals remain strong. Recently it reported earnings +63% on +31% sales revenues for the Oct '17 quarter, continuing its strong earnings track record. The past 5 quarters were above the +25% minimum earnings guideline (C criteria) of the fact-based investment system. Its annual earnings history (A criteria) has been good. Return on Equity is reported at 26%, well above the 17% minimum guideline.
The Elkhart, IN based Building - Mobile/Mfg & RV firm was last shown in this FSU section on 12/07/17 with an annotated graph under the headline, "Very Extended From Prior Base and Hovering Near Record High". It was highlighted in yellow with pivot point cited based on its 4/27/17 high in the 6/07/17 mid-day report (read here). It had gapped up on 6/06/17, clearing a "double bottom" base while rebounding toward prior highs.
THO has earned a current Timeliness rating of A and a Sponsorship rating of B. The number of top-rated funds owning its shares rose from 489 in Mar '16 to 612 in Sep '17. Its current Up/Down Volume Ratio of 1.0 is an unbiased indication its shares have been neutral concerning accumulation/distribution over the past 50 days (I criteria). Its small supply of only 49.5 million shares (S criteria) in the public float can contribute to greater volatility in the event of institutional buying or selling.
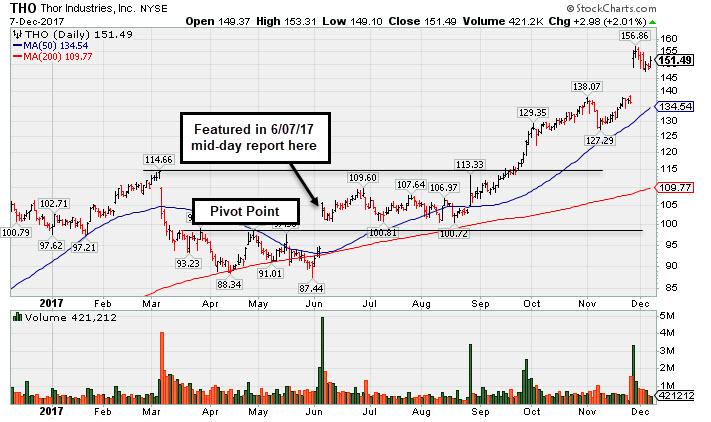
Very Extended From Prior Base and Hovering Near Record High - Thursday, December 7, 2017
Thor Industries Inc (THO +$2.98 or +2.01% to $151.49) remains perched near its all-time high, very extended from any sound base. Its 50-day moving average (DMA) line ($134.54) and recent low ($127.29 on 11/08/17) define near-term support to watch.
Fundamentals remain strong. Recently it reported earnings +63% on +31% sales revenues for the Oct '17 quarter, continuing its strong earnings track record. The past 5 quarters were above the +25% minimum earnings guideline (C criteria) of the fact-based investment system. Its annual earnings history (A criteria) has been good. Return on Equity is reported at 26%, well above the 17% minimum guideline.
THO was last shown in this FSU section on 11/10/17 with an annotated graph under the headline, " Encountered Distributional Pressure After Getting Extended From Base". The Building - Mobile/Mfg & RV firm was highlighted in yellow with pivot point cited based on its 4/27/17 high in the 6/07/17 mid-day report (read here). It had gapped up on 6/06/17, clearing a "double bottom" base while rebounding toward prior highs.
It has earned a current Timeliness rating of A and a Sponsorship rating of B. The number of top-rated funds owning its shares rose from 489 in Mar '16 to 607 in Sep '17. Its current Up/Down Volume Ratio of 1.7 is an unbiased indication its shares have been under accumulation over the past 50 days (I criteria). Its small supply of only 49.5 million shares (S criteria) in the public float can contribute to greater volatility in the event of institutional buying or selling.
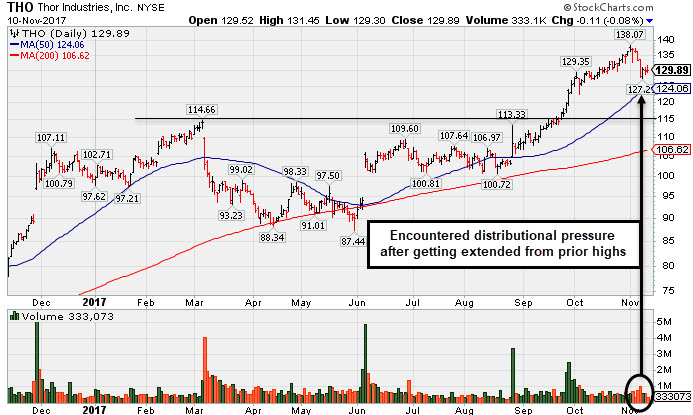
Encountered Distributional Pressure After Getting Extended From Base - Friday, November 10, 2017
Thor Industries Inc (THO -$0.11 or -0.08% to $129.89) encountered some distributional pressure in recent weeks after wedging to new all-time highs with gains lacking great volume conviction. It is still very extended from the previously noted base. Its 50-day moving average (DMA) line ($124.29) defines near-term support above prior highs in the $115 area.
Fundamentals remain strong. It was last shown in this FSU section on 10/13/17 with an annotated graph under the headline, "Extended From Prior Base With Volume Totals Cooling". The Building - Mobile/Mfg & RV firm was highlighted in yellow with pivot point cited based on its 4/27/17 high in the 6/07/17 mid-day report (read here). It had gapped up on 6/06/17, clearing a "double bottom" base while rebounding toward prior highs.
THO reported earnings +44% on +50% sales revenues for the Jul '17 quarter, continuing its strong earnings history. The past 4 quarters were above the +25% minimum earnings guideline (C criteria) of the fact-based investment system. Its annual earnings history (A criteria) has been good. Return on Equity is reported at 26%, well above the 17% minimum guideline.
It has earned a current Timeliness rating of A and a Sponsorship rating of C. The number of top-rated funds owning its shares rose from 489 in Mar '16 to 603 in Sep '17. Its current Up/Down Volume Ratio of 2.4 is an unbiased indication its shares have been under accumulation over the past 50 days (I criteria). Its small supply of only 48.9 million shares (S criteria) in the public float can contribute to greater volatility in the event of institutional buying or selling.
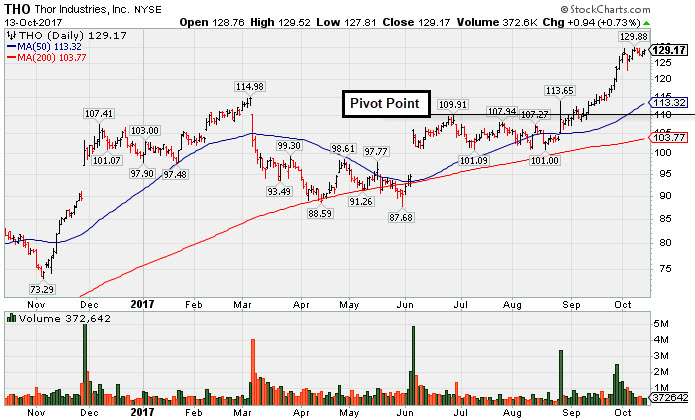
Extended From Prior Base With Volume Totals Cooling - Friday, October 13, 2017
Thor Industries Inc (THO +$0.94 or +0.73% to $129.17) is perched near its 52-week high, stubbornly holding its ground with volume totals cooling after an impressive spurt of volume-driven gains. Prior highs in the $115 area define initial support to watch on pullbacks. Its current Relative Strength Rating of 91, up from 79 when last shown in this FSU section on 9/18/17 with an annotated graph under the headline, "Wedged to New High Then Ended the Session Weak", as it was noted - "No resistance remains due to overhead supply. It is not more than +5% above the pivot point previously cited. Any volume-driven gains into new all-time high territory might signal the beginning of a significant new leg up in price."
The Building - Mobile/Mfg & RV firm was highlighted in yellow with pivot point cited based on its 4/27/17 high in the 6/07/17 mid-day report (read here). It had gapped up on 6/06/17, clearing a "double bottom" base while rebounding toward prior highs.
Fundamentals remain strong. Recently it reported earnings +44% on +50% sales revenues for the Jul '17 quarter, continuing its strong earnings history. The past 4 quarters were above the +25% minimum earnings guideline (C criteria) of the fact-based investment system. Its annual earnings history (A criteria) has been good. Return on Equity is reported at 26%, well above the 17% minimum guideline.
It has earned a current Timeliness rating of A and a Sponsorship rating of B. The number of top-rated funds owning its shares rose from 489 in Mar '16 to 607 in Jun '17. Its current Up/Down Volume Ratio of 3.9 is an unbiased indication its shares have been under accumulation over the past 50 days (I criteria). Its small supply of only 48.9 million shares (S criteria) in the public float can contribute to greater volatility in the event of institutional buying or selling.
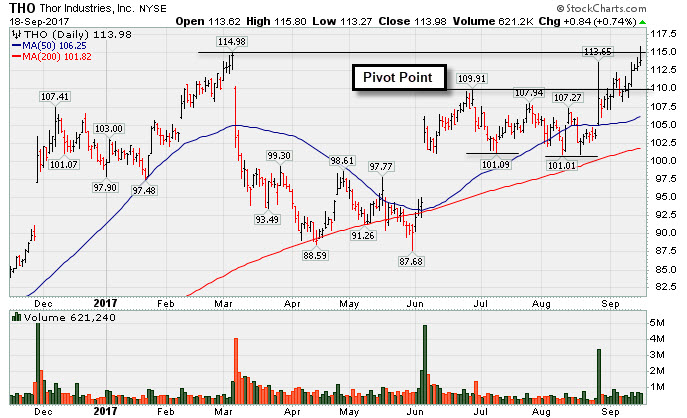
Wedged to New High Then Ended the Session Weak - Monday, September 18, 2017
Thor Industries Inc (THO +$0.84 or +0.74% to $113.98) quietly touched a new high today but then ended in the lower third of its intra-day range. Its current Relative Strength Rating of 79 is just below the 80+ minimum guideline for buy candidates under the fact-based investment system. No resistance remains due to overhead supply. It is not more than +5% above the pivot point previously cited. Any volume-driven gains into new all-time high territory might signal the beginning of a significant new leg up in price.
The Building - Mobile/Mfg & RV firm was highlighted in yellow with pivot point cited based on its 4/27/17 high in the 6/07/17 mid-day report (read here). It had gapped up on 6/06/17, clearing a "double bottom" base while rebounding toward prior highs. It was last shown in this FSU section on 8/21/17 with an annotated graph under the headline, "Slump Below 50-Day Average Hurt Technical Stance".
Recently it reported earnings +40% on +57% sales revenues for the Apr '17 quarter, continuing its strong earnings history. The past 3 quarters were above the +25% minimum earnings guideline (C criteria) of the fact-based investment system. Its annual earnings history (A criteria) has been good. Return on Equity is reported at 23%, well above the 17% minimum guideline.
It has earned a current Timeliness rating of B and a Sponsorship rating of C. The number of top-rated funds owning its shares rose from 489 in Mar '16 to 603 in Jun '17. Its current Up/Down Volume Ratio of 2.5 is an unbiased indication its shares have been under accumulation over the past 50 days (I criteria). Its small supply of only 48.9 million shares (S criteria) in the public float can contribute to greater volatility in the event of institutional buying or selling.
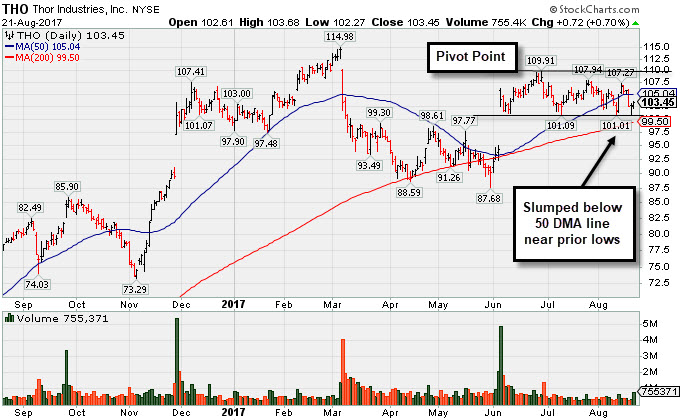
Slump Below 50-Day Average Hurt Technical Stance - Monday, August 21, 2017
Thor Industries Inc (THO +$0.72 or +0.70%to $103.45) has been recently slumping below its 50-day moving average (DMA) line ($105.09) near prior lows. A rebound above the 50 DMA line is needed for its outlook to improve. Subsequent volume-driven gains above the pivot point may trigger a new (or add-on) technical buy signal. Without fresh proof of new institutional buying demand investors should be patient. It faces additional resistance due to overhead supply up through the $115 level. Any volume-driven gains into new all-time high territory might signal the beginning of a significant new leg up in price.
The Building - Mobile/Mfg & RV firm was highlighted in yellow with pivot point cited based on its 4/27/17 high in the 6/07/17 mid-day report (read here). It had gapped up on 6/06/17, clearing a "double bottom" base while rebounding toward prior highs. It was last shown in this FSU section on 7/20/17 with an annotated graph under the headline, "Still Faces Some Resistance Due to Overhead Supply".
Recently it reported earnings +40% on +57% sales revenues for the Apr '17 quarter, continuing its strong earnings history. The past 3 quarters were above the +25% minimum earnings guideline (C criteria) of the fact-based investment system. Its annual earnings history (A criteria) has been good. Return on Equity is reported at 23%, well above the 17% minimum guideline.
It has earned a current Timeliness rating of C and a Sponsorship rating of B. The number of top-rated funds owning its shares rose from 489 in Mar '16 to 590 in Jun '17. Its current Up/Down Volume Ratio of 1.0 is an unbiased indication its shares have been neutral concerning accumulation/distribution over the past 50 days (I criteria). Its small supply of only 48.9 million shares (S criteria) in the public float can contribute to greater volatility in the event of institutional buying or selling.
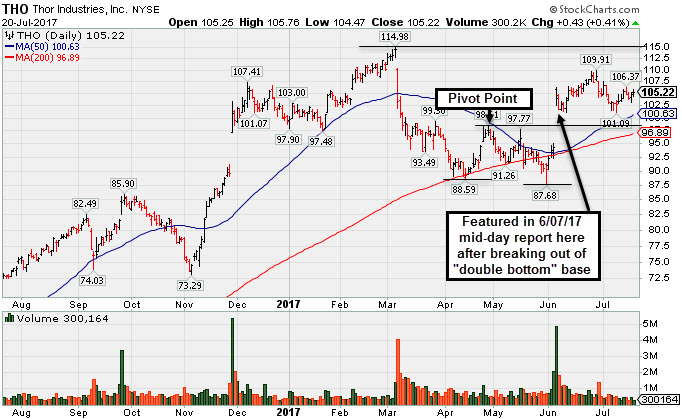
Still Faces Some Resistance Due to Overhead Supply - Thursday, July 20, 2017
Thor Industries Inc (THO +$0.43 or +0.41% to $105.22) has been consolidating above its "max buy" level following its prior technical breakout. It still faces some resistance due to overhead supply up through the $115 level. Subsequent volume-driven gains above the recent high and gains into new all-time high territory might signal the beginning of a meaningful new leg up in price.
THO was highlighted in yellow with pivot point cited based on its 4/27/17 high in the 6/07/17 mid-day report (read here). It had gapped up on 6/06/17, clearing a "double bottom" base while rebounding toward prior highs. It was last shown in this FSU section on 6/08/17 with an annotated graph under the headline, "Some Overhead Supply Remains After Latest Technical Breakout". The Building - Mobile/Mfg & RV firm found support near prior lows after undercutting its 200 DMA line during its consolidation since dropped from the Featured Stocks list on 3/09/17.
Recently it reported earnings +40% on +57% sales revenues for the Apr '17 quarter, continuing its strong earnings history. The past 3 quarters were above the +25% minimum earnings guideline (C criteria) of the fact-based investment system. Its annual earnings history (A criteria) has been good. Return on Equity is reported at 23%, well above the 17% minimum guideline.
It has earned a current Timeliness rating of B and a Sponsorship rating of B. The number of top-rated funds owning its shares rose from 489 in Mar '16 to 590 in Jun '17. Its current Up/Down Volume Ratio of 1.4 is an unbiased indication its shares have been under accumulation over the past 50 days (I criteria). Its small supply of only 48.9 million shares (S criteria) in the public float can contribute to greater volatility in the event of institutional buying or selling.
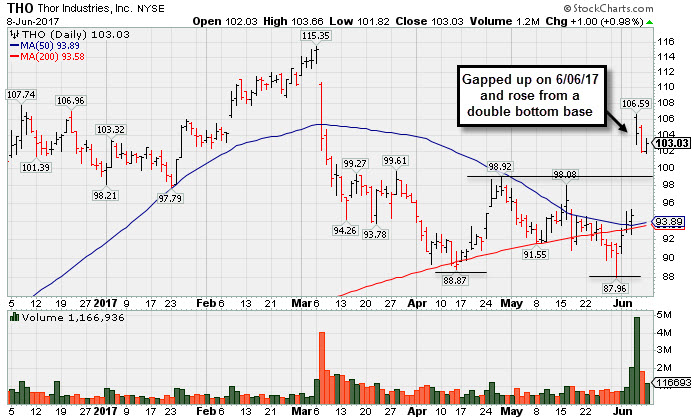
Some Overhead Supply Remains After Latest Technical Breakout - Thursday, June 8, 2017
Thor Industries Inc (THO +$1.00 +0.98% to $103.03) was highlighted in yellow with pivot point cited based on its 4/27/17 high in the 6/07/17 mid-day report (read here). Recently it reported earnings +40% on +57% sales revenues for the Apr '17 quarter, continuing its strong earnings history. It gapped up on 6/06/17, clearing a "double bottom" base while rebounding toward prior highs. It still faces some resistance due to overhead supply up through the $115 level. THO was last shown in this FSU section on 1/24/17 with an annotated graph under the headline, "Rose From Support at 50-Day Moving Average Line". The Building - Mobile/Mfg & RV firm found support near prior lows after undercutting its 200 DMA line during its consolidation since dropped from the Featured Stocks list on 3/09/17. The past 3 quarters were above the +25% minimum earnings guideline (C criteria) of the fact-based investment system. Its annual earnings history (A criteria) has been good. Return on Equity is reported at 23%, well above the 17% guideline.
It has earned a current Timeliness rating of C and a Sponsorship rating of B. The number of top-rated funds owning its shares rose from 489 in Mar '16 to 600 in Mar '17. Its current Up/Down Volume Ratio of 1.3 is an unbiased indication its shares have been under accumulation over the past 50 days (I criteria). Its small supply of only 48.9 million shares (S criteria) in the public float can contribute to greater volatility in the event of institutional buying or selling.
Charts courtesy www.stockcharts.com
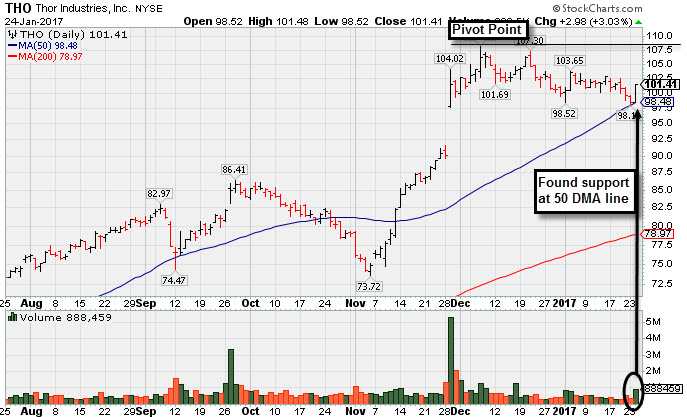
Rose From Support at 50-Day Moving Average Line - Tuesday, January 24, 2017
Thor Industries Inc (THO +$2.98 or +3.03% to $101.41) was highlighted in yellow with new pivot point cited based on its 12/07/16 high plus 10 cents in today's earlier mid-day report (read here). Subsequent volume-driven gains for new highs are needed to trigger a technical buy signal. Volume totals have cooled in recent weeks, and today it rallied from support at its 50-day moving average (DMA) line with a solid gain backed by above average volume. It has been consolidating since gapping up on 11/29/16.
The high-ranked Building - Mobile/Mfg & RV firm reported earnings +54% on +66% sales revenues for the Oct '16 quarter. Three of the past 4 quarters were above the +25% minimum earnings guideline (C criteria) of the fact-based investment system. Its annual earnings history (A criteria) has been good. Return on Equity is reported at 23%, well above the 17% guideline.
It has earned a current Timeliness rating of A and a Sponsorship rating of B. The number of top-rated funds owning its shares rose from 489 in Mar '16 to 554 in Dec '16. Its current Up/Down Volume Ratio of 2.0 is an unbiased indication its shares have been under accumulation over the past 50 days (I criteria). Its small supply of only 48.9 million shares (S criteria) in the public float can contribute to greater volatility in the event of institutional buying or selling.
Charts courtesy www.stockcharts.com