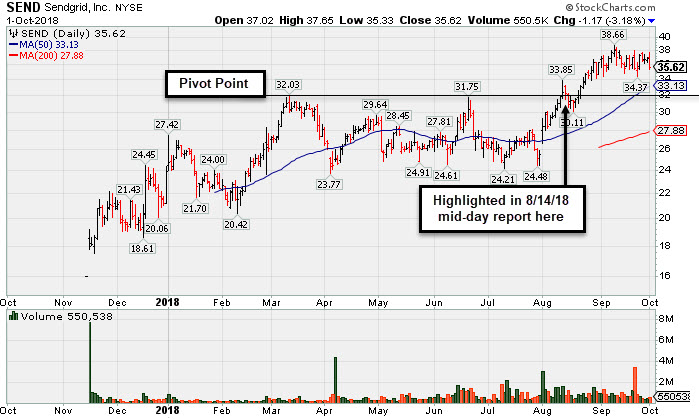
Extended From Prior Base Following Rally - Monday, October 1, 2018
Sendgrid Inc (SEND -$1.17 or -3.18% to $35.62) retreated and ended -7.9% from its all-time high with today's loss. It is extended from any sound base. Its 50-day moving average (DMA) line ($33.13) and prior highs in the $32 area define near-term support to watch.
SEND was highlighted in yellow again in the 8/14/18 mid-day report (read here) with a new pivot point cited based on its 3/12/18 high plus 10 cents. It hit a new 52-week high with a gain and close above the pivot point backed by +80% above average volume triggering a new technical buy signal.
It reported earnings +400% on +32% sales revenues for the quarter ended June 30, 2018 versus the year ago period, continuing its track record of strong sales revenues and earnings increases in quarterly comparisons. It had a profitable FY '17 after years of shrinking losses of 29 cents per share in FY '14, a loss of 11 cents per share in FY '15, and a loss of 3 cents per share in FY '16. Some concerns remain due to its limited annual earnings (A criteria) history since its $16 IPO on 11/15/17. It completed a new Public Offering and Secondary Offering on 4/05/18.
SEND was last shown in this FSU section on 8/14/18 under the headline, "Strength Returned After Finding Support Near Prior Lows". It was first highlighted in yellow with pivot point cited based on its 2/27/18 high in the 3/06/18 mid-day report (readhere).
There are only 46.4 million shares outstanding (S criteria). Top-rated funds owning its shares rose from 105 in Dec '17 to 191 in Jun '18. Its current Up/Down Volume Ratio of 1.4 is an unbiased indication its shares have been under accumulation over the past 50 days. It has a Timeliness rating of A and a Sponsorship rating of A.
Charts used courtesy of www.stockcharts.com
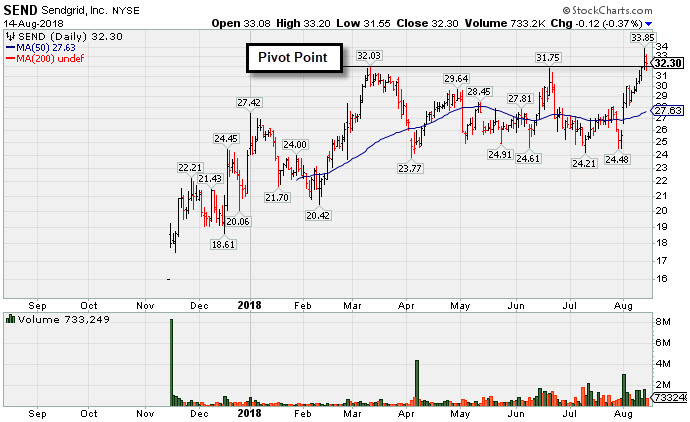
Strength Returned After Finding Support Near Prior Lows - Tuesday, August 14, 2018
Sendgrid Inc (SEND -$0.12 or -0.37% to $32.30) pulled back slightly today with lighter volume. It was highlighted in yellow again in the prior mid-day report (read here) with a new pivot point cited based on its 3/12/18 high plus 10 cents. It hit a new 52-week high with a gain and close above the pivot point backed by +80% above average volume triggering a new technical buy signal. Prior lows in the $24 area define important support. It completed a new Public Offering and Secondary Offering on 4/05/18.
It reported earnings +400% on +32% sales revenues for the quarter ended June 30, 2018 versus the year ago period, continuing its track record of strong sales revenues and earnings increases in quarterly comparisons. It had a profitable FY '17 after years of shrinking losses of 29 cents per share in FY '14, a loss of 11 cents per share in FY '15, and a loss of 3 cents per share in FY '16. Some concerns remain due to its limited annual earnings (A criteria) history since its $16 IPO on 11/15/17.
SEND was last shown in this FSU section on 6/14/18 under the headline, "Volume-Driven Gains Above 50-Day Average Help Outlook Improve", but it subsequently slumped below the 50 DMA line and was dropped from the Featured Stocks list. It found support near the prior lows in the $24 area. It was first highlighted in yellow with pivot point cited based on its 2/27/18 high in the 3/06/18 mid-day report (read here).
There are only 44.3 million shares outstanding (S criteria). In Dec '17 102 top-rated funds reportedly own its shares,and that rose to 178 in Jun '18. Its current Up/Down Volume Ratio of 1.7 is an unbiased indication its shares have been under accumulation over the past 50 days. It has a Timeliness rating of A and a Sponsorship rating of B.
There are only 44.3 million shares outstanding (S criteria). In Dec '17 102 top-rated funds reportedly own its shares,and that rose to 178 in Jun '18. Its current Up/Down Volume Ratio of 1.7 is an unbiased indication its shares have been under accumulation over the past 50 days. It has a Timeliness rating of A and a Sponsorship rating of B.
Charts used courtesy of www.stockcharts.com
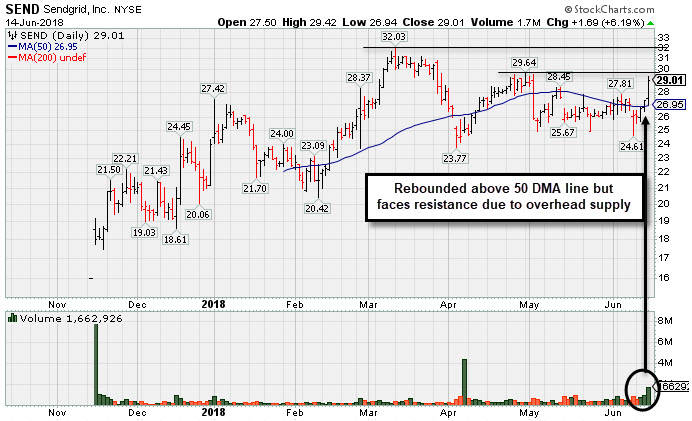
Volume-Driven Gains Above 50-Day Average Help Outlook Improve - Thursday, June 14, 2018
Sendgrid Inc (SEND +1.69 or +6.19% to $29.01) rebounded above its 50-day moving average (DMA) line helping its outlook improve with volume-driven gains this week. It still faces near-term resistance due to overhead supply up to the $32 level. Recent lows in the $23-24 area define important support to watch on pullbacks.
It reported earnings +100% on +31% sales revenues for the quarter ended March 31, 2018 versus the year ago period, continuing its track record of strong sales revenues and earnings increases in quarterly comparisons. It had a profitable FY '17 after years of shrinking losses of 29 cents per share in FY '14, a loss of 11 cents per share in FY '15, and a loss of 3 cents per share in FY '16. Some concerns remain due to its limited annual earnings (A criteria) history since its $16 IPO on 11/15/17.
SEND has shown resilience after it priced a new Public Offering and Secondary Offering on 4/05/18. It was last shown in this FSU section on 5/01/18 under the headline , "Earnings News Continues to be Strong". It was highlighted in yellow with pivot point cited based on its 2/27/18 high in the 3/06/18 mid-day report (read here). There are only 44.3 million shares outstanding (S criteria). In Dec '17 102 top-rated funds reportedly own its shares,and that rose to 139 in Mar '18. Its current Up/Down Volume Ratio of 1.5 is an unbiased indication its shares have been under accumulation over the past 50 days. It has a Timeliness rating of B and a Sponsorship rating of B.
Charts used courtesy of www.stockcharts.com
Earnings News Continues to be Strong - Tuesday, May 1, 2018
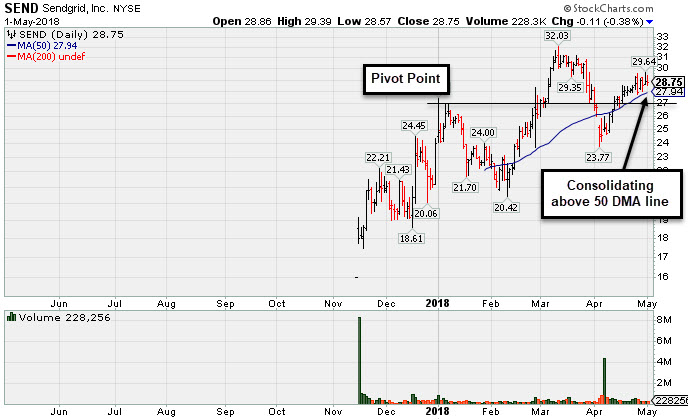
Sendgrid Inc (SEND -$0.11 or -0.38% to $28.75) has been quietly consolidating above its 50-day moving average DMA line ($27.94) with volume totals cooling. After Tuesday's close it reported earnings +100% on +31% sales revenues for the quarter ended March 31, 2018 versus the year ago period. Volume and volatility often increase near earnings news.
The company showed strong sales revenues and earnings increases in quarterly comparisons through Dec '17. It had a profitable FY '17 after years of shrinking losses of 29 cents per share in FY '14, a loss of 11 cents per share in FY '15, and a loss of 3 cents per share in FY '16. Some concerns remain due to its limited annual earnings (A criteria) history since its $16 IPO on 11/15/17.
SEND has shown resilience after it priced a new Public Offering and Secondary Offering on 4/05/18. It slumped back into the prior base, undercutting prior highs in the $27-28 area, raising concerns. Disciplined investors always limit losses by selling any stock that falls more than -7% from their purchase price. Any stock that was previously sold can always be bought back later if strength returns.
It was last shown in this FSU section on 4/03/18 under the headline , "Slumped Into Prior Base Testing 50-Day Average". It was highlighted in yellow with pivot point cited based on its 2/27/18 high in the 3/06/18 mid-day report (read here). There are only 41.4 million shares outstanding (S criteria). In Dec '17 102 top-rated funds reportedly own its shares,and that rose to 111 in Mar '18. Its current Up/Down Volume Ratio of 2.1 is an unbiased indication its shares have been under accumulation over the past 50 days. It has a Timeliness rating of A and a Sponsorship rating of B.
Charts used courtesy of www.stockcharts.com
Slumped Into Prior Base Testing 50-Day Average - Tuesday, April 3, 2018
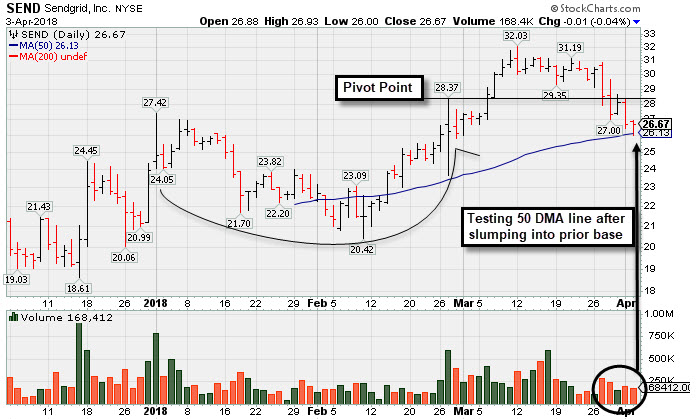
Sendgrid Inc (SEND -$0.01 or -0.04% to $26.67) has slumped back into the prior base, undercutting prior highs in the $27-28 area, raising concerns. Disciplined investors always limit losses by selling any stock that falls more than -7% from their purchase price.
It was last shown in this FSU section on 3/06/18 under the headline , "Recently Profitable Internet - Content Firm Rallied to New High". It was highlighted in yellow with pivot point cited based on its 2/27/18 high in the earlier mid-day report (read here). It hit a new high with a gain backed by +80% above average volume, triggering a technical buy signal while rising from a 9-week cup-with-high-handle pattern.
The company showed strong sales revenues and earnings increases in quarterly comparisons through Dec '17. It had a profitable FY '17 after years of shrinking losses of 29 cents per share in FY '14, a loss of 11 cents per share in FY '15, and a loss of 3 cents per share in FY '16. Some concerns remain due to its limited annual earnings (A criteria) history since its $16 IPO on 11/15/17.
There are only 15.3 million shares in the public float (S criteria) and as of Dec '17 only 100 top-rated funds reportedly own its shares. Its current Up/Down Volume Ratio of 1.4 is an unbiased indication its shares have been under slight accumulation over the past 50 days. It has a Timeliness rating of A and a Sponsorship rating of A.
Charts used courtesy of www.stockcharts.com
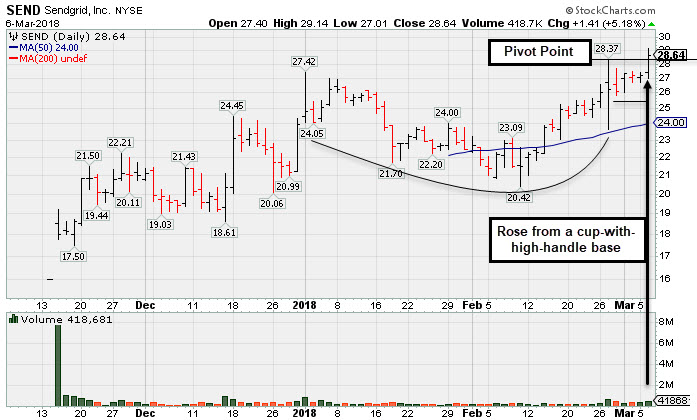
Recently Profitable Internet - Content Firm Rallied to New High - Tuesday, March 6, 2018
Sendgrid Inc (SEND +$1.41 or +5.18% to $28.64) was highlighted in yellow with pivot point cited based on its 2/27/18 high in the earlier mid-day report (read here). It hit a new high with today's gain backed by +80% above average volume, triggering a technical buy signal while rising from a 9-week cup-with-high-handle pattern.
The company showed strong sales revenues and earnings increases in quarterly comparisons through Dec '17. It had a profitable FY '17 after years of shrinking losses of 29 cents per share in FY '14, a loss of 11 cents per share in FY '15, and a loss of 3 cents per share in FY '16. Some concerns remain due to its limited annual earnings (A criteria) history since its $16 IPO on 11/15/17.
There are only 15.4 million shares in the public float (S criteria) and only 94 top-rated funds that reportedly own its shares. Its current Up/Down Volume Ratio of 1.1 is an unbiased indication its shares have been under slight accumulation over the past 50 days. It has a Timeliness rating of A and a Sponsorship rating of A.
Charts used courtesy of www.stockcharts.com