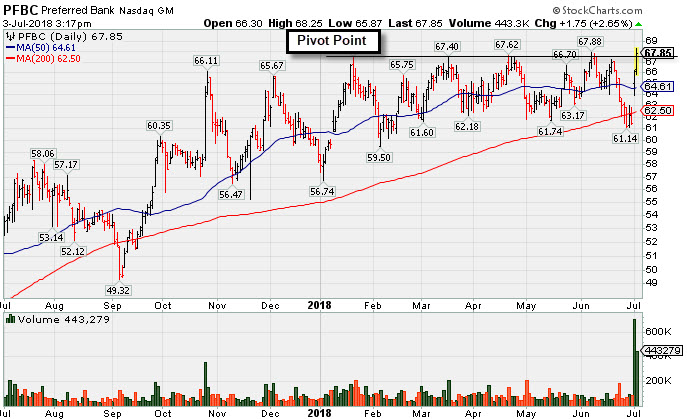
Volume-Driven Gains Hit New All-Time High - Tuesday, July 3, 2018
Preferred Bank Los Angeles (PFBC +$1.75 or +2.65% to $67.85) hit a new all-time high with today's 2nd consecutive big volume-driven gain triggering a technical buy signal. Its color code was changed to yellow after gapping up and rebounding above its 50-day moving average (DMA) line ($64.61) helping its outlook improve. The recent low ($61.14) defines near-term support where more damaging losses would raise serious concerns. Relative Strength Rating has improved to 72, but remains below the 80+ minimum guideline for buy candidates.
It was highlighted again in yellow with a new pivot point cited based on its 1/22/18 high plus 10 cents. Currently it has a Timeliness rating of C and a Sponsorship rating of B. Both of those ratings are down from when it was last shown in this FSU section on 5/18/18 with an annotated graph under the headline "Some Technical Sputtering Yet Bank is Still Only -7% Off High".
Fundamentals through Mar '18 have remained strong. It reported earnings +35% on +23% sales revenues for the Mar '18 quarter, its 6th consecutive quarterly comparison above the +25% minimum guideline (C criteria).Its annual earnings (A criteria) history has been strong after a downturn in FY '12.
The number of top-rated funds owning its shares rose from 262 in Dec '16 to 303 in Mar '18, a reassuring sign concerning the I criteria. Its current Up/Down Volume Ratio of 1.2 is an unbiased indication its shares have been under accumulation over the past 50 days. Its small supply of 14.9 million shares outstanding (S criteria) can contribute to greater price volatility in the event of institutional buying or selling.
Chart courtesy of www.stockcharts.com
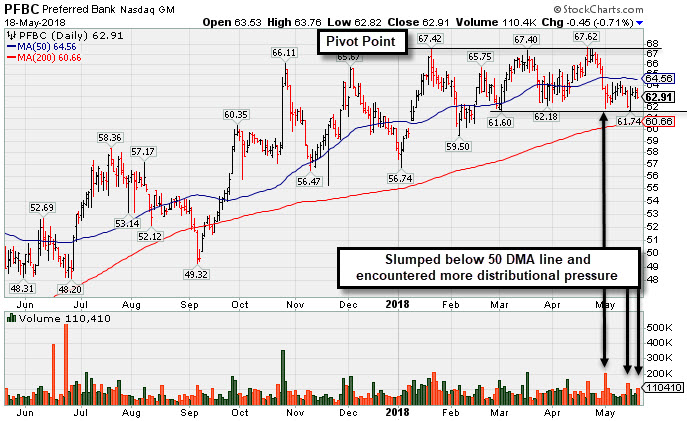
Some Technical Sputtering Yet Bank is Still Only -7% Off High - Friday, May 18, 2018
Preferred Bank Los Angeles (PFBC -$0.45 or -0.71% to $62.91) is highlighted again in yellow with a new pivot point cited based on its 1/22/18 high plus 10 cents. First, it needs to rebound above its 50-day moving average (DMA) line ($64.64) for its outlook to improve. Subsequent volume-driven gains for new highs may trigger a technical buy signal.
Currently it has a Timeliness rating of B and a Sponsorship rating of C. Both of those ratings are down from when it was last shown in this FSU section on 4/10/18 with an annotated graph under the headline "Bank Stock Hovering Within Striking Distance of Prior High". Its Relative Strength Rating also has slumped to 66, below the 80+ minimum guideline for buy candidates. However, despite all of the above noted concerns, it remains perched only -7% off its all time high. Damaging losses below the recent lows and below its 200 DMA line would raise serious concerns and trigger a technical sell signal.
Fundamentals through Mar '18 have remained strong. It reported earnings +35% on +23% sales revenues for the Mar '18 quarter, its 6th consecutive quarterly comparison above the +25% minimum guideline (C criteria).Its annual earnings (A criteria) history has been strong after a downturn in FY '12.
The number of top-rated funds owning its shares rose from 262 in Dec '16 to 300 in Mar '18, a reassuring sign concerning the I criteria. Its current Up/Down Volume Ratio of 0.9 is an unbiased indication its shares have been under distributional pressure over the past 50 days.
Chart courtesy of www.stockcharts.com
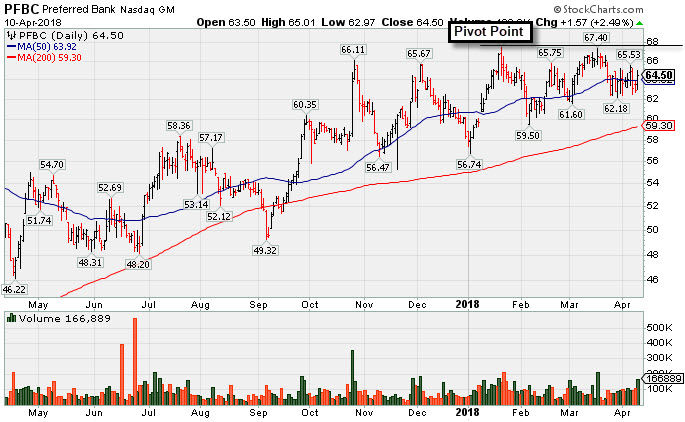
Bank Stock Hovering Within Striking Distance of Prior High - Tuesday, April 10, 2018
Preferred Bank Los Angeles (PFBC +$1.57 or +2.49% to $64.50) was highlighted yellow with pivot point cited based on its 1/22/18 high plus 10 cents in the earlier mid-day report (read here). Subsequent volume-driven gains for new highs may trigger a technical buy signal.
It has been consolidating near its 50-day moving average (DMA) line ($64.12). It made gradual progress since dropped from the Featured Stocks list on 1/03/18. It was last shown in this FSU section on 12/28/17 with an annotated graph under the headline "Concerns Raised by Relative Strength and 50 DMA Line Breach".
Fundamentals through Dec '17 have remained strong. It reported earnings +33% on +23% sales revenues for the Dec '17 quarter, its 5th consecutive quarterly comparison above the +25% minimum guideline (C criteria). Its annual earnings (A criteria) history has been strong after a downturn in FY '12. PFBC was first highlighted in yellow with pivot point cited based on its 7/20/17 high plus 10 cents in the 10/10/17 mid-day report (read here).
It currently has a Timeliness rating of A and a Sponsorship rating of B. The number of top-rated funds owning its shares rose from 262 in Dec '16 to 299 in Dec '17, a reassuring sign concerning the I criteria. Its current Up/Down Volume Ratio of 1.5 is an unbiased indication its shares have been under accumulation over the past 50 days.
Chart courtesy of www.stockcharts.com
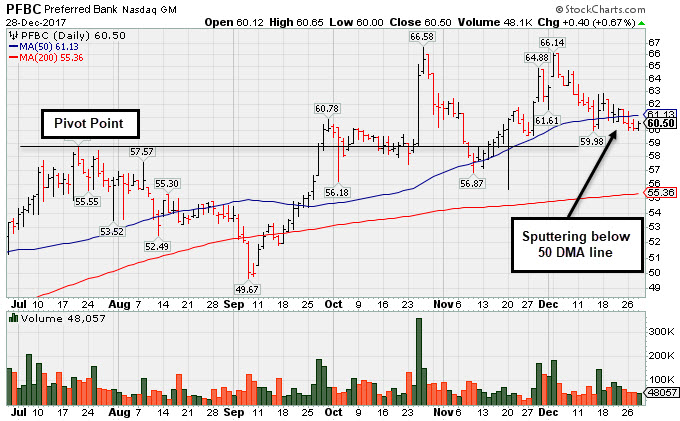
Concerns Raised by Relative Strength and 50 DMA Line Breach - Thursday, December 28, 2017
Preferred Bank Los Angeles (PFBC +$0.40 or +0.67% to $60.50) is quietly sputtering below its 50-day moving average (DMA) line ($61.12). Its Relative Strength rank is currently 64, below the 80+ minimum guideline for buy candidates. A rebound above its 50 DMA line is needed for its outlook to improve. Prior lows and its 200 DMA line define the next important chart support in the $55 area.
Recently it reported earnings +36% on +33% sales revenues for the Sep '17 quarter, its 4th consecutive quarterly comparison above the +25% minimum guideline (C criteria). Its annual earnings (A criteria) history has been strong after a downturn in FY '12.
PFBC was first highlighted in yellow with pivot point cited based on its 7/20/17 high plus 10 cents in the 10/10/17 mid-day report (read here). It was last shown in this FSU section on 12/05/17 with an annotated graph under the headline "Challenged High After Finding Support at 50 Day Moving Average".
It currently has a Timeliness rating of B and a Sponsorship rating of B. The number of top-rated funds owning its shares rose from 262 in Dec '16 to 300 in Sep '17, a reassuring sign concerning the I criteria. Its current Up/Down Volume Ratio of 1.3 is an unbiased indication its shares have been under accumulation over the past 50 days.
Chart courtesy of www.stockcharts.com
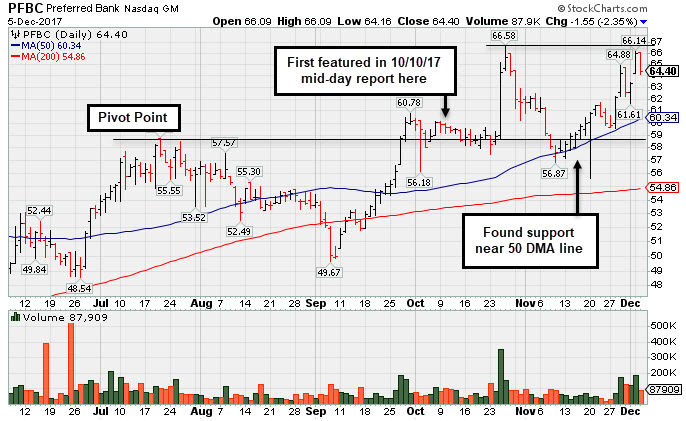
Challenged High After Finding Support at 50 Day Moving Average - Tuesday, December 5, 2017
Preferred Bank Los Angeles (PFBC -$1.55 or -2.35% to $64.40) pulled back today. It challenged its prior high with a gap up gain on the prior session. It found prompt support at its 50-day moving average (DMA) line ($60.37) during its recent consolidation.
Its Relative Strength rank is currently 88, above the 80+ minimum guideline for buy candidates. Recently it reported earnings +36% on +33% sales revenues for the Sep '17 quarter, its 4th consecutive quarterly comparison above the +25% minimum guideline (C criteria). Its annual earnings (A criteria) history has been strong after a downturn in FY '12.
PFBC was first highlighted in yellow with pivot point cited based on its 7/20/17 high plus 10 cents in the 10/10/17 mid-day report (read here). It hit new 52-week highs with considerable volume-driven gains on 9/27 and 9/28. It was last shown in this FSU section on 11/08/17 with an annotated graph under the headline "Slump Back Into Prior Base Raised Concerns".
It currently has a Timeliness rating of A and a Sponsorship rating of B. The number of top-rated funds owning its shares rose from 262 in Dec '16 to 301 in Sep '17, a reassuring sign concerning the I criteria. Its current Up/Down Volume Ratio of 1.7 is an unbiased indication its shares have been under accumulation over the past 50 days.
Chart courtesy of www.stockcharts.com
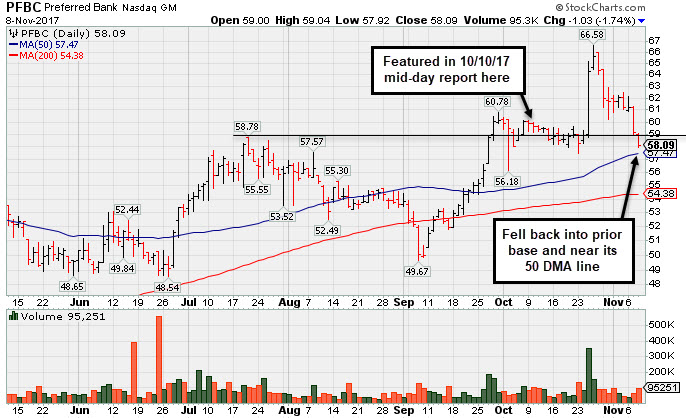
Slump Back Into Prior Base Raised Concerns - Wednesday, November 8, 2017
Preferred Bank Los Angeles (PFBC -$1.03 or -1.74% to $58.09) has slumped below prior highs in the $60 area, falling back into the prior base and raising concerns. Its Relative Strength rank also has slumped to 78, below the 80+ minimum guideline for buy candidates. Its 50-day moving average (DMA) line ($57.56) defines the next important support level where further deterioration would raise greater concerns.
Recently it reported earnings +36% on +33% sales revenues for the Sep '17 quarter, its 4th consecutive quarterly comparison above the +25% minimum guideline (C criteria). Its annual earnings (A criteria) history has been strong after a downturn in FY '12.
PFBC stalled after triggering a technical buy signal on 10/25/17 but quickly getting extended. It was highlighted in yellow with pivot point cited based on its 7/20/17 high plus 10 cents in the prior mid-day report (read here). It hit new 52-week highs with considerable volume-driven gains on 9/27 and 9/28. It was last shown in this FSU section on 10/11/17 with an annotated graph under the headline "Perched Near High Following Volume-Driven Breakout Gains".
It currently has a Timeliness rating of A and a Sponsorship rating of B. The number of top-rated funds owning its shares rose from 262 in Dec '16 to 297 in Sep '17, a reassuring sign concerning the I criteria. a
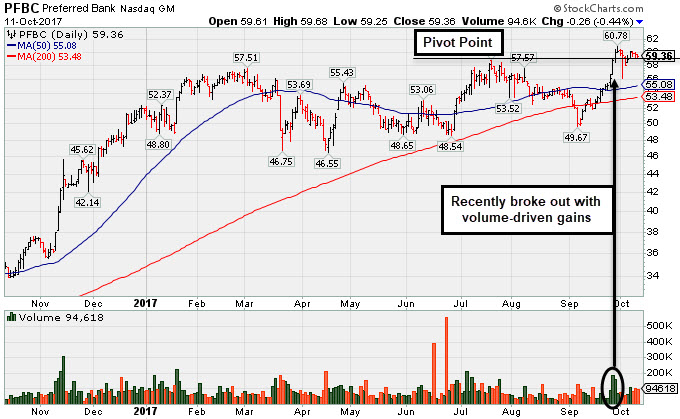
Perched Near High Following Volume-Driven Breakout Gains - Wednesday, October 11, 2017
Preferred Bank Los Angeles (PFBC -$0.26 or -0.44% to $59.36) was highlighted in yellow with pivot point cited based on its 7/20/17 high plus 10 cents in the prior mid-day report (read here). It rebounded above its 50-day moving average (DMA) line and hit new 52-week highs, triggering a technical buy signal with considerable volume-driven gains on 9/27 and 9/28. Now it faces no resistance due to overhead supply.
Recently it reported earnings +31% on +26% sales revenues for the Jun '17 quarter, its 3rd consecutive quarterly comparison above the +25% minimum guideline (C criteria). Its annual earnings (A criteria) history has been strong after a downturn in FY '12.
It currently has a Timeliness rating of A and a Sponsorship rating of B. The number of top-rated funds owning its shares rose from 262 in Dec '16 to 293 in Sep '17, a reassuring sign concerning the I criteria.