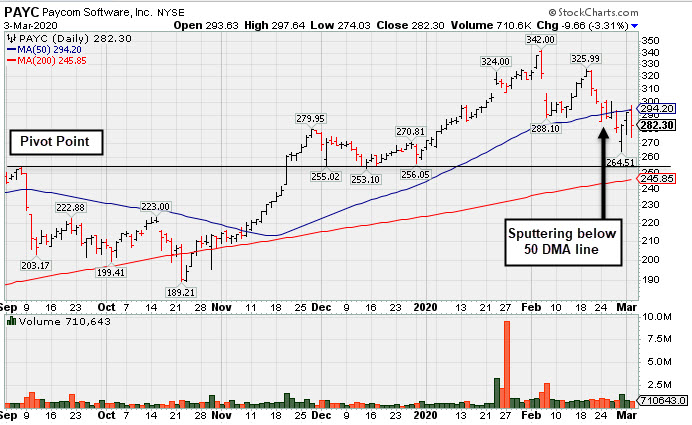
Sputtering Below 50-Day Moving Average - Tuesday, March 3, 2020
Paycom Software Inc (PAYC -$9.66 or -3.31% to $282.30) rebounded near its 50-day moving average (DMA) line ($294) which acted as resistance today. It found prompt support after undercutting the prior high ($279.95 on 11/27/19). Additional gains above the 50 DMA line still are needed for its outlook to improve.
PAYC finished strong after highlighted in yellow with new pivot point cited based on its 8/29/19 high plus 10 cents in the 11/20/19 mid-day report (read here). It was last shown in this FSU section on 2/11/20 under the headline, "Pulled Back Near 50-Day Average Following Strong Earnings Report".
Fundamentals remain strong after it reported earnings +41% on +29% for the Dec '19 quarter. It has the highest possible Earnings Per Share Rating of 99, well above the 80+ minimum guideline for buy candidates. The 4 latest quarterly comparisons were above the +25% minimum earnings guideline (C criteria). Its annual earnings (A criteria) history has been strong and steady.
The Computer Software - Enterprise firm's current Up/Down Volume Ratio of 1.0 is an unbiased indication its shares have been neutral concefrning accumulation/distribution over the past 50 days. Its small supply of only 58.4 million shares outstanding (S criteria) can contribute to greater price volatility in the event of institutional buying or selling. The number of top-rated funds owning its shares rose from 384 in Jun '17 to 923 in Dec '19, a reassuring sign concerning the I criteria. It has a Timeliness rating of A and Sponsorship rating of B. It completed Secondary Offerings on 11/13/15, 9/16/15, 5/15/15 and 1/14/15 since its $15 IPO on 4/15/14.
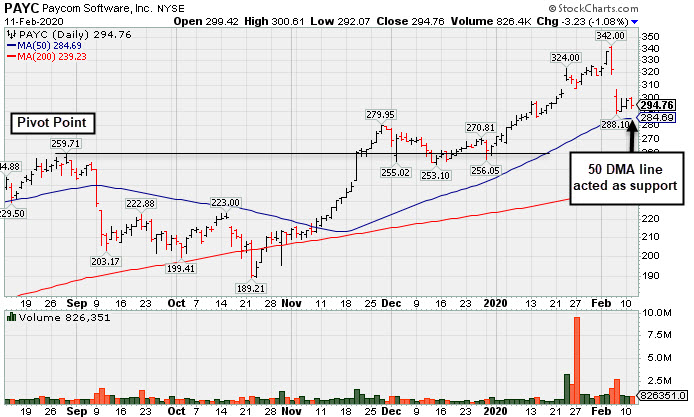
Pulled Back Near 50-Day Average Following Strong Earnings Report - Tuesday, February 11, 2020
Paycom Software Inc (PAYC -$3.23 or -1.08% to $294.76) halted its slide after a "negative reversal" at its all-time high followed by a gap down. Fundamentals remain strong after its latest earnings report. Earnings rose +41% on +29% for the Dec '19 quarter versus the year ago period. It is very extended from any sound base. Its 50-day moving average (DMA) line ($284.69) and prior high ($279.95 on 11/27/19) define important near-term support levels to watch on pullbacks.
PAYC finished strong after highlighted in yellow with new pivot point cited based on its 8/29/19 high plus 10 cents in the 11/20/19 mid-day report (read here). The gain for a new high was backed by +167% above average volume and triggered a new technical buy signal. It was last shown in this FSU section on 1/23/20 under the headline, "Gapped Up for New High But Ended Near Session Low".
It has the highest possible Earnings Per Share Rating of 99, well above the 80+ minimum guideline for buy candidates. The 4 latest quarterly comparisons were above the +25% minimum earnings guideline (C criteria). Its annual earnings (A criteria) history has been strong and steady.
The Computer Software - Enterprise firm's current Up/Down Volume Ratio of 0.9 is an unbiased indication its shares have been under some distributional pressure over the past 50 days. Its small supply of only 58.4 million shares outstanding (S criteria) can contribute to greater price volatility in the event of institutional buying or selling. The number of top-rated funds owning its shares rose from 384 in Jun '17 to 931 in Dec '19, a reassuring sign concerning the I criteria. It has a Timeliness rating of A and Sponsorship rating of B. It completed Secondary Offerings on 11/13/15, 9/16/15, 5/15/15 and 1/14/15 since its $15 IPO on 4/15/14.
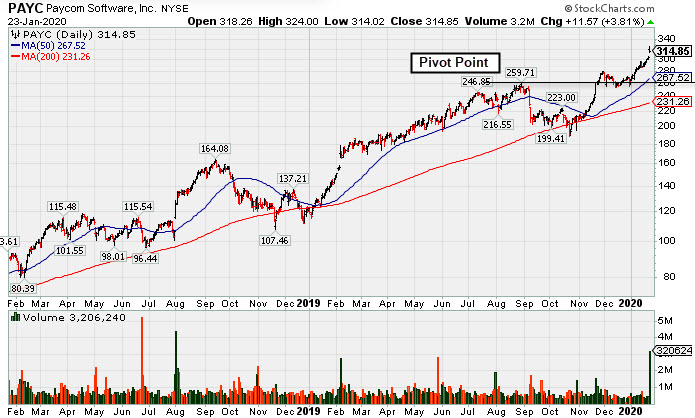
Gapped Up for New High But Ended Near Session Low - Thursday, January 23, 2020
Paycom Software Inc (PAYC +$11.57 or +3.81% to $314.85) gapped up today hitting a new all-time high but finished bear the session low. It is very extended from any sound base with above average volume behind its 6th consecutive gain. Its prior high ($279.95 on 11/27/19) and its 50-day moving average (DMA) line ($267.52) define important near-term support levels to watch. Fundamentals remain strong.
PAYC finished strong after highlighted in yellow with new pivot point cited based on its 8/29/19 high plus 10 cents in the 11/20/19 mid-day report (read here). The gain for a new high was backed by +167% above average volume and triggered a new technical buy signal. It was last shown in this FSU section on 1/03/20 under the headline "Perched Near High and Near the Max Buy Level".
It has an Earnings Per Share Rating of 98, well above the 80+ minimum guidelin efor buy candidates. It reported earnings +35% on +31% sales revenues for the Sep '19 quarter, well above the +25% minimum guideline (C criteria). Its annual earnings (A criteria) history has been strong and steady.
The Computer Software - Enterprise firm's current Up/Down Volume Ratio of 3.9 is an unbiased indication its shares have been under accumulation over the past 50 days. Its small supply of only 58.4 million shares outstanding (S criteria) can contribute to greater price volatility in the event of institutional buying or selling. The number of top-rated funds owning its shares rose from 384 in Jun '17 to 916 in Sep '19, a reassuring sign concerning the I criteria. It has a Timeliness rating of A and Sponsorship rating of B. It completed Secondary Offerings on 11/13/15, 9/16/15, 5/15/15 and 1/14/15 since its $15 IPO on 4/15/14.
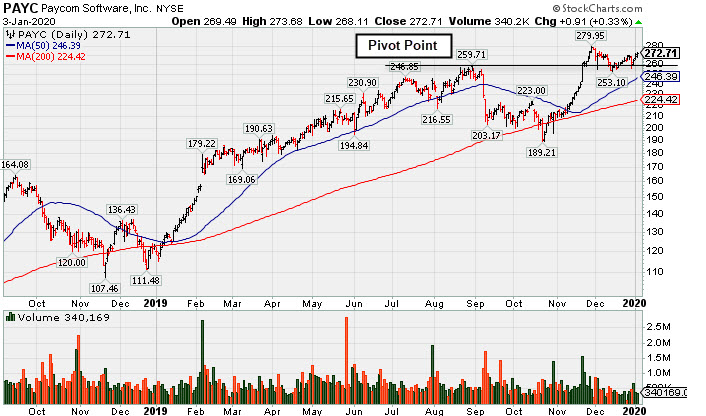
Perched Near High and Near the Max Buy Level - Friday, January 3, 2020
Paycom Software Inc (PAYC -$3.43 or -1.29% to $262.07) is still trading just below its "max buy" level. The recent low ($253.10 on 12/13/19) defines initial support to watch above its 50-day moving average (DMA) line ($246.40).
PAYC finished strong after highlighted in yellow with new pivot point cited based on its 8/29/19 high plus 10 cents in the 11/20/19 mid-day report (read here). The gain for a new high was backed by +167% above average volume and triggered a new technical buy signal. It was last shown in this FSU section on 12/11/19 under the headline "Consolidating Near Prior Highs Which Define Initial Support". Fundamentals have been strong. It reported earnings +35% on +31% sales revenues for the Sep '19 quarter.
The Computer Software - Enterprise firm's current Up/Down Volume Ratio of 2.7 is an unbiased indication its shares have been under accumulation over the past 50 days. Its small supply of only 58.4 million shares outstanding (S criteria) can contribute to greater price volatility in the event of institutional buying or selling. The number of top-rated funds owning its shares rose from 384 in Jun '17 to 879 in Sep '19, a reassuring sign concerning the I criteria. It has a Timeliness rating of A and Sponsorship rating of B. It completed Secondary Offerings on 11/13/15, 9/16/15, 5/15/15 and 1/14/15 since its $15 IPO on 4/15/14.
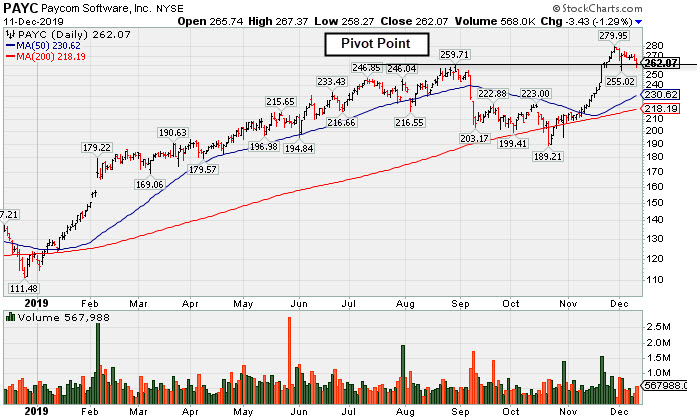
Consolidating Near Prior Highs Which Define Initial Support - Wednesday, December 11, 2019
Paycom Software Inc (PAYC -$3.43 or -1.29% to $262.07) is consolidating above its pivot point and below its "max buy" level. The prior high ($259) defines initial support to watch on pullbacks.
PAYC finished strong after highlighted in yellow with new pivot point cited based on its 8/29/19 high plus 10 cents in the 11/20/19 mid-day report (read here). The gain for a new high was backed by +167% above average volume and triggered a new technical buy signal. It was last shown in this FSU section on 11/20/19 under the headline "Powerful Gain for New High Backed by Heavy Volume". Fundamentals have been strong. It reported earnings +35% on +31% sales revenues for the Sep '19 quarter.
The Computer Software - Enterprise firm's current Up/Down Volume Ratio of 2.3 is an unbiased indication its shares have been under accumulation over the past 50 days. Its small supply of only 58.4 million shares outstanding (S criteria) can contribute to greater price volatility in the event of institutional buying or selling. The number of top-rated funds owning its shares rose from 384 in Jun '17 to 877 in Sep '19, a reassuring sign concerning the I criteria. It has a Timeliness rating of A and Sponsorship rating of B. It completed Secondary Offerings on 11/13/15, 9/16/15, 5/15/15 and 1/14/15 since its $15 IPO on 4/15/14.
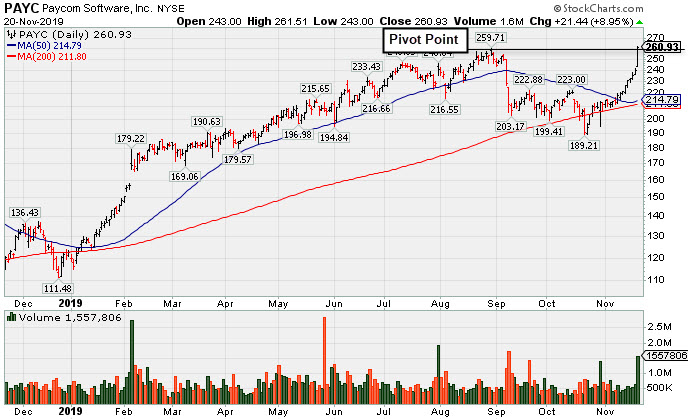
Powerful Gain for New High Backed by Heavy Volume - Wednesday, November 20, 2019
Paycom Software Inc (PAYC +$21.44 or +8.95% to $260.93) finished strong after highlighted in yellow with new pivot point cited based on its 8/29/19 high plus 10 cents in the earlier mid-day report (read here). The gain for a new high was backed by +167% above average volume and triggered a new technical buy signal. It powered to a new 52-week high with today's 10th consecutive gain.
The Computer Software - Enterprise firm went through a deep consolidation and rebounded since last shown in this FSU section on 8/26/19 under the headline "Recently Wedged Higher Without Great Volume Conviction". PAYC found support after undercutting its 200 DMA line since dropped from the Featured Stocks list when last noted on 9/12/19. Meanwhile, fundamentals remained strong. It reported earnings +35% on +31% sales revenues for the Sep '19 quarter.
The current Up/Down Volume Ratio of 1.8 is an unbiased indication its shares have been under accumulation over the past 50 days. Its small supply of only 58.4 million shares outstanding (S criteria) can contribute to greater price volatility in the event of institutional buying or selling. The number of top-rated funds owning its shares rose from 384 in Jun '17 to 862 in Sep '19, a reassuring sign concerning the I criteria. It has a Timeliness rating of B and Sponsorship rating of B. It completed Secondary Offerings on 11/13/15, 9/16/15, 5/15/15 and 1/14/15 since its $15 IPO on 4/15/14.
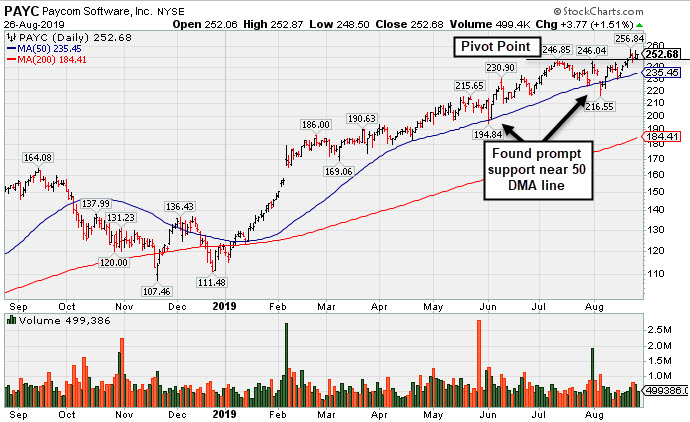
Recently Wedged Higher Without Great Volume Conviction - Monday, August 26, 2019
Paycom Software Inc (PAYC $252.68 +$3.77 +1.51%) has recently wedged above the new pivot point cited based on its 7/11/19 high plus 10 cents. It quietly hit a new all-time high gains lacking great volume conviction. Gains above a stock's pivot must have at least +40% above average volume to trigger a proper new (or add-on) technical buy signal. Its 50-day moving average (DMA) line ($235) defines support above the recent low ($216.55 on 8/05/19). It found support near its 50 DMA line during consolidations throughout this year's ongoing ascent.
The Computer Software - Enterprise firm was last shown in this FSU section on 8/02/19 under the headline "Found Support and Gapped Up Following Earnings Report" It was highlighted in yellow with new pivot point cited based on its 9/14/18 high plus 10 cents in the 2/06/19 mid-day report (read here). A "breakaway gap" cleared all overhead supply and triggered a technical buy signal.
The current Up/Down Volume Ratio of 1.3 is an unbiased indication its shares have been under accumulation over the past 50 days. Its small supply of only 58.4 million shares outstanding (S criteria) can contribute to greater price volatility in the event of institutional buying or selling. The number of top-rated funds owning its shares rose from 384 in Jun '17 to 718 in Jun '19, a reassuring sign concerning the I criteria. It has a Timeliness rating of A and Sponsorship rating of B. It completed Secondary Offerings on 11/13/15, 9/16/15, 5/15/15 and 1/14/15 since its $15 IPO on 4/15/14.
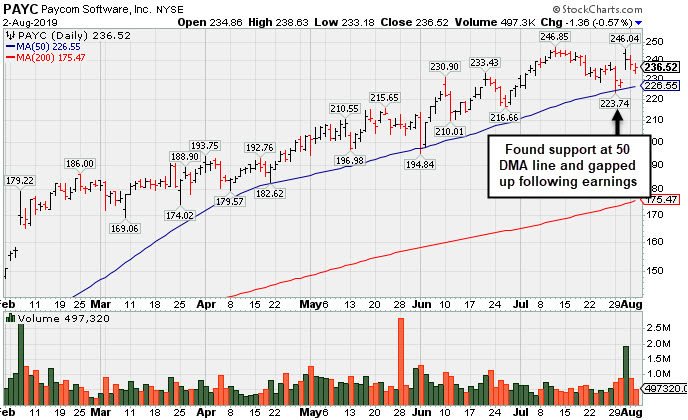
Found Support and Gapped Up Following Earnings Report - Friday, August 2, 2019
Paycom Software Inc (PAYC -$1.36 or -0.57% to $236.52) reported earnings +27% on +31% sales revenues for the Jun '19 quarter, continuing its strong earnings track record. It gapped up on 7/31/19 challenging its all-time high, however it is extended from any sound base. It found support at its 50-day moving average (DMA) line during consolidations throughout this year's ongoing ascent.
The Computer Software - Enterprise firm was last shown in this FSU section on 6/28/19 under the headline, Perched Near High Extended From Any Sound Base". It was highlighted in yellow with new pivot point cited based on its 9/14/18 high plus 10 cents in the 2/06/19 mid-day report (read here). A "breakaway gap" cleared all overhead supply and triggered a technical buy signal.
The current Up/Down Volume Ratio of 1.0 is an unbiased indication its shares have been neutral concerning accumulation/distribution over the past 50 days. Its small supply of only 58.5 million shares outstanding (S criteria) can contribute to greater price volatility in the event of institutional buying or selling. The number of top-rated funds owning its shares rose from 384 in Jun '17 to 673 in Jun '19, a reassuring sign concerning the I criteria. It has a Timeliness rating of B and Sponsorship rating of B. It completed Secondary Offerings on 11/13/15, 9/16/15, 5/15/15 and 1/14/15 since its $15 IPO on 4/15/14.
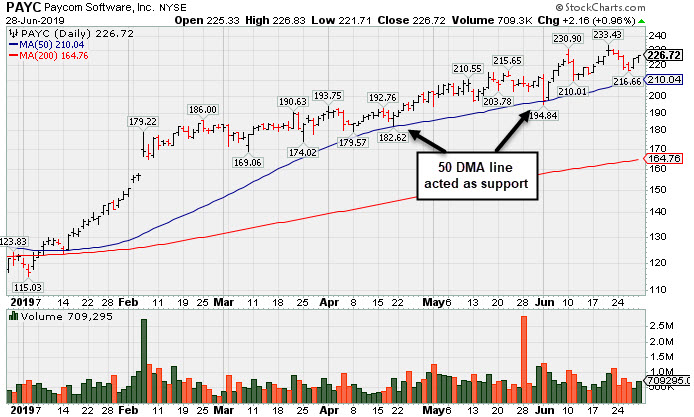
Perched Near High Extended From Any Sound Base - Friday, June 28, 2019
Paycom Software Inc (PAYC +$2.16 or +0.96% to $226.72) is extended from any sound base and recently encountered distributional pressure after quietly hitting a new all-time high. Its 50-day moving average (DMA) line ($210) defines near-term support to watch above the recent low ($194.84 on 6/03/19). That important short-term average acted as support during its ongoing ascent.
It reported earnings +25% on +30% sales revenues for the Mar '19 quarter, right at the +25% minimum earnings guideline (C criteria). Prior comparisons established its strong earnings track record. It has earned a 96 Earnings Per Share Rating.
The high-ranked Computer Software - Enterprise firm was last shown in this FSU section on 5/31/19 under the headline, "Posted Volume-Driven Gain While Hovering Near All-Time High". It was highlighted in yellow with new pivot point cited based on its 9/14/18 high plus 10 cents in the 2/06/19 mid-day report (read here). A "breakaway gap" cleared all overhead supply and triggered a technical buy signal.
The current Up/Down Volume Ratio of 1.2 is an unbiased indication its shares have been under accumulation over the past 50 days. Its small supply of only 58.5 million shares outstanding (S criteria) can contribute to greater price volatility in the event of institutional buying or selling. The number of top-rated funds owning its shares rose from 384 in Jun '17 to 523 in Mar '19, a reassuring sign concerning the I criteria. It has a Timeliness rating of A and Sponsorship rating of B. It completed Secondary Offerings on 11/13/15, 9/16/15, 5/15/15 and 1/14/15 since its $15 IPO on 4/15/14.
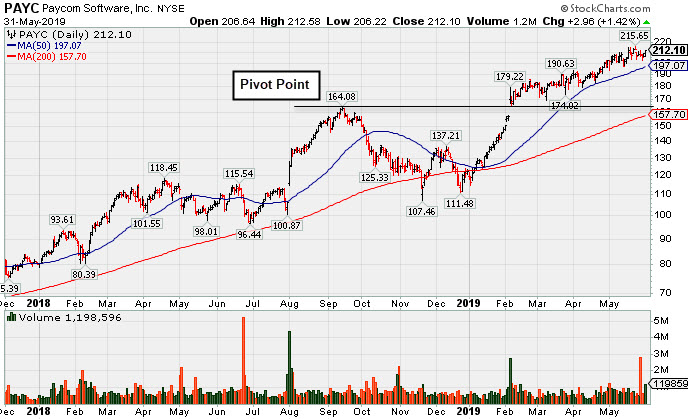
Posted Volume-Driven Gain While Hovering Near All-Time High - Friday, May 31, 2019
Paycom Software Inc (PAYC +$2.96 or +1.42% to $212.10) posted a volume-driven gain on Friday. It has been holding its ground in a tight range near its all-time high. Its 50-day moving average (DMA) line ($197.05) defines important near-term support to watch.
It reported earnings +25% on +30% sales revenues for the Mar '19 quarter, right at the +25% minimum earnings guideline (C criteria). Prior comparisons established its strong earnings track record. It has earned a 96 Earnings Per Share Rating.
The high-ranked Computer Software - Enterprise firm was last shown in this FSU section on 4/16/19 under the headline, "Paycom Software Quietly Hovering Near All-Time High". It found support after a deep slump below its 200 DMA line after dropped from the Featured Stocks list on 10/10/18. It returned to the Featured Stocks list when highlighted in yellow with new pivot point cited based on its 9/14/18 high plus 10 cents in the 2/06/19 mid-day report (read here). A "breakaway gap" cleared all overhead supply and triggered a technical buy signal.
The current Up/Down Volume Ratio of 1.3 is an unbiased indication its shares have been under accumulation over the past 50 days. Its small supply of only 58.5 million shares outstanding (S criteria) can contribute to greater price volatility in the event of institutional buying or selling. The number of top-rated funds owning its shares rose from 384 in Jun '17 to 513 in Mar '19, a reassuring sign concerning the I criteria. It has a Timeliness rating of A and Sponsorship rating of B. It completed Secondary Offerings on 11/13/15, 9/16/15, 5/15/15 and 1/14/15 since its $15 IPO on 4/15/14.
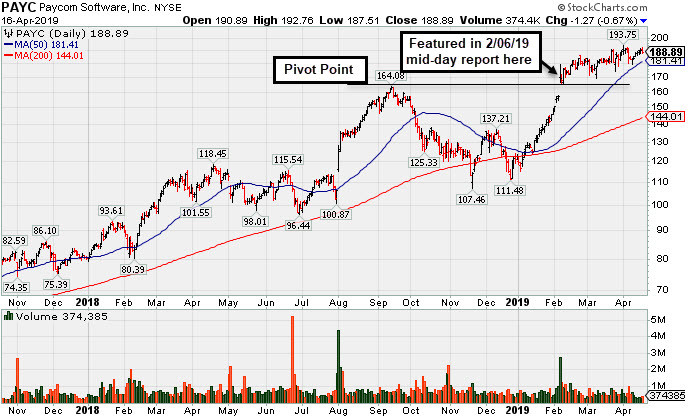
Paycom Software Quietly Hovering Near All-Time High - Tuesday, April 16, 2019
Paycom Software Inc (PAYC -$1.27 or -0.67% to $188.89) has not formed a sound new base of sufficient length but volume totals have been cooling while stubbornly holding its ground. Its 50-day moving average (DMA) line ($181.41) defines important near-term support to watch above prior lows.
The high-ranked Computer Software - Enterprise firm was last shown in this FSU section on 3/08/19 under the headline, "Consolidating Near All-Time High". It found support after a deep slump below its 200 DMA line after dropped from the Featured Stocks list on 10/10/18. It returned to the Featured Stocks list when highlighted in yellow with new pivot point cited based on its 9/14/18 high plus 10 cents in the 2/06/19 mid-day report (read here). A "breakaway gap" cleared all overhead supply and triggered a technical buy signal.
Bullish action came after it reported earnings +24% on +32% sales revenues for the Dec '18 quarter, one notch below the +25% minimum earnings guideline (C criteria). Prior comparisons established its strong earnings track record. It has earned a 94 Earnings Per Share Rating.
The current Up/Down Volume Ratio of 1.6 is an unbiased indication its shares have been under heavy accumulation over the past 50 days. Its small supply of only 58.6 million shares outstanding (S criteria) can contribute to greater price volatility in the event of institutional buying or selling. The number of top-rated funds owning its shares rose from 384 in Jun '17 to 470 in Mar '19, a reassuring sign concerning the I criteria. It has a Timeliness rating of A and Sponsorship rating of B. It completed Secondary Offerings on on 11/13/15, 9/16/15, 5/15/15 and 1/14/15 since its $15 IPO on 4/15/14.
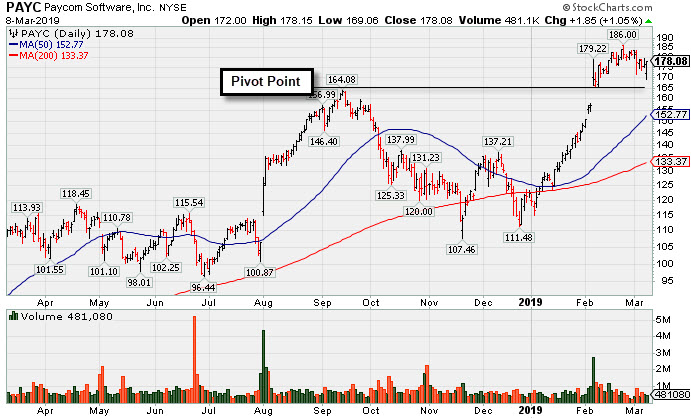
Consolidating Near All-Time High - Friday, March 8, 2019
Paycom Software Inc (PAYC +$1.85 or +1.05% to $178.08) managed a "positive reversal" today after early weakness. It was highlighted in yellow with new pivot point cited based on its 9/14/18 high plus 10 cents in the 2/06/19 mid-day report (read here). A "breakaway gap" cleared all overhead supply and triggered a technical buy signal. Bullish action came after it reported earnings +24% on +32% sales revenues for the Dec '18 quarter, one notch below the +25% minimum earnings guideline (C criteria). Prior comparisons established its strong earnings track record and it has earned a 94 Earnings Per Share Rating.
The high-ranked Computer Software - Enterprise firm was last shown in this FSU section on 2/06/19 with an annotated graph under the headline, "Breakaway Gap Backed by Volume +388% Above Average". It found support after a deep slump below its 200 DMA line since dropped from the Featured Stocks list on 10/10/18.
The current Up/Down Volume Ratio of 1.9 is an unbiased indication its shares have been under heavy accumulation over the past 50 days. Its small supply of only 58.6 million shares outstanding (S criteria) can contribute to greater price volatility in the event of institutional buying or selling. The number of top-rated funds owning its shares rose from 384 in Jun '17 to 461 in Dec '18, a reassuring sign concerning the I criteria. It has a Timeliness rating of A and Sponsorship rating of B. It completed Secondary Offerings on on 11/13/15, 9/16/15, 5/15/15 and 1/14/15 since its $15 IPO on 4/15/14.
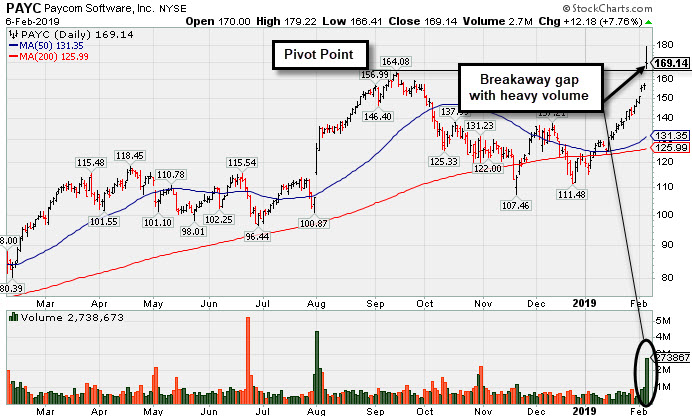
Breakaway Gap Backed by Volume +388% Above Average - Wednesday, February 6, 2019
Paycom Software Inc (PAYC +$12.18 or +7.76% to $169.14) was highlighted in yellow with new pivot point cited based on its 9/14/18 high plus 10 cents in the earlier mid-day report (read here). Today's "breakaway gap" cleared all overhead supply and triggered a technical buy signal. Bullish action came after it reported earnings +24% on +32% sales revenues for the Dec '18 quarter, one notch below the +25% minimum earnings guideline (C criteria). Prior comparisons established its strong earnings track record and it has earned a 93 Earnings Per Share Rating.
The high-ranked Computer Software - Enterprise firm was last shown in this FSU section on 9/18/18 with an annotated graph under the headline, "Very Extended From Base After Impressive Rally". It found support after a deep slump below its 200 DMA line since dropped from the Featured Stocks list on 10/10/18.
The current Up/Down Volume Ratio of 1.7 is an unbiased indication its shares have been under heavy accumulation over the past 50 days. Its small supply of only 58.6 million shares outstanding (S criteria) can contribute to greater price volatility in the event of institutional buying or selling. The number of top-rated funds owning its shares rose from 384 in Jun '17 to 478 in Dec '18, a reassuring sign concerning the I criteria. It has a Timeliness rating of A and Sponsorship rating of B. It completed Secondary Offerings on on 11/13/15, 9/16/15, 5/15/15 and 1/14/15 since its $15 IPO on 4/15/14.
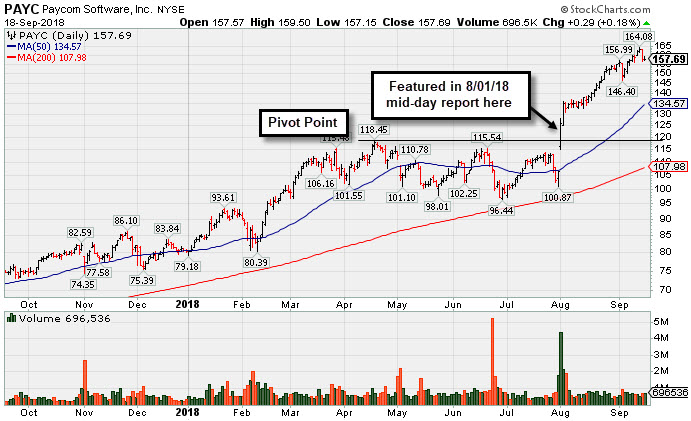
Very Extended From Base After Impressive Rally - Tuesday, September 18, 2018
Paycom Software Inc (PAYC +$0.29 or +0.18% to $157.69) is perched near its all-time high, very extended from any sound base. Near term support to watch on pullbacks is its 50-day moving average (DMA line ($134.57).
PAYC has rallied as much as +33.5% higher since highlighted in yellow with new pivot point cited based on its 4/18/18 high plus 10 cents in the 8/01/18 mid-day report (read here). It gapped up hitting a new all-time high with a considerable volume-driven gain triggering a technical buy signal.Bullish action came after it reported earnings +69% on +31% sales revenues for the Jun '18 quarter, continuing its strong earnings track record. It has earned a 98 Earnings Per Share Rating. The high-ranked Computer Software - Enterprise firm was last shown in this FSU section on 8/01/18 with an annotated graph under the headline, "Bullish Action Followed Strong Earnings News".
The current Up/Down Volume Ratio of 2.9 is an unbiased indication its shares have been under heavy accumulation over the past 50 days. The number of top-rated funds owning its shares rose from 384 in Jun '17 to 436 in Jun '18, a reassuring sign concerning the I criteria. It has a Timeliness rating of A and Sponsorship rating of B. It completed Secondary Offerings on on 11/13/15, 9/16/15, 5/15/15 and 1/14/15 since its $15 IPO on 4/15/14.
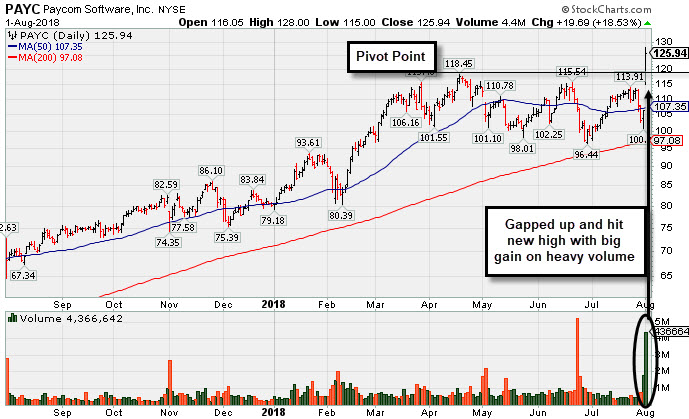
Bullish Action Followed Strong Earnings News - Wednesday, August 1, 2018
Paycom Software Inc (PAYC +$19.69 or +18.53% to $125.94) was highlighted in yellow with new pivot point cited based on its 4/18/18 high plus 10 cents in the earlier mid-day report (read here). Bullish action came after it reported earnings +69% on +31% sales revenues for the Jun '18 quarter, continuing its strong earnings track record. It gapped up today hitting a new all-time high with a considerable volume-driven gain triggering a technical buy signal. Found support above its 200 DMA line during the consolidation since recently dropped from the Featured Stocks list. Members were reminded to be patient and disciplined - "Subsequent gains above the pivot point backed by at least +40% above average volume are needed to trigger a proper technical buy ."
PAYC was last shown in this FSU section on 6/22/18 with an annotated graph under the headline, "Slumped Below 50-Day Moving Average With Heavy Volume". Fundamentals remain strong. It previously reported earnings +56% on +29% sales revenues for the Mar '18 quarter. It has earned a 98 Earnings Per Share Rating.
.
The high-ranked Computer Software - Enterprise firm's current Up/Down Volume ratio of 1.2 is an unbiased indication its shares have been under slight accumulation over the past 50 days. The number of top-rated funds owning its shares rose from 384 in Jun '17 to 409 in Jun '18, a reassuring sign concerning the I criteria. It has a Timeliness rating of A and Sponsorship rating of B. It completed Secondary Offerings on on 11/13/15, 9/16/15, 5/15/15 and 1/14/15 since its $15 IPO on 4/15/14.
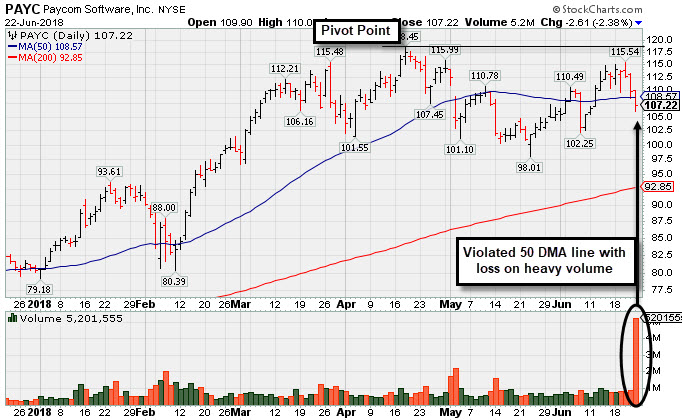
Slumped Below 50-Day Moving Average With Heavy Volume - Friday, June 22, 2018
Paycom Software Inc (PAYC -$2.61 or -2.38% to $107.22) fell below isignalsignalts 50-day moving average (DMA) line ($108.58) with a volume-driven loss today. A rebound above the 50 DMA line is needed for its outlook to improve.It faces some resistance due to overhead supply up to the $118 level. A new pivot point was recently cited based on its 4/18/18 high plus 10 cents. Members were reminded to be patient and disciplined - "Subsequent gains above the pivot point backed by at least +40% above average volume are needed to trigger a proper technical buy ."
PAYC found prompt support near prior lows in the $101 area after last shown in this FSU section on 5/03/18 with an annotated graph under the headline, "Violation of 50-Day Average Triggered Technical Sell Signal".Fundamentals remain strong. It recently reported earnings +56% on +29% sales revenues for the Mar '18 quarter, continuing its strong earnings track record. It has earned a 98 Earnings Per Share Rating.
.
The high-ranked Computer Software - Enterprise firm's current Up/Down Volume ratio of 1.2 is an unbiased indication its shares have been under slight accumulation over the past 50 days. The number of top-rated funds owning its shares rose from 384 in Jun '17 to 432 in Mar '18, a reassuring sign concerning the I criteria. It has a Timeliness rating of A and Sponsorship rating of B. It completed Secondary Offerings on on 11/13/15, 9/16/15, 5/15/15 and 1/14/15 since its $15 IPO on 4/15/14.
Violation of 50-Day Average Triggered Technical Sell Signal - Thursday, May 3, 2018
Paycom Software Inc (PAYC +$0.74 or +0.71% to $105.12) managed a positive reversal today after an early loss. It gapped down on the prior session and violated its 50-day moving average (DMA) line ($108.53) triggering a technical sell signal. Recent lows in the $101 area define important support to watch where further deterioration would raise more serious concerns. A rebound above the 50 DMA line is needed for its outlook to improve.
Fundamentals remain strong. It recently reported earnings +56% on +29% sales revenues for the Mar '18 quarter, continuing its strong earnings track record. It has earned a 98 Earnings Per Share Rating.
.
Disciplined investors avoid chasing stocks more than +5% above prior highs and always limit losses by selling any stock that falls more than -7% from their purchase price. PAYC was last shown in this FSU section on 4/04/18 with an annotated graph under the headline, "Pulling Back After Negative Reversal at All-Time High Last Week".
The high-ranked Computer Software - Enterprise firm's current Up/Down Volume ratio of 1.1 is an unbiased indication its shares have been under slight accumulation over the past 50 days. The number of top-rated funds owning its shares rose from 384 in Jun '17 to 423 in Mar '18, a reassuring sign concerning the I criteria. It has a Timeliness rating of A and Sponsorship rating of B. It completed Secondary Offerings on on 11/13/15, 9/16/15, 5/15/15 and 1/14/15 since its $15 IPO on 4/15/14.

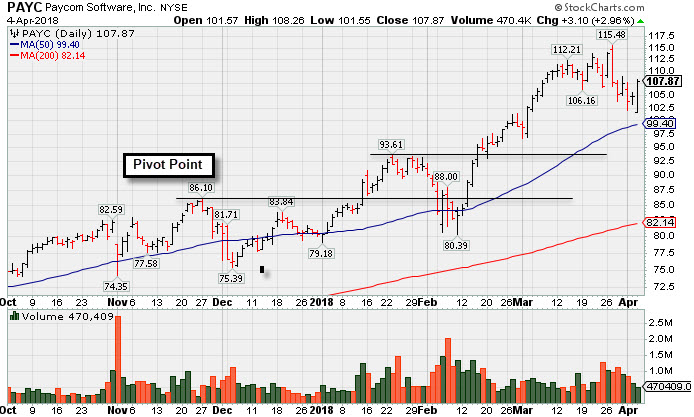
Pulling Back After Negative Reversal at All-Time High Last Week - Wednesday, April 4, 2018
Paycom Software Inc (PAYC +$3.10 or +2.96% to $107.87) has been consolidating above its 50-day moving average (DMA) line ($99.40) which defines near-term support above prior highs in the $93 area. It is very extended from any sound base, and there was a "negative reversal" on 3/27/18 after hitting a new all-time high. Disciplined investors avoid chasing stocks more than +5% above prior highs and always limit losses by selling any stock that falls more than -7% from their purchase price. PAYC was last shown in this FSU section on 3/07/18 with an annotated graph under the headline, "Extended From Prior Base After Streak of Gains".
Fundamentals remain strong. Recently it reported Dec '17 quarterly earnings +61% on +30% sales revenues, continuing its strong earnings track record. It has earned a 99 Earnings Per Share Rating, the highest possible rank.
The high-ranked Computer Software - Enterprise firm's current Up/Down Volume ratio of 1.1 is an unbiased indication its shares have been under slight accumulation over the past 50 days. The number of top-rated funds owning its shares rose from 384 in Jun '17 to 417 in Mar '18, a reassuring sign concerning the I criteria. It has a Timeliness rating of A and Sponsorship rating of B. It completed Secondary Offerings on on 11/13/15, 9/16/15, 5/15/15 and 1/14/15 since its $15 IPO on 4/15/14.
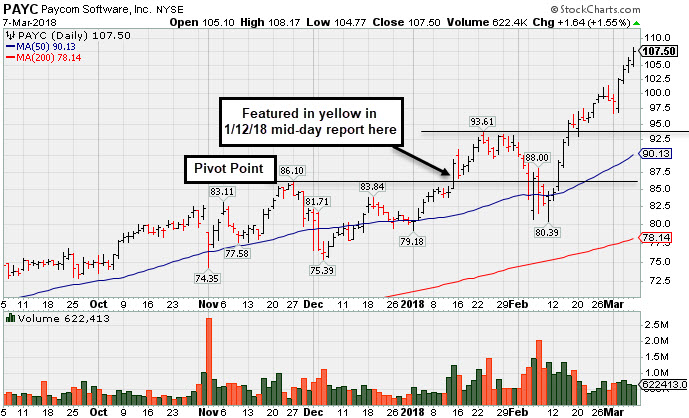
Extended From Prior Base After Streak of Gains - Wednesday, March 7, 2018
Paycom Software Inc (PAYC +$1.64 or +1.55% to $107.50) has been stubbornly holding its ground and hit yet another new all-time high with today's 4th consecutive gain, getting very extended from any sound base. Prior highs in the $93 area define initial support above its 50-day moving average (DMA) line ($90.13). Disciplined investors avoid chasing stocks more than +5% above prior highs and always limit losses by selling any stock that falls more than -7% from their purchase price.
Fundamentals remain strong. Recently it reported Dec '17 quarterly earnings +61% on +30% sales revenues, continuing its strong earnings track record. It has earned a 99 Earnings Per Share Rating, the highest possible rank.
It has made steady progress since last shown in this FSU section on 2/08/18 with an annotated graph under the headline, "Fell Below 50 Day Average With Losses on Above Average Volume". The high-ranked Computer Software - Enterprise firm's current Up/Down Volume ratio of 1.4 is an unbiased indication its shares have been under slight distributional pressure over the past 50 days. The number of top-rated funds owning its shares rose from 286 in Mar '16 to 405 in Dec '17, a reassuring sign concerning the I criteria. It has a Timeliness rating of A and Sponsorship rating of B. It completed Secondary Offerings on on 11/13/15, 9/16/15, 5/15/15 and 1/14/15 since its $15 IPO on 4/15/14.
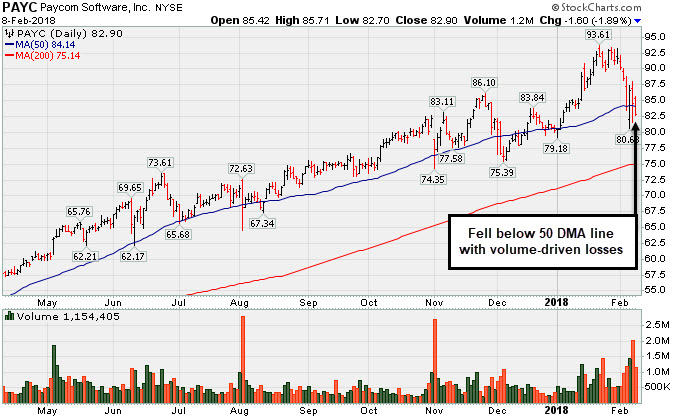
Fell Below 50 Day Average With Losses on Above Average Volume - Thursday, February 8, 2018
Paycom Software Inc (PAYC -$1.60 or -1.89% to $82.90) slumped to a close below its 50-day moving average (DMA) line ($84.14) with today's 4th volume-driven loss in the span of 5 sessions raising more serious concerns. Disciplined investors avoid chasing stocks more than +5% above proir highs and always limit losses by selling any stock that falls more than -7% from their purchase price.
Recently it reported Dec '17 quarterly earnings +61% on +30% sales revenues, continuing its strong earnings track record. It has earned a 99 Earnings Per Share Rating, the highest possible rank.
It was last shown in this FSU section on 1/12/18 with an annotated graph under the headline, "Finished Strong With Big Gain on +118% Above Average Volume". It finished strong after highlighted in yellow with pivot point cited based on its 11/27/17 high plus 10 cents in the earlier mid-day report (read here). Its gain above the pivot point was backed by +118% above average volume triggering a technical buy signal.
The high-ranked Computer Software - Enterprise firm's current Up/Down Volume ratio of 0.9 is an unbiased indication its shares have been under slight distributional pressure over the past 50 days. The number of top-rated funds owning its shares rose from 286 in Mar '16 to 407 in Dec '17, a reassuring sign concerning the I criteria. It has a Timeliness rating of A and Sponsorship rating of B. It completed Secondary Offerings on on 11/13/15, 9/16/15, 5/15/15 and 1/14/15 since its $15 IPO on 4/15/14.
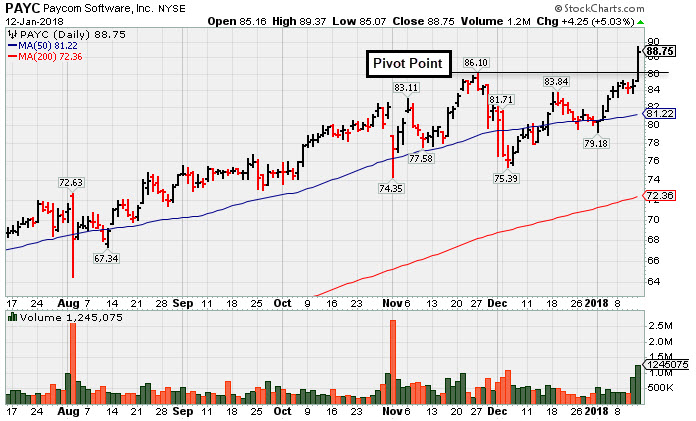
Finished Strong With Big Gain on +118% Above Average Volume - Friday, January 12, 2018
Paycom Software Inc (PAYC +$4.25 or +5.03% to +$88.75) finished strong after highlighted in yellow with pivot point cited based on its 11/27/17 high plus 10 cents in the earlier mid-day report (read here). Its gain above the pivot point was backed by +118% above average volume triggering a technical buy signal.
The high-ranked Computer Software - Enterprise firm reported earnings +93% on +31% sales revenues for the Sep '17 quarter, and 3 of the past 4 quarterly comparisons were well above the +25% minimum earnings guideline (C criteria). Since dropped from the Featured Stocks list on 11/03/16 it found support near its 200 DMA line and then rebounded and rallied to new highs.
It has earned a 98 Earnings Per Share Rating, near the highest possible rank. It reported earnings +110% on +61% sales revenues for the Jun '16 quarter, and prior quarterly earnings were above the +25% minimum guideline (C criteria).
Its current Up/Down Volume ratio of 1.3 is an unbiased indication its shares have been under accumulation over the past 50 days. The number of top-rated funds owning its shares rose from 286 in Mar '16 to 411 in Dec '17, a reassuring sign concerning the I criteria. It has a Timeliness rating of A and Sponsorship rating of B. It completed Secondary Offerings on on 11/13/15, 9/16/15, 5/15/15 and 1/14/15 since its $15 IPO on 4/15/14.
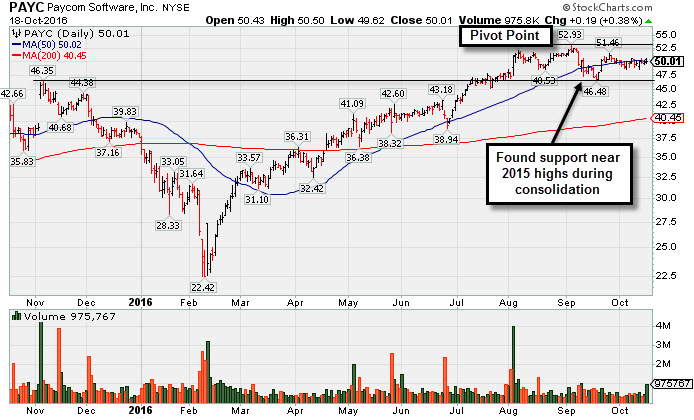
Technical Breakout Needed to Trigger a Proper Buy Signal - Tuesday, October 18, 2016
Paycom Software Inc (PAYC +$0.19 or +0.38% to $50.01) was highlighted in yellow in the earlier mid-day report with new pivot point cited based on its 9/06/16 high plus 10 cents. Subsequent volume-driven gains above its pivot point and into new (N criteria) high territory are needed to trigger a proper technical buy signal.
The Computer Software - Enterprise group is a leading group (L criteria) with a Group Relative Strength rating of 97. Technically, PAYC has been consolidating near its 50-day moving average (DMA) line after finding support near prior highs in the $46 area. It has earned a 99 Earnings Per Share Rating, the highest possible rank. It reported earnings +110% on +61% sales revenues for the Jun '16 quarter, and prior quarterly earnings were above the +25% minimum guideline (C criteria).
The number of top-rated funds owning its shares rose from 286 in Mar '16 to 334 in Sep '16, a reassuring sign concerning the I criteria. It has a Timeliness rating of A and Sponorship rating of C It completed Secondary Offerings on on 11/13/15, 9/16/15, 5/15/15 and 1/14/15 since its $15 IPO on 4/15/14.
The number of top-rated funds owning its shares rose from 286 in Mar '16 to 334 in Sep '16, a reassuring sign concerning the I criteria. It has a Timeliness rating of A and Sponorship rating of C It completed Secondary Offerings on on 11/13/15, 9/16/15, 5/15/15 and 1/14/15 since its $15 IPO on 4/15/14.