Technical Breakout With Volume-Driven Gain For New High - Monday, January 8, 2018
Universal Display Corp (OLED +$15.55 or +8.67% to $194.85) finished strong after highlighted in yellow with new pivot point cited based on its 11/24/17 high plus 10 cents in the earlier mid-day report (read here). The gain and a strong close above the pivot point was backed by +215% above average volume triggering a convincing new (or add-on) technical buy signal. OLED found support above its 50-day moving average (DMA) line ($171.33) during its recent consolidation. Subsequent losses leading to a violation may trigger a technical sell signal.
Fundamentals remain very strong. It reported Sep '17 quarterly earnings of 28 cents per share versus a year-ago loss of 3 cents per share on sales revenues +104%. It reported +115% earnings on +59% sales revenues for the Jun '17 quarter, then marking its 3rd consecutive strong quarter above the +25% minimum guideline (C criteria), helping it better match with the fact-based investment system's fundamental guidelines. Its annual earnings (A criteria) history has been strong.
The high-ranked Electronic Products firm has earned a current Timeliness rating of A and a Sponsorship rating of B. The number of top-rated funds owning its shares rose from 355 in Sep '16 to 713 in Sep '17. Its current Up/Down Volume Ratio of 1.5 is an unbiased indication its shares have been under accumulation over the past 50 days (I criteria). Its small supply of only 45.3 million shares (S criteria) in the public float can contribute to greater volatility in the event of institutional buying or selling.
It wedged higher with gains lacking great volume conviction after since last shown in this FSU section on 12/13/17 with an annotated graph under the headline, "Consolidating After +50% Rally Since First Featured ". OLED has traded up as much as +53.8% since first highlighted in yellow at $128.22 in the 8/31/17 mid-day report (read here) with a pivot point cited based on its 7/26/17 high while then rallying from a 12-week "double bottom" base pattern.
Charts courtesy www.stockcharts.com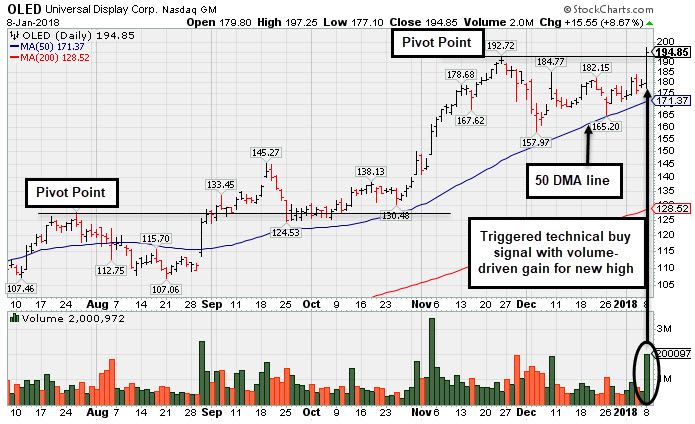
Consolidating After +50% Rally Since First Featured 8/31/17 - Wednesday, December 13, 2017
Universal Display Corp (OLED -$0.35 or -0.21% to $169.15) gapped up on 12/08/17, rallying on news of a new supply agreement. It has not formed a sound base pattern. Its 50-day moving average (DMA) line ($157.25) defines important near-term support above the prior high in the $145 area.
Recently it reported Sep '17 quarterly earnings of 28 cents per share versus a year-ago loss of 3 cents per share on sales revenues +104%.It reported +115% earnings on +59% sales revenues for the Jun '17 quarter, then marking its 3rd consecutive strong quarter above the +25% minimum guideline (C criteria), helping it better match with the fact-based investment system's fundamental guidelines. Its annual earnings (A criteria) history has been strong.
The high-ranked Electronic Products firm has earned a current Timeliness rating of A and a Sponsorship rating of B. The number of top-rated funds owning its shares rose from 355 in Sep '16 to 415 in Sep '17. Its current Up/Down Volume Ratio of 1.8 is an unbiased indication its shares have been under accumulation over the past 50 days (I criteria). Its small supply of only 40.9 million shares (S criteria) in the public float can contribute to greater volatility in the event of institutional buying or selling.
It encountered distributional pressure while retreating from its all-time high hit since last shown in this FSU section on 11/17/17 with an annotated graph under the headline, "Electronic Products Firm Perched at Record High". OLED has traded up as much as +50.3% since first highlighted in yellow at $128.22 in the 8/31/17 mid-day report (read here) with a pivot point cited based on its 7/26/17 high while then rallying from a 12-week "double bottom" base pattern.
Charts courtesy www.stockcharts.com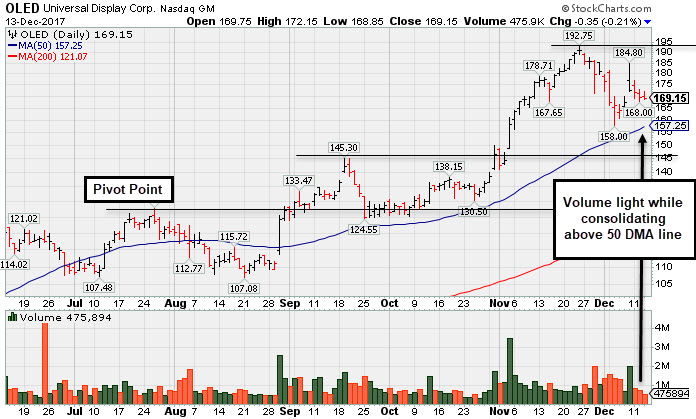
Electronic Products Firm Perched at Record High - Friday, November 17, 2017
Universal Display Corp (OLED +$1.75 or +0.98% to $181.00) hit another new all-time high with today's gain on light volume, very extended from any sound base pattern. Recently it reported Sep '17 quarterly earnings of 28 cents per share versus a year-ago loss of 3 cents per share on sales revenues +104%.
OLED was first featured in yellow in the 8/31/17 mid-day report (read here). It was last shown in this FSU section on 10/25/17 with an annotated graph under the headline, "Prior Highs and 50-Day Average Define Near-Term Support". It reported +115% earnings on +59% sales revenues for the Jun '17 quarter, its 3rd consecutive strong quarter above the +25% minimum guideline (C criteria), helped it better match with the fact-based investment system's fundamental guidelines. Its annual earnings (A criteria) history has been strong.
The high-ranked Electronic Products firm has earned a current Timeliness rating of A and a Sponsorship rating of B. The number of top-rated funds owning its shares rose from 355 in Sep '16 to 418 in Sep '17. Its current Up/Down Volume Ratio of 2.3 is an unbiased indication its shares have been under accumulation over the past 50 days (I criteria). Its small supply of only 40.9 million shares (S criteria) in the public float can contribute to greater volatility in the event of institutional buying or selling.
Charts courtesy www.stockcharts.com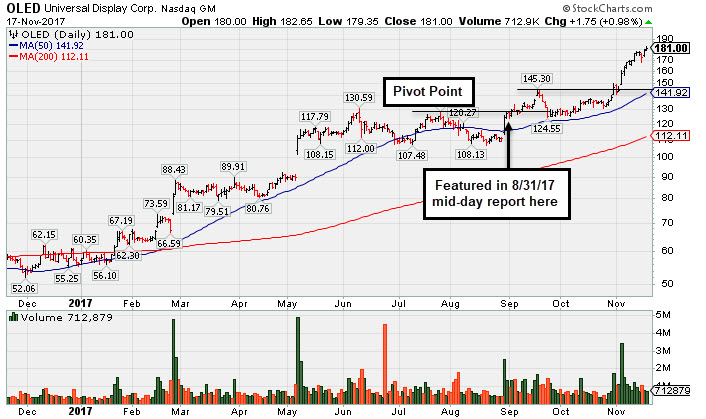
Prior Highs and 50-Day Average Define Near-Term Support - Wednesday, October 25, 2017
Universal Display Corp (OLED -$2.60 or -1.92% to $132.60) is building on a new base pattern. It is due to report Sep '17 quarterly results after the close on Thursday, November 2nd. Its 50-day moving average (DMA) line ($127.41) and recent lows define important near-term support to watch on pullbacks.
OLED held its ground stubbornly and tallied a solid volume driven gain on 10/12/17 since last shown in this FSU section on 9/28/17 with an annotated graph under the headline, "Consolidating Near Prior Highs Following Recent Breakout". Gains backed by above average volume had triggered a technical buy signal and helped it rally above its "max buy" level, but it abruptly retreated.
It reported +115% earnings on +59% sales revenues for the Jun '17 quarter, its 3rd consecutive strong quarter above the +25% minimum guideline (C criteria), helped it better match with the fact-based investment system's fundamental guidelines. Its annual earnings (A criteria) history has been strong.
The high-ranked Electronic Products firm has earned a current Timeliness rating of A and a Sponsorship rating of B. The number of top-rated funds owning its shares rose from 355 in Sep '16 to 406 in Sep '17. Its current Up/Down Volume Ratio of 1.5 is an unbiased indication its shares have been under accumulation over the past 50 days (I criteria). Its small supply of only 40.9 million shares (S criteria) in the public float can contribute to greater volatility in the event of institutional buying or selling.
Charts courtesy www.stockcharts.com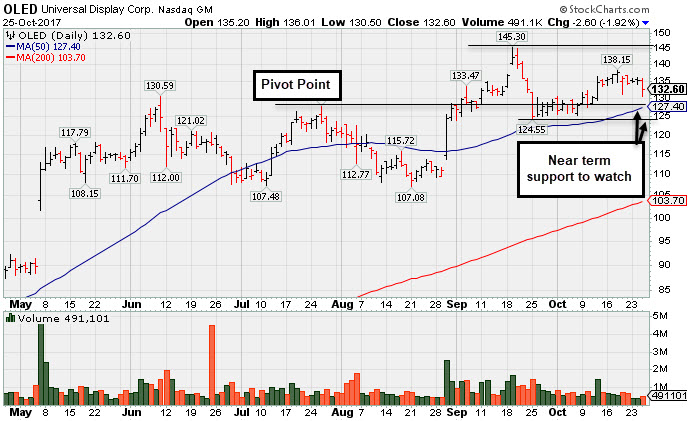
Consolidating Near Prior Highs Following Recent Breakout - Thursday, September 28, 2017
Universal Display Corp (OLED $127.85) has been holding its ground after pulling back near prior highs in the $127-130 area. Its 50-day moving average (DMA) line ($122.33) defines the next important support to watch.
OLED was highlighted in yellow with new pivot point cited based on its 7/26/17 high in the 8/31/17 mid-day report (read here) while trying to rally from a 12-week "double bottom" base pattern. It was last shown in this FSU section on 8/31/17 with an annotated graph under the headline, " Rallied Near Pivot Point But Confirming Gains Are Still Needed". Subsequent gains backed by above average volume triggered a technical buy signal and helped it rally above its "max buy" level, but it abruptly retreated.
Recently it reported +115% earnings on +59% sales revenues for the Jun '17 quarter, its 3rd consecutive strong quarter above the +25% minimum guideline (C criteria), helping it better match with the fact-based investment system's fundamental guidelines. Annual earnings (A criteria) history has been strong.
The high-ranked Electronic Products firm has earned a current Timeliness rating of B and a Sponsorship rating of C. The number of top-rated funds owning its shares rose from 355 in Sep '16 to 392 in Jun '17. Its current Up/Down Volume Ratio of 1.1 is an unbiased indication its shares have been under slight accumulation over the past 50 days (I criteria). Its small supply of only 40.9 million shares (S criteria) in the public float can contribute to greater volatility in the event of institutional buying or selling.
Charts courtesy www.stockcharts.com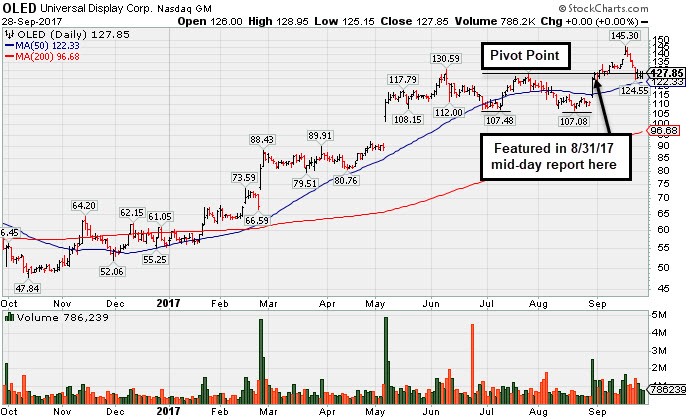
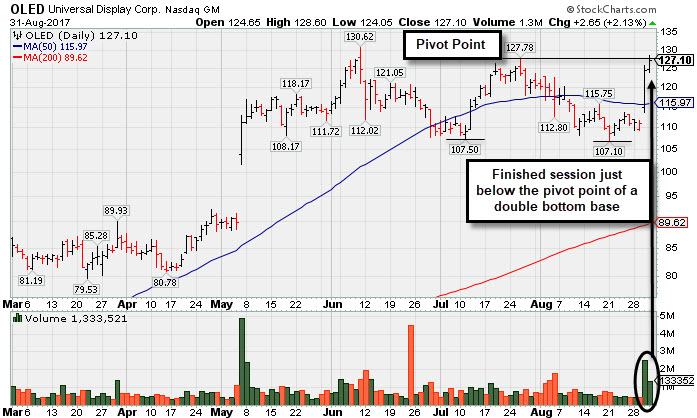
Rallied Near Pivot Point But Confirming Gains Are Still Needed - Thursday, August 31, 2017
Universal Display Corp (OLED +$2.65 or +2.13% to $127.10) was highlighted in yellow with new pivot point cited based on its 7/26/17 high in the earlier mid-day report (read here) while trying to rally from a 12-week "double bottom" base pattern. Subsequent gains backed by at least +40% above average volume and a strong close above the pivot point may trigger a convincing technical buy signal.
It rebounded further above its 50-day moving average (DMA) line today, challenging prior highs with a 2nd consecutive big volume-driven gain. Very little resistance remains due to overhead supply.
Recently it reported +115% earnings on +59% sales revenues for the Jun '17 quarter, its 3rd consecutive strong quarter above the +25% minimum guideline (C criteria), helping it better match with the fact-based investment system's fundamental guidelines. Annual earnings (A criteria) history has been strong.
The high-ranked Electronic Products firm has earned a current Timeliness rating of B and a Sponsorship rating of B. The number of top-rated funds owning its shares rose from 355 in Sep '16 to 399 in Jun '17. Its current Up/Down Volume Ratio of 0.8 is an unbiased indication its shares have been under some distributional pressure over the past 50 days (I criteria). Its small supply of only 40.9 million shares (S criteria) in the public float can contribute to greater volatility in the event of institutional buying or selling.
Charts courtesy www.stockcharts.com