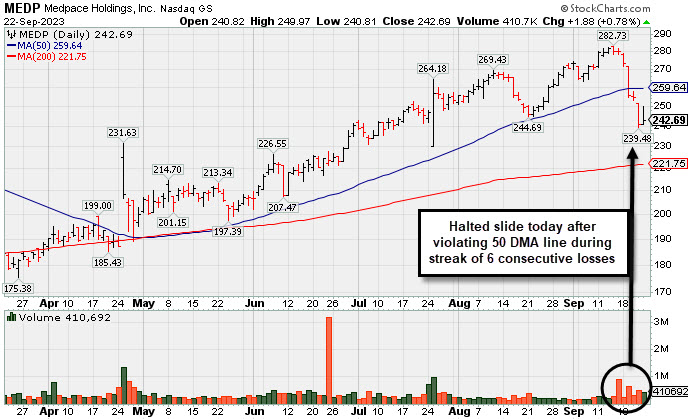
Damaging Streak of Losses Violated 50-Day Moving Average Line - Friday, September 22, 2023
Medpace Holdings Inc (MEDP +$1.88 or +0.78% to $242.69) halted its slide today after 6 damaging losses, abruptly retreating below the prior high ($269) and violating its 50-day moving average (DMA) line ($260) triggering a technical sell signal. Only a prompt rebound above the 50 DMA line would help its outlook improve. Fundamentals remain strong.
MEDP was highlighted in yellow with pivot point cited based on its 1/23/23 high plus 10 cents in the earlier mid-day report (read here). It was last shown in this FSU section on 8/23/23 with an annotated graph under the headline, "Consolidating Above 50-Day Moving Average".
It has a 99 Earnings Per Share Rating. MEDP reported earnings increases above the +25% minimum earnings guideline (C criteria) in the past 5 quarterly comparisons through Jun '23. It is also a great match with the winning models of the fact-based investment system as its annual earnings history has been strong and steady.
There is a small supply of only 30.6 million shares outstanding (S criteria) which can contribute to greater price volatility in the event of institutional buying or selling. The number of top-rated funds owning its shares rose from 188 in Dec '17 to 731 in Jun '23, a reassuring sign concerning the I criteria. Its current Up/Down Volume Ratio of 0.9 is an unbiased indication its shares have been under slight distributional pressure over the past 50 days. It has earned a Timeliness Rating of A and Sponsorship rating of B.
Charts courtesy of www.stockcharts.com
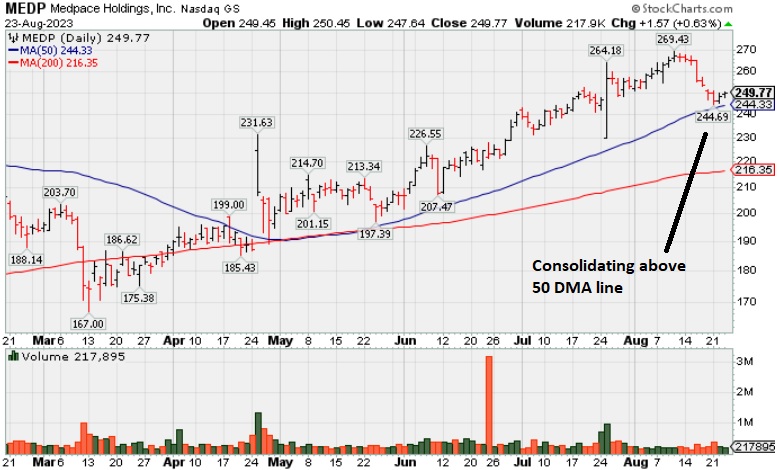
Consolidating Above 50-Day Moving Average - Wednesday, August 23, 2023
Medpace Holdings Inc (MEDP +$1.29 or +0.52% to $249.49) is consolidating above Its 50-day moving average (DMA) line ($244) and prior highs in the $241 area which define important near-term support to watch. Fundamentals remain strong.
MEDP was highlighted in yellow with pivot point cited based on its 1/23/23 high plus 10 cents in the earlier mid-day report (read here). It hit a new all-time high with a volume-driven gain backed by +170% above average volume clinching a technical buy signal. MEDP was last shown in this FSU section on 7/25/23 with an annotated graph under the headline, "Medpace Posted a Solid Volume-Driven Gain for a New High".
It has a 99 Earnings Per Share Rating. MEDP reported earnings increases above the +25% minimum earnings guideline (C criteria) in the past 5 quarterly comparisons through Jun '23. It is also a great match with the winning models of the fact-based investment system as its annual earnings history has been strong and steady.
There is a small supply of only 30.5 million shares outstanding (S criteria) which can contribute to greater price volatility in the event of institutional buying or selling. The number of top-rated funds owning its shares rose from 188 in Dec '17 to 743 in Jun '23, a reassuring sign concerning the I criteria. Its current Up/Down Volume Ratio of 1.0 is an unbiased indication its shares have been neutral concerning accumulation/distribution over the past 50 days. It has earned a Timeliness Rating of B and Sponsorship rating of B.
Charts courtesy of www.stockcharts.com
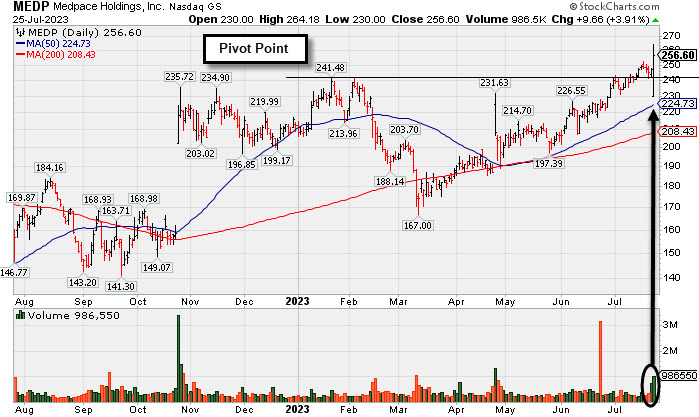
Medpace Posted a Solid Volume-Driven Gain for a New High - Tuesday, July 25, 2023
Medpace Holdings Inc (MEDP +$9.66 or +3.91% to $256.60) finished strong after highlighted in yellow with pivot point cited based on its 1/23/23 high plus 10 cents in the earlier mid-day report (read here). It hit a new all-time high with today's volume-driven gain backed by +170% above average volume clinching a technical buy signal. Prior highs in the $241 area define support to watch on pullbacks.
It has a 99 Earnings Per Share Rating. MEDP reported earnings increases above the +25% minimum earnings guideline (C criteria) in the past 5 quarterly comparisons through Jun '23. It is also a great match with the winning models of the fact-based investment system as its annual earnings history has been strong and steady.
It went through a deep and choppy consolidation since dropped from the Featured Stocks list on 1/04/22. It was last shown in this FSU section on 12/28/21 with an annotated graph under the headline, "Pulling Back After Rebounding Near High".
There is a small supply of only 30.5 million shares outstanding (S criteria) which can contribute to greater price volatility in the event of institutional buying or selling. The number of top-rated funds owning its shares rose from 188 in Dec '17 to 749 in Jun '23, a reassuring sign concerning the I criteria. Its current Up/Down Volume Ratio of 0.9 is an unbiased indication its shares have been under slight distributional pressure over the past 50 days. It has earned a Timeliness Rating of B and Sponsorship rating of B.
Charts courtesy of www.stockcharts.com
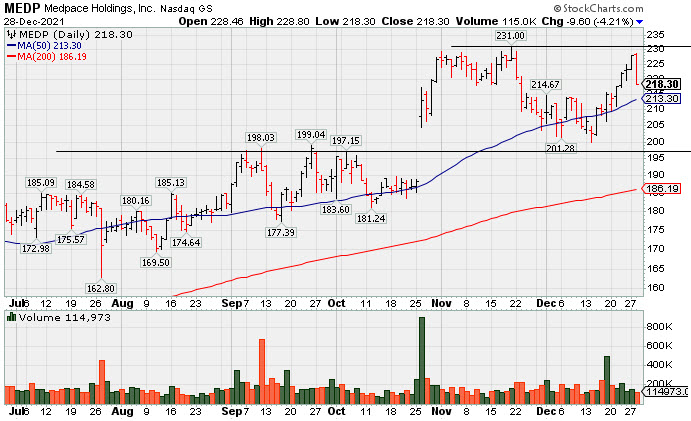
Pulling Back After Rebounding Near High - Tuesday, December 28, 2021
Medpace Holdings Inc (MEDP -$9.60 or -4.21% to $218.30) found support near its 50-day moving average (DMA) line ($213.30) recently. Prior highs in the $199 area also define important near-term support to watch. More damaging losses may trigger a worrisome technical sell signal. Recently it has been noted repeatedly - "Sep '21 earnings rose +18% on +28% sales revenues versus the year ago period, below the +25% minimum earnings guideline (C criteria), raising fundamental concerns." It still has a 96 Earnings Per Share Rating, putting it in the top 5% of all publicly traded companies. Through Jun '21 it had shown 4 strong quarterly earnings increases above the +25% minimum guideline (C criteria), helping it better match the winning models of the fact-based investment system. Annual earnings history has still been strong.
MEDP was highlighted in yellow with pivot point cited based on its 4/26/21 high plus 10 cents in the 9/10/21 mid-day report. It was last shown in this FSU section on 11/17/21 with an annotated graph under the headline, "Medpace Hovering at High With Volume Totals Cooling".
There is a small supply of only 35.9 million shares outstanding (S criteria) which can contribute to greater price volatility in the event of institutional buying or selling. The number of top-rated funds owning its shares rose from 188 in Dec '17 to 643 in Sep '21, a reassuring sign concerning the I criteria. Its current Up/Down Volume Ratio of 1.2 is an unbiased indication its shares have been under accumulation over the past 50 days. It has earned a Timeliness Rating of C and Sponsorship rating of C. It completed Secondary Offerings on 6/12/18, 5/04/18, and 12/01/17.
Charts courtesy of www.stockcharts.com
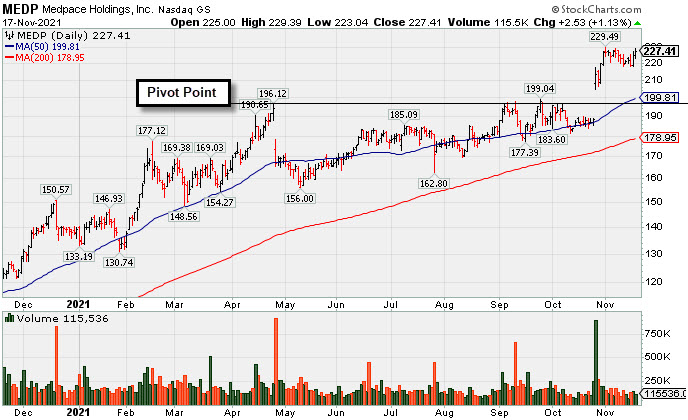
Medpace Hovering at High With Volume Totals Cooling - Wednesday, November 17, 2021
Medpace Holdings Inc (MEDP +$2.53 or +1.13% to $227.41) daily trading volume totals have still been cooling while stubbornly holding its ground near its 52-week high. Recent bullish action came even after it reported Sep '21 earnings +18% on +28% sales revenues versus the year ago period, below the +25% minimum earnings guideline (C criteria), raising fundamental concerns. Prior highs in the $199 area define initial support above its 50-day moving average (DMA) line ($199.81).
MEDP was highlighted in yellow with pivot point cited based on its 4/26/21 high plus 10 cents in the 9/10/21 mid-day report. It was last shown in this FSU section on 10/14/21 with an annotated graph under the headline, "Found Prompt Support Near 50-Day Moving Average Line".
It has a 95 Earnings Per Share Rating, putting it in the top 5% of all publicly traded companies. Through Jun '21 it had shown 4 strong quarterly earnings increases above the +25% minimum guideline (C criteria), helping it better match the winning models of the fact-based investment system. Annual earnings history has still been strong.
There is a small supply of only 35.9 million shares outstanding (S criteria) which can contribute to greater price volatility in the event of institutional buying or selling. The number of top-rated funds owning its shares rose from 188 in Dec '17 to 648 in Sep '21, a reassuring sign concerning the I criteria. Its current Up/Down Volume Ratio of 1.1 is an unbiased indication its shares have been under slight accumulation over the past 50 days. It has earned a Timeliness Rating of C and Sponsorship rating of C. Completed Secondary Offerings on 6/12/18, 5/04/18, and 12/01/17.
Charts courtesy of www.stockcharts.com
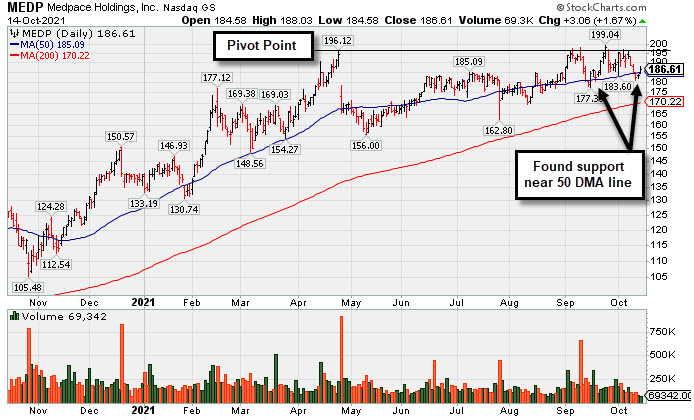
Found Prompt Support Near 50-Day Moving Average Line - Thursday, October 14, 2021
Medpace Holdings Inc (MEDP +$3.06 or +1.67% to $186.61) recently slumped from near its 52-week high with losses on light volume and found support near its 50-day moving average (DMA) line ($185). More damaging losses below recent lows would raise serious concerns and trigger technical sell signals. It was highlighted in yellow with pivot point cited based on its 4/26/21 high plus 10 cents in the 9/10/21 mid-day report. Subsequent gains and strong close above the pivot point backed by at least +40% above average volume may trigger a technical buy signal. It was last shown in this FSU section on 9/10/21 with an annotated graph under the headline, Negative Reversal Indicative of Distributional Pressure".
It has a 98 Earnings Per Share Rating, putting it in the top 5% of all publicly traded companies. MEDP reported Jun '21 earnings +66% on +36% sales revenues versus the year ago period, its 4rd strong earnings increase above the +25% minimum guideline (C criteria), helping it better match the winning models of the fact-based investment system. Annual earnings history has still been strong. It made choppy progress since dropped from the Featured Stocks list on 3/05/19.
There is a small supply of only 35.8 million shares outstanding (S criteria) which can contribute to greater price volatility in the event of institutional buying or selling. The number of top-rated funds owning its shares rose from 188 in Dec '17 to 635 in Sep '21, a reassuring sign concerning the I criteria. Its current Up/Down Volume Ratio of 1.1 is an unbiased indication its shares have been under slight accumulation over the past 50 days. It has earned a Timeliness Rating of B and Sponsorship rating of C. Completed Secondary Offerings on 6/12/18, 5/04/18, and 12/01/17.
Charts courtesy of www.stockcharts.com
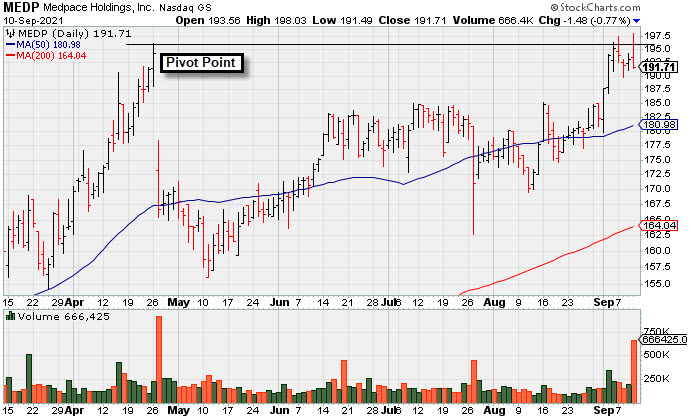
Negative Reversal Indicative of Distributional Pressure - Friday, September 10, 2021
Medpace Holdings Inc (MEDP -$1.48 or 0.77% to $191.71) had a "negative reversal" and traded very heavy volume as it finished near the session low after highlighted in yellow with pivot point cited based on its 4/26/21 high plus 10 cents in the earlier mid-day report. It challenged its all-time high with today's gain. Subsequent gains and a strong close above the pivot point backed by at least +40% above average volume may trigger a technical buy signal.
it has a 97 Earnings Per Share Rating, putting it in the top 5% of all publicly traded companies. MEDP reported Jun '21 earnings +66% on +36% sales revenues versus the year ago period, its 4rd strong earnings increase above the +25% minimum guideline (C criteria), helping it better match the winning models of the fact-based investment system. Annual earnings history has still been strong. It made choppy progress since dropped from the Featured Stocks list on 3/05/19. It was last shown in this FSU section on 2/28/19 with an annotated graph under the headline, "Damaging Gap Down Triggered Technical Sell Signal".
There is a small supply of only 35.8 million shares outstanding (S criteria) which can contribute to greater price volatility in the event of institutional buying or selling. The number of top-rated funds owning its shares rose from 188 in Dec '17 to 639 in Jun '21, a reassuring sign concerning the I criteria. Its current Up/Down Volume Ratio of 1.2 is an unbiased indication its shares have been under slight accumulation over the past 50 days. It has earned a Timeliness Rating of A and Sponsorship rating of C. Proposed yet another Secondary Offering on 8/07/18. Completed Secondary Offerings on 6/12/18, 5/04/18, and 12/01/17.
Charts courtesy of www.stockcharts.com
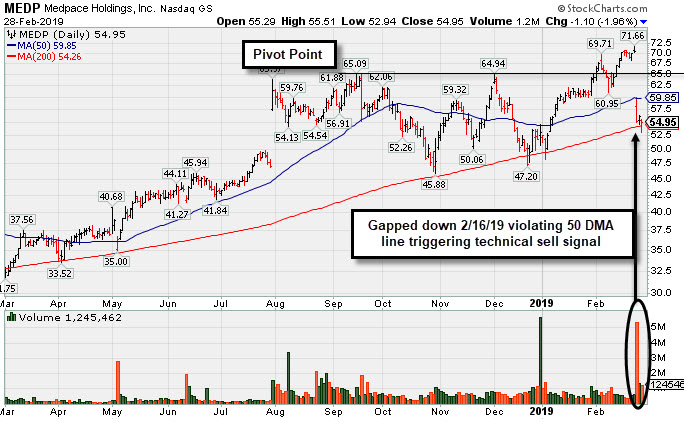
Damaging Gap Down Triggered Technical Sell Signal - Thursday, February 28, 2019
Medpace Holdings Inc (MEDP -$1.10 or -1.96% to $54.95) is sputtering near its 200-day moving average (DMA) line ($54.26). More damaging losses would raise greater concerns. It gapped down on 2/26/19 following earnings news, negating the recent breakout and violating its 50 DMA line ($60) with a damaging volume-driven loss triggering a technical sell signal. A rebound above the 50 DMA line is needed for its outlook to improve.
Fundamentals remain strong. It reported earnings +95% on +71% sales revenues for the Dec '18 quarter. continuing its strong earnings track record. MEDP was highlighted in yellow with pivot point cited based on its 9/17/18 high plus 10 cents in the 1/30/19 mid-day report (read here) and shown in this FSU section that evening with an annotated graph under the headline, "Rallied Near 52-Week High With a Volume-Driven Gain".
The high-ranked Medical-Research Eqp/Svc firm reported 4 consecutive comparisons above the +25% minimum earnings guideline (C criteria). Its annual earnings (A criteria) history has been strong and it has a 97 Earnings Per Share Rating, putting it in the top 5% of all publicly traded companies.
The number of top-rated funds owning its shares rose from 188 in Dec '17 to 435 in Dec '18, a reassuring sign concerning the I criteria. Its current Up/Down Volume Ratio of 1.1 is an unbiased indication its shares have been under slight accumulation over the past 50 days. It has earned a Timeliness Rating of A and Sponsorship rating of B. Proposed yet another Secondary Offering on 8/07/18. Completed Secondary Offerings on 6/12/18, 5/04/18, and 12/01/17.
Charts courtesy of www.stockcharts.com
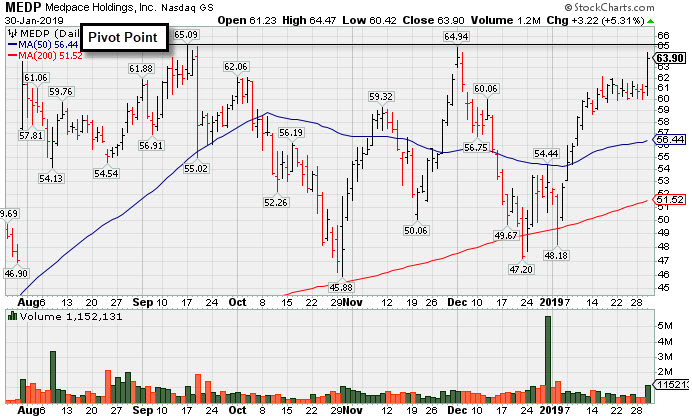
Rallied Near 52-Week High With a Volume-Driven Gain - Wednesday, January 30, 2019
Medpace Holdings Inc (MEDP +$3.22 or +5.31% to $63.90) was highlighter in yellow with pivot point cited based on its 9/17/18 high plus 10 cents in the earlier mid-day report (read here). It nearly challenged its 52-week high with today's big gain backed by +57% above average volume. Subsequent gains above the pivot point backed by at least +40% above average volume may trigger a technical buy signal.
Fundamentals remain strong. It support at its 200 DMA line during the consolidations in recent months. It was last shown in this FSU section on 12/19/18 with an annotated graph under the headline, "Slumped Badly After Challenging Prior High".
The high-ranked Medical-Research Eqp/Svc firm reported earnings +68% on +62% sales revenues for the Sep '18 quarter marking the 3rd consecutive comparison above the +25% minimum earnings guideline (C criteria). Its annual earnings (A criteria) history has been strong and it has a 96 Earnings Per Share Rating, putting it in the top 5% of all publicly traded companies.
The number of top-rated funds owning its shares rose from 188 in Dec '17 to 424 in Dec '18, a reassuring sign concerning the I criteria. Its current Up/Down Volume Ratio of 1.3 is an unbiased indication its shares have been under slight accumulation over the past 50 days. It has earned a Timeliness Rating of A and Sponsorship rating of B. Proposed yet another Secondary Offering on 8/07/18. Completed Secondary Offerings on 6/12/18, 5/04/18, and 12/01/17.
Charts courtesy of www.stockcharts.com
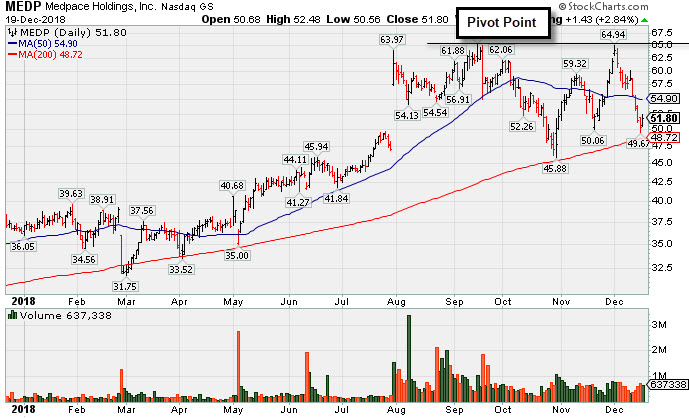
Slumped Badly After Challenging Prior High - Wednesday, December 19, 2018
Medpace Holdings Inc (MEDP +$1.43 or +2.84% to $51.80) recently slumped below its 50-day moving average (DMA) line ($54.90) with damaging losses triggering a technical sell signal and raising concerns. The 200 DMA line and prior low define the next support to watch. It will be dropped from the Featured Stocks list tonight. A rebound above the 50 DMA line is needed for its outlook to improve.
MEDP was highlighted in yellow with pivot point cited based on its 9/17/18 high plus 10 cents in the 12/03/18 mid-day report (read here). However, disciplined investors will note that it failed to produce the subsequent gains above the pivot point backed by a least +40% above average volume which were needed to trigger a technical buy signal. It was last shown in this FSU section on 12/04/18 with an annotated graph under the headline, "Pullback After 9 Straight Gains Challenged High".
The high-ranked Medical-Research Eqp/Svc firm reported earnings +68% on +62% sales revenues for the Sep '18 quarter marking the 3rd consecutive comparison above the +25% minimum earnings guideline (C criteria). Its annual earnings (A criteria) history has been strong and it has a 96 Earnings Per Share Rating, putting it in the top 5% of all publicly traded companies.
The number of top-rated funds owning its shares rose from 188 in Dec '17 to 382 in Sep '18, a reassuring sign concerning the I criteria. Its current Up/Down Volume Ratio of 1.1 is an unbiased indication its shares have been under slight accumulation over the past 50 days. It has earned a Timeliness Rating of A and Sponsorship rating of B. It support at its 200 DMA line during the consolidation since last noted in the 9/19/18 -"Proposed yet another Secondary Offering on 8/07/18. Completed Secondary Offerings on 6/12/18, 5/04/18, and 12/01/17. "
Charts courtesy of www.stockcharts.com
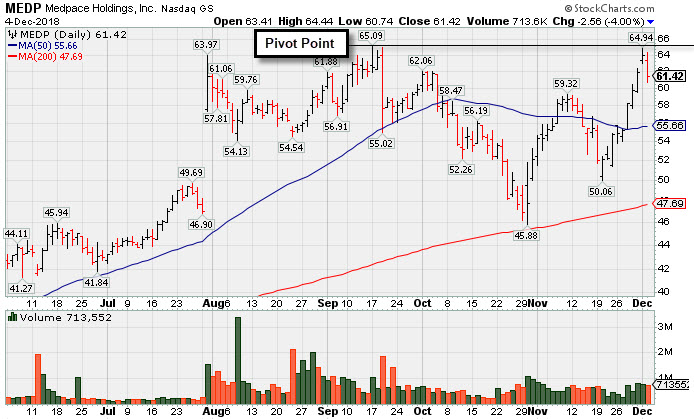
Pullback After 9 Straight Gains Challenged High - Tuesday, December 4, 2018
Medpace Holdings Inc (MEDP) was highlighted in yellow with pivot point cited based on its 9/17/18 high plus 10 cents in the 12/03/18 mid-day report (read here) . Subsequent gains above the pivot point backed by a least +40% above average volume may trigger a technical buy signal. Challenging its all-time high with today's 9th consecutive gain.
The high-ranked Medical-Research Eqp/Svc firm reported earnings +68% on +62% sales revenues for the Sep '18 quarter marking the 3rd consecutive comparison above the +25% minimum earnings guideline (C criteria). Its annual earnings (A criteria) history has been strong and it has a 96 Earnings Per Share Rating, putting it in the top 5% of all publicly traded companies.
The number of top-rated funds owning its shares rose from 188 in Dec '17 to 369 in Sep '18, a reassuring sign concerning the I criteria. Its current Up/Down Volume Ratio of 1.9 is an unbiased indication its shares have been under accumulation over the past 50 days. It has earned a Timeliness Rating of A and Sponsorship rating of B. It support at its 200 DMA line during the consolidation since last noted in the 9/19/18 - "Proposed yet another Secondary Offering on 8/07/18. Completed Secondary Offerings on 6/12/18, 5/04/18, and 12/01/17. "
Charts courtesy of www.stockcharts.com