You are not logged in.
This means you
CAN ONLY VIEW reports that were published prior to Monday, April 14, 2025.
You
MUST UPGRADE YOUR MEMBERSHIP if you want to see any current reports.
AFTER MARKET UPDATE - FRIDAY, JULY 29TH, 2011
Previous After Market Report Next After Market Report >>>
|
|
|
|
DOW |
-96.87 |
12,143.24 |
-0.79% |
|
Volume |
1,209,504,110 |
+23% |
|
Volume |
2,221,315,800 |
+10% |
|
NASDAQ |
-9.87 |
2,756.38 |
-0.36% |
|
Advancers |
993 |
32% |
|
Advancers |
1,087 |
40% |
|
S&P 500 |
-8.39 |
1,292.28 |
-0.65% |
|
Decliners |
2,024 |
65% |
|
Decliners |
1,486 |
55% |
|
Russell 2000 |
-2.31 |
797.03 |
-0.29% |
|
52 Wk Highs |
16 |
|
|
52 Wk Highs |
26 |
|
|
S&P 600 |
-0.18 |
430.16 |
-0.04% |
|
52 Wk Lows |
177 |
|
|
52 Wk Lows |
116 |
|
|
 |
Major Averages Lower for Third Straight Monthly Losses
Kenneth J. Gruneisen - Passed the CAN SLIM® Master's Exam
The Dow recovered from an early 156 point loss as it and the other major indices traded into positive territory before noon on Friday. Buying demand was lacking, however, and the market slumped amid growing uncertainty throughout the remainder of the session. Friday's volume totals were reported higher than the prior session totals on the NYSE and on the Nasdaq exchange, a clear sign that the institutional crowd was adding more worrisome distributional pressure. New 52-week lows trounced new 52-week highs on the NYSE and on the Nasdaq exchange. Declining issues led advancers by 2-1 on the NYSE and by a smaller 3-2 margin on the Nasdaq exchange. There were 12 high-ranked companies from the CANSLIM.net Leaders List that made new 52-week highs and appeared on the CANSLIM.net BreakOuts Page, up from the prior total of 10 stocks. There were 9 gainers out of the 20 high-ranked leaders currently included on the Featured Stocks Page.
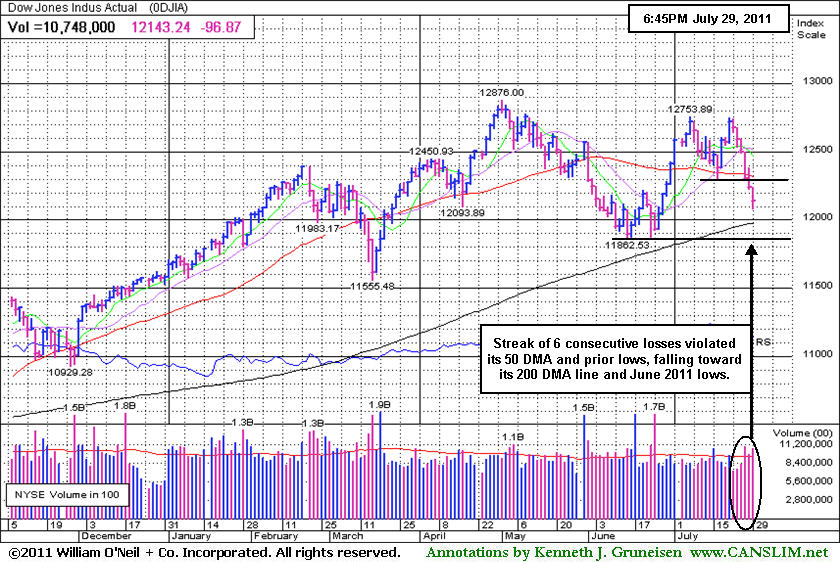
For the week, the Dow lost -4.2%, the S&P 500 lost -3.9%, and the Nasdaq Composite fell -3.5%. July completed a 3-month losing streak for the S&P 500 Index, Dow Jones Industrial Average, and Nasdaq Composite Index.
President Obama said Republicans and Democrats were in "rough agreement," and late Friday evening the House of Representatives approved an important bill authored by House Speaker John Boehner. Meanwhile, Congress still has not reached a debt limit agreement, and the country edged ever-closer to default.
Weak economic data weighed on the markets. The nation's second quarter gross domestic product grew less than expected, and consumer spending climbed only 0.1%, a sign of retrenchment. The government also said that the recession from 2007 to 2009 was deeper than previously estimated. Reports on consumer sentiment and factory activity were also disappointments.
Dow component Merck & Co Inc (MRK -2.29%) announced plans to cut its workforce another 12% to 13% by 2015. On the plus side, Genworth Financial Inc (GNW +6.39%) rallied as the chief executive considered splitting the company. Newmont Mining Corp (NEM -3.67%) fell after reporting second-quarter profits that trailed analysts' estimates as mining costs increased.
The S&P 500 Index and Dow Jones Industrial Average both are again retreating below their respective downward sloping 50-day moving average (DMA) lines. The S&P 500 Index is perched -5.7% off its 2011 high, but a simple loss of only -0.6% from its present level could lead to its first close below its longer-term 200 DMA line since September 10, 2010.
Concerns have been raised by increasing pressure on stocks as indicated by the major averages (M criteria), and with the conclusion being that the prior rally effort has ended and this is another "market correction" which leaves investors watching for a new rally confirmed by a solid follow-through day. Distribution days have been adding up in recent weeks, indicating problems. Financial stocks, considered very important leading indicators, also are continuing to struggle.
The August 2011 issue of CANSLIM.net News will be published soon! Links to all prior reports are available on the Premium Member Homepage.
PICTURED: The Dow Jones Industrial Average extended its losing streak to six sessions, leaving it -5.7% off its 2011 high.
|
 Kenneth J. Gruneisen started out as a licensed stockbroker in August 1987, a couple of months prior to the historic stock market crash that took the Dow Jones Industrial Average down -22.6% in a single day. He has published daily fact-based fundamental and technical analysis on high-ranked stocks online for two decades. Through FACTBASEDINVESTING.COM, Kenneth provides educational articles, news, market commentary, and other information regarding proven investment systems that work in good times and bad.
Comments contained in the body of this report are technical opinions only and are not necessarily those of Gruneisen Growth Corp. The material herein has been obtained from sources believed to be reliable and accurate, however, its accuracy and completeness cannot be guaranteed. Our firm, employees, and customers may effect transactions, including transactions contrary to any recommendation herein, or have positions in the securities mentioned herein or options with respect thereto. Any recommendation contained in this report may not be suitable for all investors and it is not to be deemed an offer or solicitation on our part with respect to the purchase or sale of any securities. |
|
 |
Defensive, Tech, Financial Groups Weak
Kenneth J. Gruneisen - Passed the CAN SLIM® Master's Exam
The Healthcare Index ($HMO -4.75%) was a standout decliner on Friday, and the Gold & Silver Index ($XAU -2.06%) also lost ground, making it a tough day for investors with defensive positions. The Networking Index ($NWX -1.20%) continued to slump and the Semiconductor Index ($SOX -0.92%) and Internet Index ($IIX -0.72%) also finished with losses. Energy-related shares showed weakness as the Integrated Oil Index ($XOI -0.96%) and Oil Services Index ($OSX -0.47%) fell. The Bank Index ($BKX -0.41%) suffered a 6th consecutive loss while the Broker/Dealer Index ($XBD +0.08%) and Retail Index ($RLX +0.14%) fought to finish slightly above unchanged for the day.
Charts courtesy www.stockcharts.com
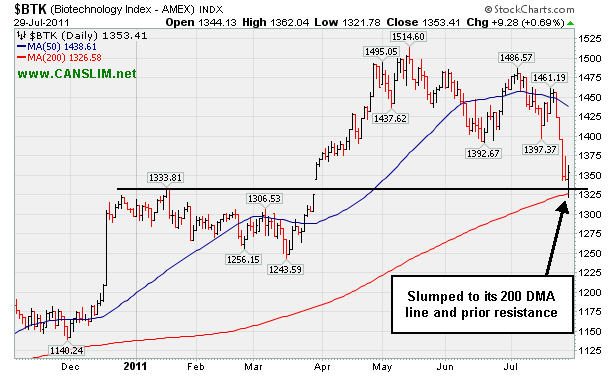
PICTURED: The Biotechnology Index ($BTK +0.69%) was a standout gainer on Friday as it tested support at its 200-day moving average (DMA) line coinciding with prior resistance.
| Oil Services |
$OSX |
273.55 |
-1.29 |
-0.47% |
+11.60% |
| Healthcare |
$HMO |
2,170.87 |
-108.33 |
-4.75% |
+28.30% |
| Integrated Oil |
$XOI |
1,284.51 |
-12.42 |
-0.96% |
+5.88% |
| Semiconductor |
$SOX |
386.94 |
-3.59 |
-0.92% |
-6.04% |
| Networking |
$NWX |
261.09 |
-3.17 |
-1.20% |
-6.94% |
| Internet |
$IIX |
305.41 |
-2.21 |
-0.72% |
-0.75% |
| Broker/Dealer |
$XBD |
105.45 |
+0.08 |
+0.08% |
-13.22% |
| Retail |
$RLX |
539.16 |
+0.78 |
+0.14% |
+6.05% |
| Gold & Silver |
$XAU |
205.81 |
-4.33 |
-2.06% |
-9.17% |
| Bank |
$BKX |
46.01 |
-0.19 |
-0.41% |
-11.88% |
| Biotech |
$BTK |
1,353.41 |
+9.28 |
+0.69% |
+4.30% |
|
|
|
 |
Potential Candidate in Tight Consolidation After Cup
Kenneth J. Gruneisen - Passed the CAN SLIM® Master's Exam
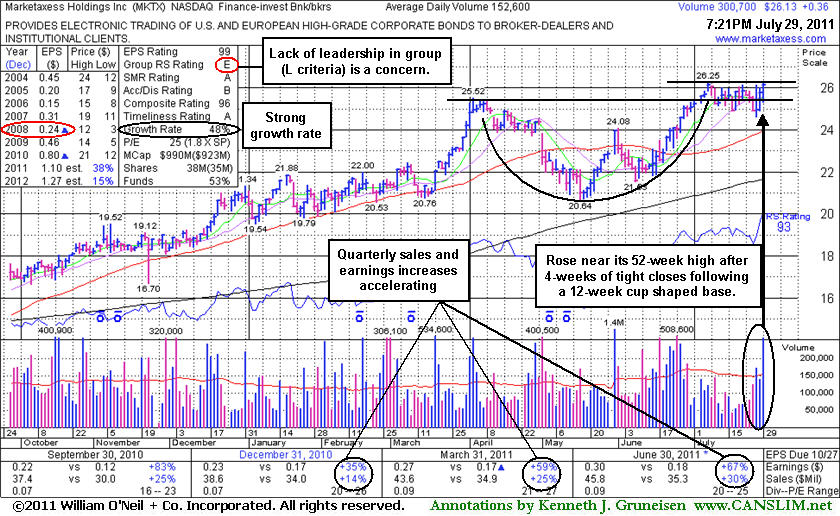
Marketaxess Holdings Inc (MKTX +$0.36 or +1.40% to $26.13) was featured in yellow in the mid-day report today. It has been consolidating in a tight range for the past 4 weeks perched near its 52-week high while no overhead supply is there to hinder its progress. Prior to that it formed a 12-week cup shaped base. Reported earnings +67% on +30% sales revenues for the latest quarter ended June 30, 2011 versus the year ago period. It has earned high ranks and reasonably satisfies the guidelines concerning quarterly and annual earnings (C and A criteria), however a downturn in FY '08 (see red oval) is a noted flaw. Additionally, the Finance - Investment Bankers industry group currently has a Relative Strength rating of E (see red circle) 6 which indicates the group has been a poor performer rather than a strong leader (L criteria). The M criteria has also been arguing against new buying efforts.
The number of top-rated funds owning its shares rose from 195 in Dec '10 to 232 in Jun '11, a reassuring sign concerning the I criteria. Fresh proof of heavy buying demand would be no guarantee it can mount a sustained rally for meaningful gains, but for now this high-ranked leader is an ideal candidate for disciplined investors' watchlists.
|
|
|
Color Codes Explained :
Y - Better candidates highlighted by our
staff of experts.
G - Previously featured
in past reports as yellow but may no longer be buyable under the
guidelines.
***Last / Change / Volume data in this table is the closing quote data***
Symbol/Exchange
Company Name
Industry Group |
PRICE |
CHANGE
(%Change) |
Day High |
Volume
(% DAV)
(% 50 day avg vol) |
52 Wk Hi
% From Hi |
Featured
Date |
Price
Featured |
Pivot Featured |
|
Max Buy |
ATHN
-
NASDAQ
Athenahealth Inc
DIVERSIFIED SERVICES - Business/Management Services
|
$58.79
|
-0.92
-1.54% |
$60.11
|
803,216
169.88% of 50 DAV
50 DAV is 472,800
|
$60.29
-2.49%
|
7/22/2011
|
$57.30
|
PP = $50.66
|
|
MB = $53.19
|
Most Recent Note - 7/28/2011 6:03:38 PM
G - Gain today with above average volume for a new all-time high close. Extended from prior highs in the $50 area that define support after its 7/22/11 breakaway gap. See the latest FSU analysis for more details and an annotated graph.
>>> The latest Featured Stock Update with an annotated graph appeared on 7/27/2011. Click here.
View all notes |
Alert me of new notes |
CANSLIM.net Company Profile |
SEC |
Zacks Reports |
StockTalk |
News |
Chart |
Request a new note
C
A N
S L
I M


|
BIDU
-
NASDAQ
Baidu Inc Ads
INTERNET - Internet Information Providers
|
$157.07
|
-1.27
-0.80% |
$157.90
|
9,803,772
109.86% of 50 DAV
50 DAV is 8,923,700
|
$165.96
-5.36%
|
7/26/2011
|
$164.32
|
PP = $156.14
|
|
MB = $163.95
|
 Most Recent Note - 7/29/2011 12:17:21 PM
Y - Dipped under its pivot point while pulling back today for a 3rd consecutive loss. No resistance remains due to overhead supply after the "breakaway gap" triggered a technical buy signal. Weak market (M criteria) environment is currently a concern, since 3 out of 4 stocks tend to go in the direction of the major averages.
>>> The latest Featured Stock Update with an annotated graph appeared on 7/28/2011. Click here.
View all notes |
Alert me of new notes |
CANSLIM.net Company Profile |
SEC |
Zacks Reports |
StockTalk |
News |
Chart |
Request a new note
C
A N
S L
I M
|
CACC
-
NASDAQ
Credit Acceptance Corp
FINANCIAL SERVICES - Credit Services
|
$79.31
|
-0.31
-0.39% |
$80.04
|
37,217
102.53% of 50 DAV
50 DAV is 36,300
|
$86.87
-8.70%
|
6/2/2011
|
$76.10
|
PP = $82.39
|
|
MB = $86.51
|
Most Recent Note - 7/28/2011 5:58:52 PM
G - Today's gap up gain on lighter volume snapped a streak of 4 consecutive losses as it rallied to a close near its 50 DMA line. A prompt rebound above its short-term average is needed for its outlook to improve. The next support level is prior chart lows in the $75 area. Due to report earnings results on Monday, August 1st.
>>> The latest Featured Stock Update with an annotated graph appeared on 6/27/2011. Click here.
View all notes |
Alert me of new notes |
CANSLIM.net Company Profile |
SEC |
Zacks Reports |
StockTalk |
News |
Chart |
Request a new note
C
A N
S L
I M
|
CMG
-
NYSE
Chipotle Mexican Grill
LEISURE - Restaurants
|
$324.58
|
+0.42
0.13% |
$327.57
|
784,300
99.17% of 50 DAV
50 DAV is 790,900
|
$337.32
-3.78%
|
4/1/2011
|
$274.00
|
PP = $275.10
|
|
MB = $288.86
|
Most Recent Note - 7/26/2011 4:47:45 PM
G - Quietly hovering at all-time highs this week, extended from any sound base pattern. Reported earnings per share +12% on +22% sales revenues for the quarter ended June 30, 2011 versus the year ago period. Fundamentals have raised concern with its 2nd consecutive quarterly comparison with earnings below the +25% guideline.
>>> The latest Featured Stock Update with an annotated graph appeared on 7/8/2011. Click here.
View all notes |
Alert me of new notes |
CANSLIM.net Company Profile |
SEC |
Zacks Reports |
StockTalk |
News |
Chart |
Request a new note
C
A N
S L
I M
|
EZPW
-
NASDAQ
Ezcorp Inc Cl A
SPECIALTY RETAIL - Specialty Retail, Other
|
$33.28
|
+0.90
2.78% |
$33.54
|
628,146
126.44% of 50 DAV
50 DAV is 496,800
|
$38.66
-13.92%
|
6/13/2011
|
$31.18
|
PP = $33.41
|
|
MB = $35.08
|
Most Recent Note - 7/29/2011 7:53:30 PM
G - Rebounded near its 50 DMA line today as a second consecutive gain with above average volume indicated it was finding support near prior highs in the $33 area.
>>> The latest Featured Stock Update with an annotated graph appeared on 7/5/2011. Click here.
View all notes |
Alert me of new notes |
CANSLIM.net Company Profile |
SEC |
Zacks Reports |
StockTalk |
News |
Chart |
Request a new note
C
A N
S L
I M
|
Symbol/Exchange
Company Name
Industry Group |
PRICE |
CHANGE
(%Change) |
Day High |
Volume
(% DAV)
(% 50 day avg vol) |
52 Wk Hi
% From Hi |
Featured
Date |
Price
Featured |
Pivot Featured |
|
Max Buy |
FCFS
-
NASDAQ
First Cash Financial Svs
SPECIALTY RETAIL - Specialty Retail, Other
|
$43.27
|
+0.61
1.43% |
$43.59
|
186,659
91.10% of 50 DAV
50 DAV is 204,900
|
$44.84
-3.50%
|
5/31/2011
|
$42.00
|
PP = $40.23
|
|
MB = $42.24
|
Most Recent Note - 7/28/2011 6:01:02 PM
G - Consolidating just -4.9% off its 52-week high. Recent chart lows and its 50 DMA line define important near-term support to watch in the $41 area.
>>> The latest Featured Stock Update with an annotated graph appeared on 7/18/2011. Click here.
View all notes |
Alert me of new notes |
CANSLIM.net Company Profile |
SEC |
Zacks Reports |
StockTalk |
News |
Chart |
Request a new note
C
A N
S L
I M
|
FOSL
-
NASDAQ
Fossil Inc
CONSUMER DURABLES - Recreational Goods, Other
|
$125.67
|
-1.06
-0.84% |
$127.20
|
1,135,349
163.24% of 50 DAV
50 DAV is 695,500
|
$134.98
-6.90%
|
2/1/2011
|
$73.30
|
PP = $74.44
|
|
MB = $78.16
|
Most Recent Note - 7/29/2011 1:00:54 PM
G - Could produce more climactic gains, but it is retreating from all-time highs and repeatedly has been noted as extended from its 50 DMA line and prior highs in the $107 area that define support.
>>> The latest Featured Stock Update with an annotated graph appeared on 7/21/2011. Click here.
View all notes |
Alert me of new notes |
CANSLIM.net Company Profile |
SEC |
Zacks Reports |
StockTalk |
News |
Chart |
Request a new note
C
A N
S L
I M
|
HS
-
NYSE
Healthspring Inc
HEALTH SERVICES - Health Care Plans
|
$41.04
|
-0.76
-1.82% |
$41.36
|
2,018,336
247.56% of 50 DAV
50 DAV is 815,300
|
$48.95
-16.16%
|
6/16/2011
|
$42.44
|
PP = $45.21
|
|
MB = $47.47
|
Most Recent Note - 7/29/2011 10:02:55 AM
Gapped down today, slumping under its May-June lows and raising more serious concerns after triggering technical sell signals. Based on damaging weakness it will be dropped from the Featured Stocks list tonight. Due to report earnings on the morning of Tuesday, August 2nd for the latest quarter ended June 30, 2011.
>>> The latest Featured Stock Update with an annotated graph appeared on 7/11/2011. Click here.
View all notes |
Alert me of new notes |
CANSLIM.net Company Profile |
SEC |
Zacks Reports |
StockTalk |
News |
Chart |
Request a new note
C
A N
S L
I M
|
IPCM
-
NASDAQ
I P C The Hospitalist Co
HEALTH SERVICES - Hospitals
|
$45.18
|
-3.80
-7.75% |
$46.06
|
1,027,852
1,109.99% of 50 DAV
50 DAV is 92,600
|
$52.25
-13.53%
|
7/25/2011
|
$51.40
|
PP = $52.35
|
|
MB = $54.97
|
Most Recent Note - 7/29/2011 10:09:07 AM
G - Gapped down today, violating its 50 DMA line and prior chart lows triggering techincal sell signals. Color code is changed to green based on its weaker fundamentals and technical damage. Reported earnings +18% on +27% sales revenues for the quarter ended June 30, 2011 versus the year ago period. That marked its weakest earnings increase in the span of at least 8 quarterly comparisons, raising concerns.
>>> The latest Featured Stock Update with an annotated graph appeared on 7/25/2011. Click here.
View all notes |
Alert me of new notes |
CANSLIM.net Company Profile |
SEC |
Zacks Reports |
StockTalk |
News |
Chart |
Request a new note
C
A N
S L
I M
|
LULU
-
NASDAQ
Lululemon Athletica
MANUFACTURING - Textile Manufacturing
|
$60.54
|
-1.14
-1.85% |
$61.21
|
2,230,955
53.93% of 50 DAV
50 DAV is 4,136,600
|
$64.49
-6.12%
|
6/21/2011
|
$102.95
|
PP = $101.14
|
|
MB = $106.20
|
Most Recent Note - 7/27/2011 5:40:22 PM
G - Still hovering near its all-time high with volume totals generally cooling, very extended from a sound base. Its 50 DMA line and prior resistance define support in the $51-52 area. A 2:1 split effective 7/12/11 impacted prices (prior Featured Price, Pivot Point, and Max Buy levels will soon be adjusted).
>>> The latest Featured Stock Update with an annotated graph appeared on 7/15/2011. Click here.
View all notes |
Alert me of new notes |
CANSLIM.net Company Profile |
SEC |
Zacks Reports |
StockTalk |
News |
Chart |
Request a new note
C
A N
S L
I M
|
Symbol/Exchange
Company Name
Industry Group |
PRICE |
CHANGE
(%Change) |
Day High |
Volume
(% DAV)
(% 50 day avg vol) |
52 Wk Hi
% From Hi |
Featured
Date |
Price
Featured |
Pivot Featured |
|
Max Buy |
MKTX
-
NASDAQ
Marketaxess Holdings Inc
FINANCIAL SERVICES - Investment Brokerage - Nationa
|
$26.13
|
+0.36
1.40% |
$26.20
|
301,077
197.30% of 50 DAV
50 DAV is 152,600
|
$26.25
-0.46%
|
7/29/2011
|
$25.87
|
PP = $26.35
|
|
MB = $27.67
|
Most Recent Note - 7/29/2011 7:51:09 PM
Y - Finished the session 2 cents off its best ever close. Consolidating in a tight range for the past 4 weeks perched near its 52-week high while no overhead supply is there to hinder its progress. Reported earnings +67% on +30% sales revenues for the latest quarter ended June 30, 2011 versus the year ago period. It has earned high ranks and reasonably satisfies the guidelines concerning quarterly and annual earnings (C and A criteria). Featured in the mid-day report today, its color code was changed to yellow with pivot point cited based on its 52-week high plus 10 cents. The Finance - Investment Bankers industry group currently has a Relative Strength rating of 6 which indicates the group has been a poor performer rather than a strong leader (L criteria). The M criteria has also been arguing against new buying efforts. See the latest FSU analysis for more details and an annotated graph.
>>> The latest Featured Stock Update with an annotated graph appeared on 7/29/2011. Click here.
View all notes |
Alert me of new notes |
CANSLIM.net Company Profile |
SEC |
Zacks Reports |
StockTalk |
News |
Chart |
Request a new note
C
A N
S L
I M
|
MWIV
-
NASDAQ
M W I Veterinary Supply
HEALTH SERVICES - Medical Instruments and; Supplies
|
$89.06
|
+3.71
4.35% |
$89.49
|
80,737
126.35% of 50 DAV
50 DAV is 63,900
|
$86.99
2.38%
|
7/11/2011
|
$83.39
|
PP = $84.67
|
|
MB = $88.90
|
Most Recent Note - 7/29/2011 6:43:54 PM
G - Its gain today was backed by only +26% above average volume, below the threshold to trigger a proper technical buy signal. Reported earnings +23% on +18% sales revenues for the quarter ended June 30, 2011 versus the year ago period. That marks the weakest sales and earnings increases in the span of 6 quarterly comparisons, raising concerns. The sub par earnings increase (below the +25% guideline) coupled with broader market (M criteria) weakness may give investors reasons to avoid new buying efforts.
>>> The latest Featured Stock Update with an annotated graph appeared on 6/30/2011. Click here.
View all notes |
Alert me of new notes |
CANSLIM.net Company Profile |
SEC |
Zacks Reports |
StockTalk |
News |
Chart |
Request a new note
C
A N
S L
I M
|
OTEX
-
NASDAQ
Open Text Corp
INTERNET - Internet Software and Services
|
$67.56
|
-0.66
-0.97% |
$69.00
|
198,688
70.56% of 50 DAV
50 DAV is 281,600
|
$72.32
-6.58%
|
6/1/2011
|
$65.86
|
PP = $67.18
|
|
MB = $70.54
|
Most Recent Note - 7/27/2011 5:43:06 PM
Y - Still stubbornly holding its ground above its pivot point yet below its "max buy" level. It stalled after its 7/13/11 technical buy signal, with volume totals cooling since its negative reversal at its all-time high. Prior resistance near $66 defines important chart support to watch above its 50 DMA line.
>>> The latest Featured Stock Update with an annotated graph appeared on 7/20/2011. Click here.
View all notes |
Alert me of new notes |
CANSLIM.net Company Profile |
SEC |
Zacks Reports |
StockTalk |
News |
Chart |
Request a new note
C
A N
S L
I M
|
PCLN
-
NASDAQ
Priceline.Com Inc
INTERNET - Internet Software and Services
|
$537.65
|
+15.36
2.94% |
$542.87
|
1,358,903
143.40% of 50 DAV
50 DAV is 947,600
|
$561.88
-4.31%
|
7/29/2011
|
$539.46
|
PP = $552.15
|
|
MB = $579.76
|
Most Recent Note - 7/29/2011 1:46:15 PM
Y - Perched within close striking distance of its 52-week high. Color code is changed to yellow with pivot point cited based on its 7/08/11 high. Due to report earnings on August 3rd. Stellar earnings history satisfies the C and A criteria. Found support well above its 200 DMA line during its consolidation since dropped from the Featured Stocks list on 6/15/11. A subsequent breakout could trigger a technical buy signal, but keep in mind that the M criteria may override all other promising criteria, since 3 out of 4 stocks follow the direction of the major averages.
>>> The latest Featured Stock Update with an annotated graph appeared on 5/19/2011. Click here.
View all notes |
Alert me of new notes |
CANSLIM.net Company Profile |
SEC |
Zacks Reports |
StockTalk |
News |
Chart |
Request a new note
C
A N
S L
I M
|
PRGO
-
NASDAQ
Perrigo Co
DRUGS - Drug Related Products
|
$90.31
|
-0.64
-0.70% |
$91.80
|
411,657
93.20% of 50 DAV
50 DAV is 441,700
|
$94.61
-4.54%
|
7/13/2011
|
$92.89
|
PP = $92.40
|
|
MB = $97.02
|
Most Recent Note - 7/27/2011 5:45:43 PM
Y - A loss today with average volume led to a slump back just under its pivot point, raising concerns. A gain with sufficient volume did not recently confirm a proper technical buy signal. This riskier late-stage setup stalled after rallying to a new 52-week high. Some may have considered its 7/13/11 gain a technical breakout from a cup shaped base without a handle, but its close in the middle of the day's range left it short of its pivot point.
>>> The latest Featured Stock Update with an annotated graph appeared on 7/13/2011. Click here.
View all notes |
Alert me of new notes |
CANSLIM.net Company Profile |
SEC |
Zacks Reports |
StockTalk |
News |
Chart |
Request a new note
C
A N
S L
I M
|
Symbol/Exchange
Company Name
Industry Group |
PRICE |
CHANGE
(%Change) |
Day High |
Volume
(% DAV)
(% 50 day avg vol) |
52 Wk Hi
% From Hi |
Featured
Date |
Price
Featured |
Pivot Featured |
|
Max Buy |
PSMT
-
NASDAQ
Pricesmart Inc
RETAIL - Drug Stores
|
$58.52
|
+1.29
2.25% |
$58.60
|
181,401
78.70% of 50 DAV
50 DAV is 230,500
|
$62.27
-6.02%
|
7/22/2011
|
$60.04
|
PP = $61.14
|
|
MB = $64.20
|
Most Recent Note - 7/29/2011 7:55:32 PM
Y - Closed near the session high today with a small gain after a positive reversal on lighter than average volume. A negative bias in the broader market (M criteria) hurts the near-term outlook. It did not trigger a proper buy signal since recently featured.
>>> The latest Featured Stock Update with an annotated graph appeared on 7/22/2011. Click here.
View all notes |
Alert me of new notes |
CANSLIM.net Company Profile |
SEC |
Zacks Reports |
StockTalk |
News |
Chart |
Request a new note
C
A N
S L
I M
|
QSII
-
NASDAQ
Quality Systems Inc
COMPUTER SOFTWARE and SERVICES - Healthcare Information Service
|
$91.36
|
+1.49
1.66% |
$91.45
|
453,740
186.34% of 50 DAV
50 DAV is 243,500
|
$92.38
-1.10%
|
7/6/2011
|
$91.26
|
PP = $91.67
|
|
MB = $96.25
|
Most Recent Note - 7/29/2011 1:49:28 PM
Y - Consolidating above its 50 DMA line perched within close striking distance of its all-time high. Reported earnings +55% on +21% sales revenues for the quarter ended June 30, 2011 versus the year ago period. Color code was changed to yellow based on its fundamental and technical strength, however no new pivot point was cited. Volume-driven gains for new highs would be a technical buy signal.
>>> The latest Featured Stock Update with an annotated graph appeared on 7/6/2011. Click here.
View all notes |
Alert me of new notes |
CANSLIM.net Company Profile |
SEC |
Zacks Reports |
StockTalk |
News |
Chart |
Request a new note
C
A N
S L
I M
|
UA
-
NYSE
Under Armour Inc Cl A
CONSUMER NON-DURABLES - Textile - Apparel Clothing
|
$73.41
|
-1.09
-1.46% |
$74.79
|
1,223,283
93.60% of 50 DAV
50 DAV is 1,306,900
|
$82.95
-11.50%
|
7/19/2011
|
$81.33
|
PP = $81.52
|
|
MB = $85.60
|
Most Recent Note - 7/28/2011 11:03:22 AM
G - Rebounding from its 50 DMA line today following a damaging streak of 6 consecutive losses. Technically, the pullback has been more than -50% of the depth of its cup and marked by heavy volume, so the latest consolidation cannot be considered a "handle" forming. UA did not confirm a proper technical buy signal since recently featured in yellow. Reported earnings +71% on +42% sales revenues for the quarter ended June 30, 2011 versus the year ago period, showing impressive acceleration in sales and earnings increases, sequentially. See latest FSU analysis for more details and a new annotated graph.
>>> The latest Featured Stock Update with an annotated graph appeared on 7/26/2011. Click here.
View all notes |
Alert me of new notes |
CANSLIM.net Company Profile |
SEC |
Zacks Reports |
StockTalk |
News |
Chart |
Request a new note
C
A N
S L
I M
|
ULTA
-
NASDAQ
Ulta Salon Cosm & Frag
SPECIALTY RETAIL - Specialty Retail, Other
|
$63.03
|
+0.25
0.40% |
$63.48
|
669,101
72.55% of 50 DAV
50 DAV is 922,300
|
$68.80
-8.39%
|
1/6/2011
|
$36.12
|
PP = $37.34
|
|
MB = $39.21
|
Most Recent Note - 7/27/2011 5:23:45 PM
G - Volume picked up but was still below average behind today's loss while it slumped under prior lows toward its 50 DMA line. It rallied +200% since first featured in yellow at $22.81 in the 3/12/10 mid-day report.
>>> The latest Featured Stock Update with an annotated graph appeared on 7/14/2011. Click here.
View all notes |
Alert me of new notes |
CANSLIM.net Company Profile |
SEC |
Zacks Reports |
StockTalk |
News |
Chart |
Request a new note
C
A N
S L
I M
|
ZAGG
-
NASDAQ
Zagg Inc
SPECIALTY RETAIL - Specialty Retail, Other
|
$15.35
|
-0.12
-0.78% |
$15.71
|
756,154
30.96% of 50 DAV
50 DAV is 2,442,400
|
$16.90
-9.17%
|
6/1/2011
|
$10.92
|
PP = $10.59
|
|
MB = $11.12
|
Most Recent Note - 7/27/2011 5:19:31 PM
G - Down today with higher (near average) volume. Extended from a sound base. No overhead supply remains to act as resistance, however its short V shaped consolidation in recent weeks is not recognized as a sound base pattern. Its 50 DMA line and recent lows define chart support.
>>> The latest Featured Stock Update with an annotated graph appeared on 7/19/2011. Click here.
View all notes |
Alert me of new notes |
CANSLIM.net Company Profile |
SEC |
Zacks Reports |
StockTalk |
News |
Chart |
Request a new note
C
A N
S L
I M
|
Symbol/Exchange
Company Name
Industry Group |
PRICE |
CHANGE
(%Change) |
Day High |
Volume
(% DAV)
(% 50 day avg vol) |
52 Wk Hi
% From Hi |
Featured
Date |
Price
Featured |
Pivot Featured |
|
Max Buy |
|
|
|
THESE ARE NOT BUY RECOMMENDATIONS!
Comments contained in the body of this report are technical
opinions only. The material herein has been obtained
from sources believed to be reliable and accurate, however,
its accuracy and completeness cannot be guaranteed.
This site is not an investment advisor, hence it does
not endorse or recommend any securities or other investments.
Any recommendation contained in this report may not
be suitable for all investors and it is not to be deemed
an offer or solicitation on our part with respect to
the purchase or sale of any securities. All trademarks,
service marks and trade names appearing in this report
are the property of their respective owners, and are
likewise used for identification purposes only.
This report is a service available
only to active Paid Premium Members.
You may opt-out of receiving report notifications
at any time. Questions or comments may be submitted
by writing to Premium Membership Services 665 S.E. 10 Street, Suite 201 Deerfield Beach, FL 33441-5634 or by calling 1-800-965-8307
or 954-785-1121.
|
|
|

