You are not logged in.
This means you
CAN ONLY VIEW reports that were published prior to Tuesday, April 15, 2025.
You
MUST UPGRADE YOUR MEMBERSHIP if you want to see any current reports.
AFTER MARKET UPDATE - THURSDAY, JULY 28TH, 2011
Previous After Market Report Next After Market Report >>>
|
|
|
|
DOW |
-62.44 |
12,240.11 |
-0.51% |
|
Volume |
983,938,550 |
-10% |
|
Volume |
2,023,816,600 |
-12% |
|
NASDAQ |
+1.46 |
2,766.25 |
+0.05% |
|
Advancers |
1,103 |
36% |
|
Advancers |
1,260 |
47% |
|
S&P 500 |
-4.22 |
1,300.67 |
-0.32% |
|
Decliners |
1,871 |
60% |
|
Decliners |
1,303 |
48% |
|
Russell 2000 |
-1.19 |
799.34 |
-0.15% |
|
52 Wk Highs |
25 |
|
|
52 Wk Highs |
18 |
|
|
S&P 600 |
-0.81 |
430.34 |
-0.19% |
|
52 Wk Lows |
107 |
|
|
52 Wk Lows |
83 |
|
|
 |
Major Averages Surrender Gains in Final Hour
Kenneth J. Gruneisen - Passed the CAN SLIM® Master's Exam
The major averages surrendered the day's gains and sank into the red in the final hour on Thursday. Volume totals were reported lighter than the prior session volume totals on the NYSE and on the Nasdaq exchange. Declining issues led advancers by 5-3 on the NYSE and by a small margin on the Nasdaq exchange. New 52-week lows solidly outnumbered new 52-week highs on the NYSE and on the Nasdaq exchange for the third consecutive session. There were 10 high-ranked companies from the CANSLIM.net Leaders List that made new 52-week highs and appeared on the CANSLIM.net BreakOuts Page, down from the prior total of 11 stocks. There were 13 gainers out of the 18 high-ranked leaders currently included on the Featured Stocks Page.
Weekly jobless claims suggested the labor market is improving. New claims dropped below 400,000 for the first week in the last sixteen. Positive economic reports diverted attention from the budget impasse, but the market remained indecisive and the major averages finished Thursday's session mixed. Early enthusiasm faded as the debt-ceiling drama continued in Washington. Lawmakers appeared no closer to a compromise despite numerous warnings of financial pain for the markets.
Contracts to purchase previously owned homes increased unexpectedly in June. Homebuilders including D.R. Horton, Inc (DHI +2.59%) rose after earnings beat estimates, and Lennar Corp (LEN +1.03%) also gained ground following the surprise increase in pending home sales. Exxon Mobil (XOM -2.22%) fell and subtracted points from the Dow after profits at the oil giant reached the highest in nearly three years, but still trailed estimates. Dupont De Nemours & Co (DD +0.04%), another Dow component, held its ground after beating expectations. Cisco Systems Inc (CSCO +2.04%) benefited from an analyst upgrade, and the gain helped keep the Nasdaq above water.
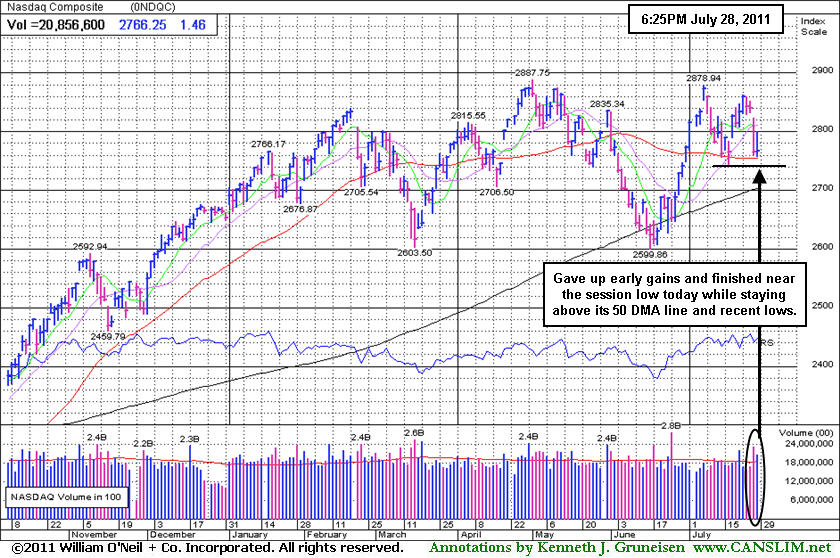
After an early gain of 82, the Dow closed down 62 points at 12,240, leaving it -4.9% off its 2011 high. The S&P 500 Index and Dow Jones Industrial Average both are again retreating below their respective downward sloping 50-day moving average (DMA) lines. The S&P 500 Index is perched -5.1% off its 2011 high, but a simple loss of greater than -1.3% from its present level could lead to its first close below its longer-term 200 DMA line since September 10, 2010.
Concerns have been raised by increasing pressure on stocks as indicated by the major averages (M criteria), and the newspaper reported it as a "market correction" again, which could leave investors watching for a new rally and follow through day. Distribution days have been adding up in recent weeks, indicating some problems for the current rally. Financial stocks, considered very important leading indicators, have also continued to struggle. Subsequent losses leading the major averages to violate their recent lows would bode poorly for the market outlook (M criteria).
PICTURED: The Nasdaq Composite Index halted its latest slide just above its 50-day moving average (DMA) line. It is perched -4.2% of its 2011 high from May 2nd, when all three of the major averages collectively topped.
|
 Kenneth J. Gruneisen started out as a licensed stockbroker in August 1987, a couple of months prior to the historic stock market crash that took the Dow Jones Industrial Average down -22.6% in a single day. He has published daily fact-based fundamental and technical analysis on high-ranked stocks online for two decades. Through FACTBASEDINVESTING.COM, Kenneth provides educational articles, news, market commentary, and other information regarding proven investment systems that work in good times and bad.
Comments contained in the body of this report are technical opinions only and are not necessarily those of Gruneisen Growth Corp. The material herein has been obtained from sources believed to be reliable and accurate, however, its accuracy and completeness cannot be guaranteed. Our firm, employees, and customers may effect transactions, including transactions contrary to any recommendation herein, or have positions in the securities mentioned herein or options with respect thereto. Any recommendation contained in this report may not be suitable for all investors and it is not to be deemed an offer or solicitation on our part with respect to the purchase or sale of any securities. |
|
 |
Mixed Action With Strength Unanimously Lacking
Kenneth J. Gruneisen - Passed the CAN SLIM® Master's Exam
The Networking Index ($NWX -2.55%) led the tech sector lower and there was a negative bias for the Internet Index ($IIX -0.78%), meanwhile the Biotechnology Index ($BTK -0.33%), Semiconductor Index ($SOX -0.15%), and the Retail Index ($RLX -0.28%) finished with smaller losses. The Broker/Dealer Index ($XBD +0.62%) posted a small gain while the Bank Index ($BKX -0.19%) inched lower. Defensive shares gave safe haven investors little to celebrate as the Gold & Silver Index ($XAU -1.04%) fell and the Healthcare Index ($HMO +0.17%) inched higher. Energy-related shares were also mixed as the Oil Services Index ($OSX +0.91%) posted a gain while the Integrated Oil Index ($XOI -0.63%) lost ground.
Charts courtesy www.stockcharts.com
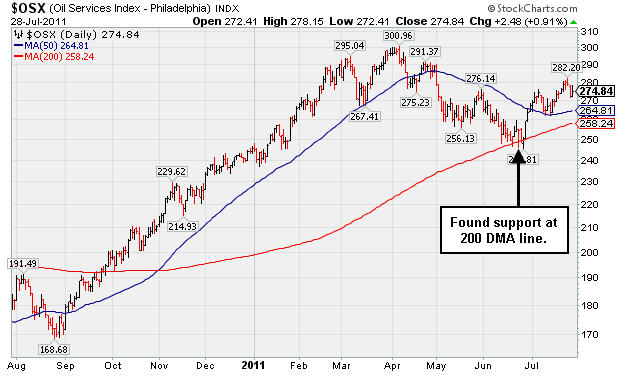
PICTURED 1: The Oil Services Index ($OSX +0.91%) found support at its 200-day moving average (DMA) line and is now about -8% off its 2011 high.
Charts courtesy www.stockcharts.com
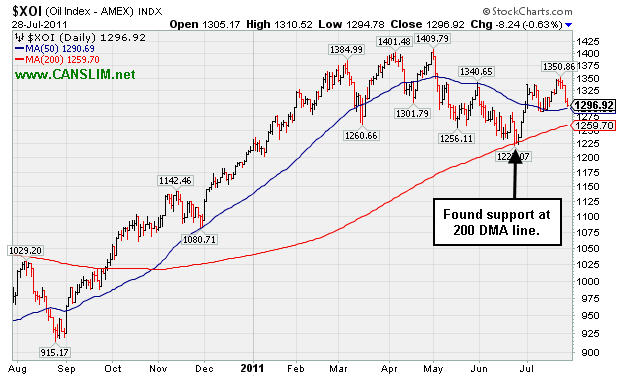
PICTURED 2: The Integrated Oil Index ($XOI -0.63%) found support at its 200-day moving average (DMA) line and is now about -8% off its 2011 high.
| Oil Services |
$OSX |
274.84 |
+2.48 |
+0.91% |
+12.12% |
| Healthcare |
$HMO |
2,279.20 |
+3.97 |
+0.17% |
+34.71% |
| Integrated Oil |
$XOI |
1,296.92 |
-8.24 |
-0.63% |
+6.90% |
| Semiconductor |
$SOX |
390.53 |
-0.60 |
-0.15% |
-5.17% |
| Networking |
$NWX |
264.26 |
-6.92 |
-2.55% |
-5.81% |
| Internet |
$IIX |
307.61 |
-2.43 |
-0.78% |
-0.04% |
| Broker/Dealer |
$XBD |
105.37 |
+0.65 |
+0.62% |
-13.28% |
| Retail |
$RLX |
538.38 |
-1.51 |
-0.28% |
+5.90% |
| Gold & Silver |
$XAU |
210.14 |
-2.21 |
-1.04% |
-7.26% |
| Bank |
$BKX |
46.20 |
-0.09 |
-0.19% |
-11.51% |
| Biotech |
$BTK |
1,344.13 |
-4.43 |
-0.33% |
+3.58% |
|
|
|
 |
Pulling Back After Gapping Up From 14-Week Cup Shaped Base
Kenneth J. Gruneisen - Passed the CAN SLIM® Master's Exam
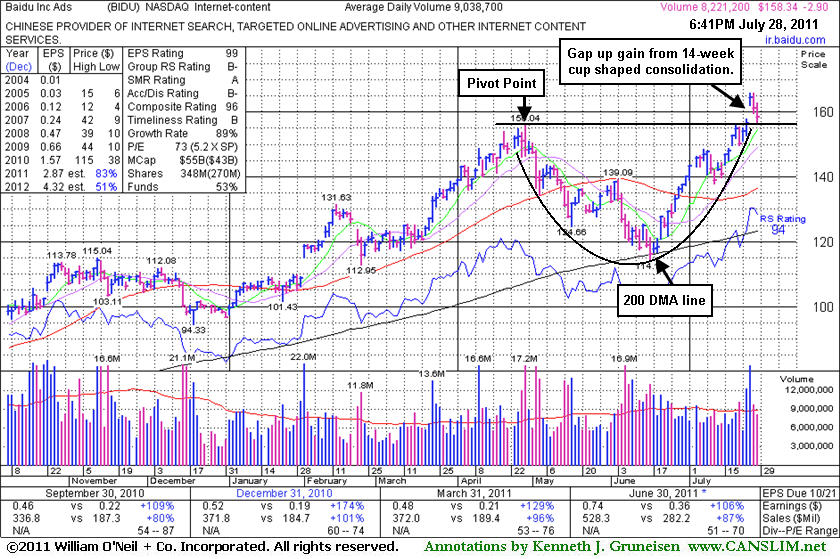
Baidu Inc. (BIDU -$2.90 or -1.80% to $158.34) has been pulling back with volume totals cooling since its 7/26/11 gap up from a 14-week cup shaped base without a handle. No resistance remains due to overhead supply after the "breakaway gap" triggered a technical buy signal. Color code was changed to yellow when featured in the 7/26/11 mid-day report (read here) with pivot point cited based on its 4/28/11 high plus 10 cents. The greatest concern may be the weak action in the broader market (M criteria) which trumps all other criteria, since 3 out of 4 stocks generally follow the direction of the major averages.
After it was last shown in this FSU section on May 9, 2011 under the headline, "Quiet Gains Following Damaging Distributional Losses", it was dropped from the Featured Stocks list on 5/13/11, then subsequently fell from $131 to $114 and tested support at its long-term 200 DMA line before rebounding impressively. It has maintained a track record of strong quarterly sales revenues and earnings increases and annual earnings (C and A criteria) history. Fundamentally, it is reassuring when its sales revenues and earnings increases have been impressive in the 4 most recent quarterly comparisons, solidly above the +25% guideline. Its latest quarter ended June 30, 2011 showed earnings +106% on +87% sales revenues versus the year ago period. Return On Equity reported at 55% also helps, as that is well above the 17% minimum guideline. The number of top-rated funds owning its shares rose from 835 in Mar '10 to to 1,116 in Jun '11, so investors have a reassuring sign concerning the I criteria.
|
|
|
Color Codes Explained :
Y - Better candidates highlighted by our
staff of experts.
G - Previously featured
in past reports as yellow but may no longer be buyable under the
guidelines.
***Last / Change / Volume data in this table is the closing quote data***
Symbol/Exchange
Company Name
Industry Group |
PRICE |
CHANGE
(%Change) |
Day High |
Volume
(% DAV)
(% 50 day avg vol) |
52 Wk Hi
% From Hi |
Featured
Date |
Price
Featured |
Pivot Featured |
|
Max Buy |
ATHN
-
NASDAQ
Athenahealth Inc
DIVERSIFIED SERVICES - Business/Management Services
|
$59.71
|
+2.14
3.72% |
$60.27
|
704,471
152.02% of 50 DAV
50 DAV is 463,400
|
$60.29
-0.96%
|
7/22/2011
|
$57.30
|
PP = $50.66
|
|
MB = $53.19
|
 Most Recent Note - 7/28/2011 6:03:38 PM
G - Gain today with above average volume for a new all-time high close. Extended from prior highs in the $50 area that define support after its 7/22/11 breakaway gap. See the latest FSU analysis for more details and an annotated graph.
>>> The latest Featured Stock Update with an annotated graph appeared on 7/27/2011. Click here.
View all notes |
Alert me of new notes |
CANSLIM.net Company Profile |
SEC |
Zacks Reports |
StockTalk |
News |
Chart |
Request a new note
C
A N
S L
I M


|
BIDU
-
NASDAQ
Baidu Inc Ads
INTERNET - Internet Information Providers
|
$158.34
|
-2.90
-1.80% |
$162.73
|
8,244,378
91.21% of 50 DAV
50 DAV is 9,038,700
|
$165.96
-4.59%
|
7/26/2011
|
$164.32
|
PP = $156.14
|
|
MB = $163.95
|
Most Recent Note - 7/28/2011 4:25:25 PM
Y - Pulling back with volume totals cooling since its 7/26/11 gap up from a 14-week cup shaped base without a handle. No resistance remains due to overhead supply after the "breakaway gap" triggered a technical buy signal. Color code was changed to yellow when featured in the 7/26/11 mid-day report (read here) with pivot point cited based on its 4/28/11 high plus 10 cents. After this high-ranked Internet - Content firm was dropped from the Featured Stocks list on 5/13/11 it subsequently fell from $131 to $114 and tested support at its long-term 200 DMA line before rebounding impressively. It has maintained a track record of strong quarterly sales revenues and earnings increases.
>>> The latest Featured Stock Update with an annotated graph appeared on 7/28/2011. Click here.
View all notes |
Alert me of new notes |
CANSLIM.net Company Profile |
SEC |
Zacks Reports |
StockTalk |
News |
Chart |
Request a new note
C
A N
S L
I M
|
CACC
-
NASDAQ
Credit Acceptance Corp
FINANCIAL SERVICES - Credit Services
|
$79.62
|
+1.50
1.92% |
$80.35
|
12,889
34.84% of 50 DAV
50 DAV is 37,000
|
$86.87
-8.35%
|
6/2/2011
|
$76.10
|
PP = $82.39
|
|
MB = $86.51
|
Most Recent Note - 7/28/2011 5:58:52 PM
G - Today's gap up gain on lighter volume snapped a streak of 4 consecutive losses as it rallied to a close near its 50 DMA line. A prompt rebound above its short-term average is needed for its outlook to improve. The next support level is prior chart lows in the $75 area. Due to report earnings results on Monday, August 1st.
>>> The latest Featured Stock Update with an annotated graph appeared on 6/27/2011. Click here.
View all notes |
Alert me of new notes |
CANSLIM.net Company Profile |
SEC |
Zacks Reports |
StockTalk |
News |
Chart |
Request a new note
C
A N
S L
I M
|
CMG
-
NYSE
Chipotle Mexican Grill
LEISURE - Restaurants
|
$324.16
|
+1.42
0.44% |
$329.00
|
525,510
66.00% of 50 DAV
50 DAV is 796,200
|
$337.32
-3.90%
|
4/1/2011
|
$274.00
|
PP = $275.10
|
|
MB = $288.86
|
Most Recent Note - 7/26/2011 4:47:45 PM
G - Quietly hovering at all-time highs this week, extended from any sound base pattern. Reported earnings per share +12% on +22% sales revenues for the quarter ended June 30, 2011 versus the year ago period. Fundamentals have raised concern with its 2nd consecutive quarterly comparison with earnings below the +25% guideline.
>>> The latest Featured Stock Update with an annotated graph appeared on 7/8/2011. Click here.
View all notes |
Alert me of new notes |
CANSLIM.net Company Profile |
SEC |
Zacks Reports |
StockTalk |
News |
Chart |
Request a new note
C
A N
S L
I M
|
EZPW
-
NASDAQ
Ezcorp Inc Cl A
SPECIALTY RETAIL - Specialty Retail, Other
|
$32.38
|
+0.26
0.81% |
$32.71
|
604,839
123.69% of 50 DAV
50 DAV is 489,000
|
$38.66
-16.24%
|
6/13/2011
|
$31.18
|
PP = $33.41
|
|
MB = $35.08
|
Most Recent Note - 7/26/2011 2:57:05 PM
G - Down again today with above average volume behind a 3rd consecutive loss. Raising concerns while slumping under its 50 DMA line and near prior highs previously noted as a support level to watch.
>>> The latest Featured Stock Update with an annotated graph appeared on 7/5/2011. Click here.
View all notes |
Alert me of new notes |
CANSLIM.net Company Profile |
SEC |
Zacks Reports |
StockTalk |
News |
Chart |
Request a new note
C
A N
S L
I M
|
Symbol/Exchange
Company Name
Industry Group |
PRICE |
CHANGE
(%Change) |
Day High |
Volume
(% DAV)
(% 50 day avg vol) |
52 Wk Hi
% From Hi |
Featured
Date |
Price
Featured |
Pivot Featured |
|
Max Buy |
FCFS
-
NASDAQ
First Cash Financial Svs
SPECIALTY RETAIL - Specialty Retail, Other
|
$42.66
|
+0.73
1.74% |
$42.95
|
242,999
120.18% of 50 DAV
50 DAV is 202,200
|
$44.84
-4.86%
|
5/31/2011
|
$42.00
|
PP = $40.23
|
|
MB = $42.24
|
Most Recent Note - 7/28/2011 6:01:02 PM
G - Consolidating just -4.9% off its 52-week high. Recent chart lows and its 50 DMA line define important near-term support to watch in the $41 area.
>>> The latest Featured Stock Update with an annotated graph appeared on 7/18/2011. Click here.
View all notes |
Alert me of new notes |
CANSLIM.net Company Profile |
SEC |
Zacks Reports |
StockTalk |
News |
Chart |
Request a new note
C
A N
S L
I M
|
FOSL
-
NASDAQ
Fossil Inc
CONSUMER DURABLES - Recreational Goods, Other
|
$126.73
|
+1.71
1.37% |
$129.80
|
571,908
81.34% of 50 DAV
50 DAV is 703,100
|
$134.98
-6.11%
|
2/1/2011
|
$73.30
|
PP = $74.44
|
|
MB = $78.16
|
Most Recent Note - 7/27/2011 5:32:33 PM
G - Pulled back today with above average volume, retreating from all-time highs. It has been repeatedly noted as very extended from its 50 DMA line and prior highs in the $107 area that define support.
>>> The latest Featured Stock Update with an annotated graph appeared on 7/21/2011. Click here.
View all notes |
Alert me of new notes |
CANSLIM.net Company Profile |
SEC |
Zacks Reports |
StockTalk |
News |
Chart |
Request a new note
C
A N
S L
I M
|
HS
-
NYSE
Healthspring Inc
HEALTH SERVICES - Health Care Plans
|
$41.80
|
-0.20
-0.48% |
$42.82
|
655,096
80.48% of 50 DAV
50 DAV is 814,000
|
$48.95
-14.61%
|
6/16/2011
|
$42.44
|
PP = $45.21
|
|
MB = $47.47
|
Most Recent Note - 7/27/2011 5:35:54 PM
G - Finished near the session low after a gap down violated its 50 DMA line, raising concerns and triggering a technical sell signal with above average volume behind today's 4th consecutive damaging loss. Color code is changed to green after slumping more than -7% below its latest pivot point. Due to report earnings on the morning of Tuesday, August 2nd for the latest quarter ended June 30, 2011.
>>> The latest Featured Stock Update with an annotated graph appeared on 7/11/2011. Click here.
View all notes |
Alert me of new notes |
CANSLIM.net Company Profile |
SEC |
Zacks Reports |
StockTalk |
News |
Chart |
Request a new note
C
A N
S L
I M
|
IPCM
-
NASDAQ
I P C The Hospitalist Co
HEALTH SERVICES - Hospitals
|
$48.98
|
-0.89
-1.78% |
$50.67
|
194,860
217.24% of 50 DAV
50 DAV is 89,700
|
$52.25
-6.26%
|
7/25/2011
|
$51.40
|
PP = $52.35
|
|
MB = $54.97
|
Most Recent Note - 7/28/2011 12:45:24 PM
Y - Holding its ground today after 3 consecutive small losses with above average volume, encountering distributional pressure while churning near its all-time high. Due to report earnings after the close today. See the latest FSU analysis for more details and an annotated graph.
>>> The latest Featured Stock Update with an annotated graph appeared on 7/25/2011. Click here.
View all notes |
Alert me of new notes |
CANSLIM.net Company Profile |
SEC |
Zacks Reports |
StockTalk |
News |
Chart |
Request a new note
C
A N
S L
I M
|
LULU
-
NASDAQ
Lululemon Athletica
MANUFACTURING - Textile Manufacturing
|
$61.68
|
+0.68
1.11% |
$63.14
|
2,380,208
57.42% of 50 DAV
50 DAV is 4,145,500
|
$64.49
-4.36%
|
6/21/2011
|
$102.95
|
PP = $101.14
|
|
MB = $106.20
|
Most Recent Note - 7/27/2011 5:40:22 PM
G - Still hovering near its all-time high with volume totals generally cooling, very extended from a sound base. Its 50 DMA line and prior resistance define support in the $51-52 area. A 2:1 split effective 7/12/11 impacted prices (prior Featured Price, Pivot Point, and Max Buy levels will soon be adjusted).
>>> The latest Featured Stock Update with an annotated graph appeared on 7/15/2011. Click here.
View all notes |
Alert me of new notes |
CANSLIM.net Company Profile |
SEC |
Zacks Reports |
StockTalk |
News |
Chart |
Request a new note
C
A N
S L
I M
|
Symbol/Exchange
Company Name
Industry Group |
PRICE |
CHANGE
(%Change) |
Day High |
Volume
(% DAV)
(% 50 day avg vol) |
52 Wk Hi
% From Hi |
Featured
Date |
Price
Featured |
Pivot Featured |
|
Max Buy |
MWIV
-
NASDAQ
M W I Veterinary Supply
HEALTH SERVICES - Medical Instruments and; Supplies
|
$85.35
|
+5.15
6.42% |
$86.69
|
118,517
189.32% of 50 DAV
50 DAV is 62,600
|
$86.99
-1.89%
|
7/11/2011
|
$83.39
|
PP = $84.67
|
|
MB = $88.90
|
Most Recent Note - 7/28/2011 1:00:59 PM
G - It is off early highs after a gap up today, promptly repairing its 50 DMA line breach and rallying to new July highs above its pivot point, challenging its 52-week and all-time highs. A volume-driven gain may trigger a technical buy signal. Reported earnings +23% on +18% sales revenues for the quarter ended June 30, 2011 versus the year ago period. That marks the weakest sales and earnings increases in the span of 6 quarterly comparisons, raising concerns. The sub par earnings increase (below the +25% guideline) coupled with broader market (M criteria) weakness may give investors reasons to avoid new buying efforts.
>>> The latest Featured Stock Update with an annotated graph appeared on 6/30/2011. Click here.
View all notes |
Alert me of new notes |
CANSLIM.net Company Profile |
SEC |
Zacks Reports |
StockTalk |
News |
Chart |
Request a new note
C
A N
S L
I M
|
OTEX
-
NASDAQ
Open Text Corp
INTERNET - Internet Software and Services
|
$68.22
|
+0.19
0.28% |
$68.86
|
166,443
58.59% of 50 DAV
50 DAV is 284,100
|
$72.32
-5.67%
|
6/1/2011
|
$65.86
|
PP = $67.18
|
|
MB = $70.54
|
Most Recent Note - 7/27/2011 5:43:06 PM
Y - Still stubbornly holding its ground above its pivot point yet below its "max buy" level. It stalled after its 7/13/11 technical buy signal, with volume totals cooling since its negative reversal at its all-time high. Prior resistance near $66 defines important chart support to watch above its 50 DMA line.
>>> The latest Featured Stock Update with an annotated graph appeared on 7/20/2011. Click here.
View all notes |
Alert me of new notes |
CANSLIM.net Company Profile |
SEC |
Zacks Reports |
StockTalk |
News |
Chart |
Request a new note
C
A N
S L
I M
|
PRGO
-
NASDAQ
Perrigo Co
DRUGS - Drug Related Products
|
$90.95
|
-0.27
-0.30% |
$92.46
|
384,305
86.81% of 50 DAV
50 DAV is 442,700
|
$94.61
-3.87%
|
7/13/2011
|
$92.89
|
PP = $92.40
|
|
MB = $97.02
|
Most Recent Note - 7/27/2011 5:45:43 PM
Y - A loss today with average volume led to a slump back just under its pivot point, raising concerns. A gain with sufficient volume did not recently confirm a proper technical buy signal. This riskier late-stage setup stalled after rallying to a new 52-week high. Some may have considered its 7/13/11 gain a technical breakout from a cup shaped base without a handle, but its close in the middle of the day's range left it short of its pivot point.
>>> The latest Featured Stock Update with an annotated graph appeared on 7/13/2011. Click here.
View all notes |
Alert me of new notes |
CANSLIM.net Company Profile |
SEC |
Zacks Reports |
StockTalk |
News |
Chart |
Request a new note
C
A N
S L
I M
|
PSMT
-
NASDAQ
Pricesmart Inc
RETAIL - Drug Stores
|
$57.23
|
-0.16
-0.28% |
$58.74
|
126,034
54.56% of 50 DAV
50 DAV is 231,000
|
$62.27
-8.09%
|
7/22/2011
|
$60.04
|
PP = $61.14
|
|
MB = $64.20
|
Most Recent Note - 7/27/2011 5:48:08 PM
Y - Concerns were raised while it was down considerably today with above average volume. Weak action along with a negative bias in the broader market (M criteria) hurts the near-term outlook. It did not trigger a proper buy signal since recently featured.
>>> The latest Featured Stock Update with an annotated graph appeared on 7/22/2011. Click here.
View all notes |
Alert me of new notes |
CANSLIM.net Company Profile |
SEC |
Zacks Reports |
StockTalk |
News |
Chart |
Request a new note
C
A N
S L
I M
|
QSII
-
NASDAQ
Quality Systems Inc
COMPUTER SOFTWARE and SERVICES - Healthcare Information Service
|
$89.87
|
+3.70
4.29% |
$90.86
|
407,245
171.54% of 50 DAV
50 DAV is 237,400
|
$92.38
-2.72%
|
7/6/2011
|
$91.26
|
PP = $91.67
|
|
MB = $96.25
|
Most Recent Note - 7/28/2011 1:23:52 PM
Y - Rallying from its 50 DMA line to within close striking distance of its all-time high. It gapped up today after reporting earnings +55% on +21% sales revenues for the quarter ended June 30, 2011 versus the year ago period. Color code is changed to yellow based on its fundamental and technical strength, however no new pivot point is cited. Volume-driven gains for new highs would be a technical buy signal.
>>> The latest Featured Stock Update with an annotated graph appeared on 7/6/2011. Click here.
View all notes |
Alert me of new notes |
CANSLIM.net Company Profile |
SEC |
Zacks Reports |
StockTalk |
News |
Chart |
Request a new note
C
A N
S L
I M
|
Symbol/Exchange
Company Name
Industry Group |
PRICE |
CHANGE
(%Change) |
Day High |
Volume
(% DAV)
(% 50 day avg vol) |
52 Wk Hi
% From Hi |
Featured
Date |
Price
Featured |
Pivot Featured |
|
Max Buy |
UA
-
NYSE
Under Armour Inc Cl A
CONSUMER NON-DURABLES - Textile - Apparel Clothing
|
$74.50
|
+2.45
3.40% |
$75.79
|
1,900,651
145.44% of 50 DAV
50 DAV is 1,306,800
|
$82.95
-10.19%
|
7/19/2011
|
$81.33
|
PP = $81.52
|
|
MB = $85.60
|
Most Recent Note - 7/28/2011 11:03:22 AM
G - Rebounding from its 50 DMA line today following a damaging streak of 6 consecutive losses. Technically, the pullback has been more than -50% of the depth of its cup and marked by heavy volume, so the latest consolidation cannot be considered a "handle" forming. UA did not confirm a proper technical buy signal since recently featured in yellow. Reported earnings +71% on +42% sales revenues for the quarter ended June 30, 2011 versus the year ago period, showing impressive acceleration in sales and earnings increases, sequentially. See latest FSU analysis for more details and a new annotated graph.
>>> The latest Featured Stock Update with an annotated graph appeared on 7/26/2011. Click here.
View all notes |
Alert me of new notes |
CANSLIM.net Company Profile |
SEC |
Zacks Reports |
StockTalk |
News |
Chart |
Request a new note
C
A N
S L
I M
|
ULTA
-
NASDAQ
Ulta Salon Cosm & Frag
SPECIALTY RETAIL - Specialty Retail, Other
|
$62.78
|
+0.70
1.13% |
$63.91
|
974,640
106.40% of 50 DAV
50 DAV is 916,000
|
$68.80
-8.75%
|
1/6/2011
|
$36.12
|
PP = $37.34
|
|
MB = $39.21
|
Most Recent Note - 7/27/2011 5:23:45 PM
G - Volume picked up but was still below average behind today's loss while it slumped under prior lows toward its 50 DMA line. It rallied +200% since first featured in yellow at $22.81 in the 3/12/10 mid-day report.
>>> The latest Featured Stock Update with an annotated graph appeared on 7/14/2011. Click here.
View all notes |
Alert me of new notes |
CANSLIM.net Company Profile |
SEC |
Zacks Reports |
StockTalk |
News |
Chart |
Request a new note
C
A N
S L
I M
|
ZAGG
-
NASDAQ
Zagg Inc
SPECIALTY RETAIL - Specialty Retail, Other
|
$15.47
|
+0.12
0.78% |
$15.92
|
1,175,624
48.31% of 50 DAV
50 DAV is 2,433,500
|
$16.90
-8.46%
|
6/1/2011
|
$10.92
|
PP = $10.59
|
|
MB = $11.12
|
Most Recent Note - 7/27/2011 5:19:31 PM
G - Down today with higher (near average) volume. Extended from a sound base. No overhead supply remains to act as resistance, however its short V shaped consolidation in recent weeks is not recognized as a sound base pattern. Its 50 DMA line and recent lows define chart support.
>>> The latest Featured Stock Update with an annotated graph appeared on 7/19/2011. Click here.
View all notes |
Alert me of new notes |
CANSLIM.net Company Profile |
SEC |
Zacks Reports |
StockTalk |
News |
Chart |
Request a new note
C
A N
S L
I M
|
|
|
|
THESE ARE NOT BUY RECOMMENDATIONS!
Comments contained in the body of this report are technical
opinions only. The material herein has been obtained
from sources believed to be reliable and accurate, however,
its accuracy and completeness cannot be guaranteed.
This site is not an investment advisor, hence it does
not endorse or recommend any securities or other investments.
Any recommendation contained in this report may not
be suitable for all investors and it is not to be deemed
an offer or solicitation on our part with respect to
the purchase or sale of any securities. All trademarks,
service marks and trade names appearing in this report
are the property of their respective owners, and are
likewise used for identification purposes only.
This report is a service available
only to active Paid Premium Members.
You may opt-out of receiving report notifications
at any time. Questions or comments may be submitted
by writing to Premium Membership Services 665 S.E. 10 Street, Suite 201 Deerfield Beach, FL 33441-5634 or by calling 1-800-965-8307
or 954-785-1121.
|
|
|

