You are not logged in.
This means you
CAN ONLY VIEW reports that were published prior to Tuesday, April 15, 2025.
You
MUST UPGRADE YOUR MEMBERSHIP if you want to see any current reports.
AFTER MARKET UPDATE - MONDAY, AUGUST 1ST, 2011
Previous After Market Report Next After Market Report >>>
|
|
|
|
DOW |
-10.75 |
12,132.49 |
-0.09% |
|
Volume |
1,109,135,210 |
-8% |
|
Volume |
2,159,249,490 |
-3% |
|
NASDAQ |
-11.77 |
2,744.61 |
-0.43% |
|
Advancers |
1,601 |
52% |
|
Advancers |
1,187 |
44% |
|
S&P 500 |
-5.34 |
1,286.94 |
-0.41% |
|
Decliners |
1,417 |
46% |
|
Decliners |
1,406 |
52% |
|
Russell 2000 |
-4.18 |
792.85 |
-0.52% |
|
52 Wk Highs |
35 |
|
|
52 Wk Highs |
36 |
|
|
S&P 600 |
-2.69 |
427.47 |
-0.63% |
|
52 Wk Lows |
93 |
|
|
52 Wk Lows |
99 |
|
|
 |
S&P 500 Index's 6-Day Losing Streak Tests 200-Day Average
Kenneth J. Gruneisen - Passed the CAN SLIM® Master's Exam
The major indices quickly erased impressive early gains before noon on Monday, and the market slumped into the red amid continued uncertainty throughout the remainder of the session. Monday's volume totals were reported slightly lower than the prior session totals on the NYSE and on the Nasdaq exchange, and the weak finish after early gains was a clear sign that the institutional crowd was not accumulating stocks. New 52-week lows outnumbered new 52-week highs on the NYSE and on the Nasdaq exchange. Advancers led decliners by 8-7 on the NYSE while decliners led advancers by a 7-6 margin on the Nasdaq exchange. There were 20 high-ranked companies from the CANSLIM.net Leaders List that made new 52-week highs and appeared on the CANSLIM.net BreakOuts Page, up from the prior total of 12 stocks. There were 11 gainers out of the 19 high-ranked leaders currently included on the Featured Stocks Page.
Both the House and Senate must vote to approve the U.S. debt limit deal reached over the weekend. Despite the agreement, both S&P and Moody's Investors Service are weighing whether to cut the U.S. credit rating. Attention remains on the debt limit and signs of a weakening economy.
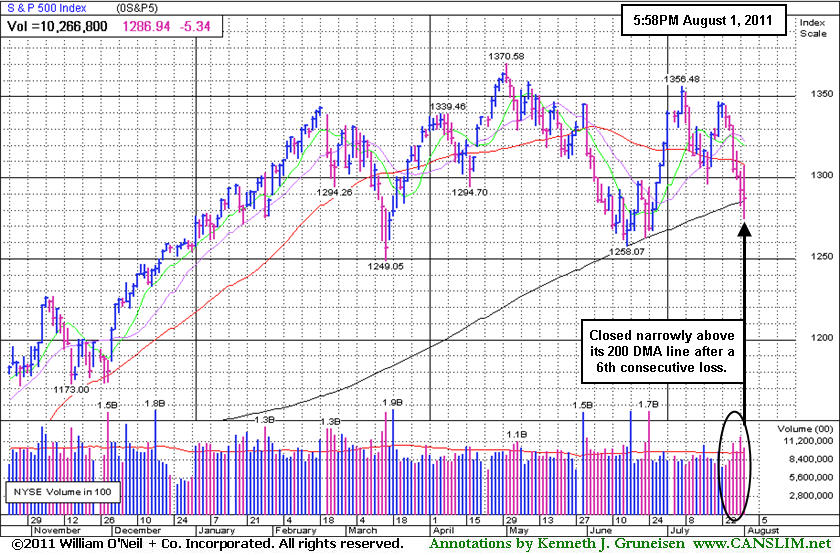
The Institute for Supply Management's factory index fell all the way to 50.9 in July from 55.3 the prior month, disappointing analysts looking for a much better reading. Energy stocks erased early gains following the manufacturing report. The slowest expansion for manufacturing in two years helped take the Dow Jones Industrial Average from an initial gain of 139 points to a loss of 145 points before ultimately closing the session just 10 points lower. The Nasdaq was down as many as 31 points following an early jump of 39. The S&P 500 Index slumped for its 6th consecutive loss and narrowly avoided its first close below its longer-term 200 DMA line since September 10, 2010.
Healthcare-related shares were among Monday's weakest sectors. Humana Inc (HUM -2.98%) fell even after forecasting higher-than-estimated earnings. Kindred Healthcare Inc (KND -29.25%) plunged while nursing home stocks took a beating on word Medicare rates will be dropping. Meanwhile, The Allstate Corp (ALL +2.25%) gained ground after reporting narrower second quarter loss than analysts expected.
The S&P 500 Index, Dow Jones Industrial Average, and the Nasdaq Composite Index are again collectively retreating below their respective downward sloping 50-day moving average (DMA) lines. Concerns have been raised by increasing pressure on stocks as indicated by the major averages (M criteria). The prior rally effort has ended and the market correction currently leaves disciplined investors in a defensive stance, watching for a new rally confirmed by a solid follow-through day before new buying efforts may be justified. Financial stocks, considered very important leading indicators, also are continuing to struggle.
The August 2011 issue of CANSLIM.net News will be published soon! Links to all prior reports are available on the Premium Member Homepage.
PICTURED: The S&P 500 Index slumped near its 200 DMA line with its 6th consecutive loss.
|
 Kenneth J. Gruneisen started out as a licensed stockbroker in August 1987, a couple of months prior to the historic stock market crash that took the Dow Jones Industrial Average down -22.6% in a single day. He has published daily fact-based fundamental and technical analysis on high-ranked stocks online for two decades. Through FACTBASEDINVESTING.COM, Kenneth provides educational articles, news, market commentary, and other information regarding proven investment systems that work in good times and bad.
Comments contained in the body of this report are technical opinions only and are not necessarily those of Gruneisen Growth Corp. The material herein has been obtained from sources believed to be reliable and accurate, however, its accuracy and completeness cannot be guaranteed. Our firm, employees, and customers may effect transactions, including transactions contrary to any recommendation herein, or have positions in the securities mentioned herein or options with respect thereto. Any recommendation contained in this report may not be suitable for all investors and it is not to be deemed an offer or solicitation on our part with respect to the purchase or sale of any securities. |
|
 |
Healthcare Group's Vital Signs Take Ugly Turn
Kenneth J. Gruneisen - Passed the CAN SLIM® Master's Exam
The Networking Index ($NWX -1.83%) and Biotechnology Index ($BTK -1.77%) led the tech sector lower while the Internet Index ($IIX -0.49%) posted a smaller loss and the Semiconductor Index ($SOX -0.00%) finished flat. The Retail Index ($RLX -0.97%) and financial shares created a drag on the major averages as the Broker/Dealer Index ($XBD -0.47%) and Bank Index ($BKX -0.20%) also added to the market's negative bias. Energy-related shares edged lower as the Oil Services Index ($OSX -0.80%) and Integrated Oil Index ($XOI -0.20%) fell, meanwhile the Gold & Silver Index ($XAU +0.57%) was a standout as it posted a small gain.
Charts courtesy www.stockcharts.com
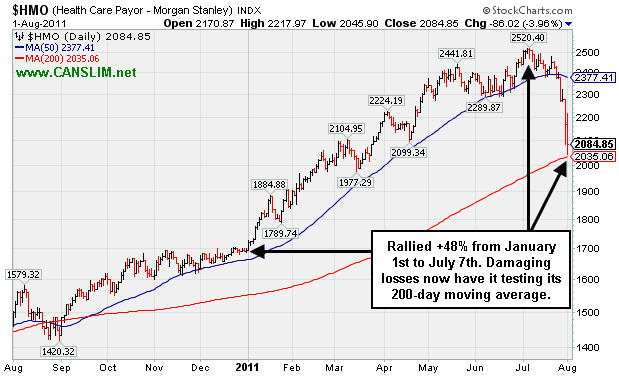
PICTURED: The Healthcare Index ($HMO -3.96%) rallied +48% from January 1st to July 7th. The year began with a new GOP led House of Representatives aiming to repeal President Obama's Healthcare reform legislation. Damaging losses now have the HMO Index testing its 200-day moving average (DMA) line amid concerns the government will reduce payments it is willing or able to make under the entitlement programs as they are currently.
| Oil Services |
$OSX |
271.37 |
-2.18 |
-0.80% |
+10.71% |
| Healthcare |
$HMO |
2,084.85 |
-86.02 |
-3.96% |
+23.22% |
| Integrated Oil |
$XOI |
1,281.90 |
-2.60 |
-0.20% |
+5.67% |
| Semiconductor |
$SOX |
386.93 |
-0.01 |
-0.00% |
-6.04% |
| Networking |
$NWX |
256.33 |
-4.77 |
-1.83% |
-8.64% |
| Internet |
$IIX |
303.91 |
-1.50 |
-0.49% |
-1.24% |
| Broker/Dealer |
$XBD |
104.95 |
-0.50 |
-0.47% |
-13.63% |
| Retail |
$RLX |
533.94 |
-5.22 |
-0.97% |
+5.03% |
| Gold & Silver |
$XAU |
206.99 |
+1.18 |
+0.57% |
-8.65% |
| Bank |
$BKX |
45.92 |
-0.09 |
-0.20% |
-12.05% |
| Biotech |
$BTK |
1,329.44 |
-23.97 |
-1.77% |
+2.45% |
|
|
|
 |
Strong Leisure - Travel Booking Firm Due to Report Earnings
Kenneth J. Gruneisen - Passed the CAN SLIM® Master's Exam
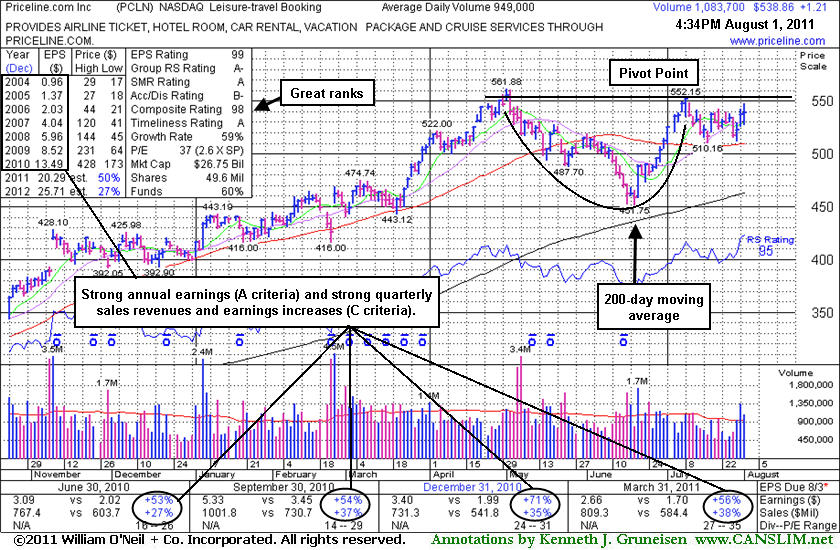
Priceline.com Inc. (PCLN +$1.21 or +0.23% to $538.86) finished the session -4.1% off its 52-week high. In the 7/29/11 mid-day report its color code was changed to yellow with pivot point cited based on its 7/08/11 high. The company has maintained a stellar earnings history that satisfies the C and A criteria. It is due to report earnings for the quarter ended June 30, 2011 on August 3rd, and volume and volatility often increase near earnings news. Keep in mind, the investment system's biggest winning models were typically held by at least a few mutual funds and attracting many others. However, once a stock is very heavily owned by a long list of mutual funds, as is now the case with PCLN, investors should be especially cautious and alert for any technical sell signals or fundamental disappointments which could prompt a rush for the exits. The number of top-rated funds owning its shares rose from 1,351 in Sep '10 to 1,599 in June '11, and increasing interest is an encouraging sign concerning the I criteria.
Its last appearance in this FSU section with an annotated graph was on 5/19/11 under the headline, "50-Day Moving Average Line Tested This Week", as it was finding support at its 50-day moving average (DMA) line. That short-term average had been a reliable support level, but soon thereafter, a 50 DMA line violation and slump under a previously noted chart low ($493.67 on 5/17/11) raised more serious concerns and triggered worrisome technical sell signals. During its consolidation since dropped from the Featured Stocks list on 6/15/11 it found support well above its 200-day moving average (DMA) line, and its rebound above its 50 DMA line subsequently helped its outlook improve. A convincing volume-driven breakout could trigger a fresh new (or add-on) technical buy signal, but keep in mind that the M criteria may override all other promising criteria, since 3 out of 4 stocks follow the direction of the major averages.
|
|
|
Color Codes Explained :
Y - Better candidates highlighted by our
staff of experts.
G - Previously featured
in past reports as yellow but may no longer be buyable under the
guidelines.
***Last / Change / Volume data in this table is the closing quote data***
Symbol/Exchange
Company Name
Industry Group |
PRICE |
CHANGE
(%Change) |
Day High |
Volume
(% DAV)
(% 50 day avg vol) |
52 Wk Hi
% From Hi |
Featured
Date |
Price
Featured |
Pivot Featured |
|
Max Buy |
ATHN
-
NASDAQ
Athenahealth Inc
DIVERSIFIED SERVICES - Business/Management Services
|
$59.38
|
+0.59
1.00% |
$60.00
|
814,579
167.61% of 50 DAV
50 DAV is 486,000
|
$60.29
-1.51%
|
7/22/2011
|
$57.30
|
PP = $50.66
|
|
MB = $53.19
|
 Most Recent Note - 8/1/2011 12:17:27 PM
G - Perched at its all-time high, extended from prior highs in the $50 area that define support after its 7/22/11 breakaway gap.
>>> The latest Featured Stock Update with an annotated graph appeared on 7/27/2011. Click here.
View all notes |
Alert me of new notes |
CANSLIM.net Company Profile |
SEC |
Zacks Reports |
StockTalk |
News |
Chart |
Request a new note
C
A N
S L
I M


|
BIDU
-
NASDAQ
Baidu Inc Ads
INTERNET - Internet Information Providers
|
$158.93
|
+1.86
1.18% |
$161.90
|
8,082,483
89.90% of 50 DAV
50 DAV is 8,990,700
|
$165.96
-4.24%
|
7/26/2011
|
$164.32
|
PP = $156.14
|
|
MB = $163.95
|
Most Recent Note - 7/29/2011 12:17:21 PM
Y - Dipped under its pivot point while pulling back today for a 3rd consecutive loss. No resistance remains due to overhead supply after the "breakaway gap" triggered a technical buy signal. Weak market (M criteria) environment is currently a concern, since 3 out of 4 stocks tend to go in the direction of the major averages.
>>> The latest Featured Stock Update with an annotated graph appeared on 7/28/2011. Click here.
View all notes |
Alert me of new notes |
CANSLIM.net Company Profile |
SEC |
Zacks Reports |
StockTalk |
News |
Chart |
Request a new note
C
A N
S L
I M
|
CACC
-
NASDAQ
Credit Acceptance Corp
FINANCIAL SERVICES - Credit Services
|
$80.52
|
+1.21
1.53% |
$80.92
|
23,522
64.27% of 50 DAV
50 DAV is 36,600
|
$86.87
-7.31%
|
6/2/2011
|
$76.10
|
PP = $82.39
|
|
MB = $86.51
|
Most Recent Note - 8/1/2011 6:42:09 PM
G - Reported earnings after the close today after posting a gain on lighter than average volume that helped it close above its 50 DMA line. The next support level is prior chart lows in the $75 area.
>>> The latest Featured Stock Update with an annotated graph appeared on 6/27/2011. Click here.
View all notes |
Alert me of new notes |
CANSLIM.net Company Profile |
SEC |
Zacks Reports |
StockTalk |
News |
Chart |
Request a new note
C
A N
S L
I M
|
CMG
-
NYSE
Chipotle Mexican Grill
LEISURE - Restaurants
|
$327.55
|
+2.97
0.92% |
$329.99
|
513,464
64.48% of 50 DAV
50 DAV is 796,300
|
$337.32
-2.90%
|
4/1/2011
|
$274.00
|
PP = $275.10
|
|
MB = $288.86
|
Most Recent Note - 8/1/2011 4:26:09 PM
G - Still quietly hovering at all-time highs, extended from any sound base pattern. Reported earnings per share +12% on +22% sales revenues for the quarter ended June 30, 2011 versus the year ago period. Fundamentals have raised concern with its 2nd consecutive quarterly comparison with earnings below the +25% guideline.
>>> The latest Featured Stock Update with an annotated graph appeared on 7/8/2011. Click here.
View all notes |
Alert me of new notes |
CANSLIM.net Company Profile |
SEC |
Zacks Reports |
StockTalk |
News |
Chart |
Request a new note
C
A N
S L
I M
|
EZPW
-
NASDAQ
Ezcorp Inc Cl A
SPECIALTY RETAIL - Specialty Retail, Other
|
$32.87
|
-0.41
-1.23% |
$34.19
|
662,896
131.03% of 50 DAV
50 DAV is 505,900
|
$38.66
-14.98%
|
6/13/2011
|
$31.18
|
PP = $33.41
|
|
MB = $35.08
|
Most Recent Note - 7/29/2011 7:53:30 PM
G - Rebounded near its 50 DMA line today as a second consecutive gain with above average volume indicated it was finding support near prior highs in the $33 area.
>>> The latest Featured Stock Update with an annotated graph appeared on 7/5/2011. Click here.
View all notes |
Alert me of new notes |
CANSLIM.net Company Profile |
SEC |
Zacks Reports |
StockTalk |
News |
Chart |
Request a new note
C
A N
S L
I M
|
Symbol/Exchange
Company Name
Industry Group |
PRICE |
CHANGE
(%Change) |
Day High |
Volume
(% DAV)
(% 50 day avg vol) |
52 Wk Hi
% From Hi |
Featured
Date |
Price
Featured |
Pivot Featured |
|
Max Buy |
FCFS
-
NASDAQ
First Cash Financial Svs
SPECIALTY RETAIL - Specialty Retail, Other
|
$44.32
|
+1.05
2.43% |
$45.47
|
278,072
134.27% of 50 DAV
50 DAV is 207,100
|
$44.84
-1.16%
|
5/31/2011
|
$42.00
|
PP = $40.23
|
|
MB = $42.24
|
Most Recent Note - 8/1/2011 4:16:13 PM
G - Gapped up today hitting and closing at new 52-week highs. Recent chart lows and its 50 DMA line define important near-term support to watch in the $41 area.
>>> The latest Featured Stock Update with an annotated graph appeared on 7/18/2011. Click here.
View all notes |
Alert me of new notes |
CANSLIM.net Company Profile |
SEC |
Zacks Reports |
StockTalk |
News |
Chart |
Request a new note
C
A N
S L
I M
|
FOSL
-
NASDAQ
Fossil Inc
CONSUMER DURABLES - Recreational Goods, Other
|
$126.74
|
+1.07
0.85% |
$129.90
|
643,378
91.51% of 50 DAV
50 DAV is 703,100
|
$134.98
-6.10%
|
2/1/2011
|
$73.30
|
PP = $74.44
|
|
MB = $78.16
|
Most Recent Note - 7/29/2011 1:00:54 PM
G - Could produce more climactic gains, but it is retreating from all-time highs and repeatedly has been noted as extended from its 50 DMA line and prior highs in the $107 area that define support.
>>> The latest Featured Stock Update with an annotated graph appeared on 7/21/2011. Click here.
View all notes |
Alert me of new notes |
CANSLIM.net Company Profile |
SEC |
Zacks Reports |
StockTalk |
News |
Chart |
Request a new note
C
A N
S L
I M
|
IPCM
-
NASDAQ
I P C The Hospitalist Co
HEALTH SERVICES - Hospitals
|
$44.45
|
-0.73
-1.62% |
$48.01
|
560,115
504.15% of 50 DAV
50 DAV is 111,100
|
$52.25
-14.93%
|
7/25/2011
|
$51.40
|
PP = $52.35
|
|
MB = $54.97
|
Most Recent Note - 8/1/2011 4:22:43 PM
Gapped down again today, and after rebounding into positive ground near its 50 DMA line intra-day it ultimately finished near the session low with its 6th consecutive loss on above average volume. Based on its weaker fundamentals and technical damage it will be dropped from the Featured Stocks list tonight. Previously noted - "Reported earnings +18% on +27% sales revenues for the quarter ended June 30, 2011 versus the year ago period. That marked its weakest earnings increase in the span of at least 8 quarterly comparisons, raising concerns."
>>> The latest Featured Stock Update with an annotated graph appeared on 7/25/2011. Click here.
View all notes |
Alert me of new notes |
CANSLIM.net Company Profile |
SEC |
Zacks Reports |
StockTalk |
News |
Chart |
Request a new note
C
A N
S L
I M
|
LULU
-
NASDAQ
Lululemon Athletica
MANUFACTURING - Textile Manufacturing
|
$62.15
|
+1.61
2.66% |
$62.75
|
2,603,157
62.97% of 50 DAV
50 DAV is 4,134,200
|
$64.49
-3.63%
|
6/21/2011
|
$51.48
|
PP = $50.57
|
|
MB = $53.10
|
Most Recent Note - 8/1/2011 4:09:02 PM
G - Holding its ground near its all-time high with volume totals generally cooling in recent weeks. It is extended from a sound base, with its 50 DMA line and prior resistance defining support to watch. A 2:1 split effective 7/12/11 impacted prices (prior Featured Price, Pivot Point, and Max Buy levels were adjusted).
>>> The latest Featured Stock Update with an annotated graph appeared on 7/15/2011. Click here.
View all notes |
Alert me of new notes |
CANSLIM.net Company Profile |
SEC |
Zacks Reports |
StockTalk |
News |
Chart |
Request a new note
C
A N
S L
I M
|
MKTX
-
NASDAQ
Marketaxess Holdings Inc
FINANCIAL SERVICES - Investment Brokerage - Nationa
|
$26.13
|
+0.00
0.00% |
$27.00
|
274,404
174.67% of 50 DAV
50 DAV is 157,100
|
$26.25
-0.46%
|
7/29/2011
|
$25.87
|
PP = $26.35
|
|
MB = $27.67
|
Most Recent Note - 8/1/2011 4:11:12 PM
Y - Posted a small gain today after churning heavy volume and touching a new 52-week high. See the latest FSU analysis for more details and an annotated graph.
>>> The latest Featured Stock Update with an annotated graph appeared on 7/29/2011. Click here.
View all notes |
Alert me of new notes |
CANSLIM.net Company Profile |
SEC |
Zacks Reports |
StockTalk |
News |
Chart |
Request a new note
C
A N
S L
I M
|
Symbol/Exchange
Company Name
Industry Group |
PRICE |
CHANGE
(%Change) |
Day High |
Volume
(% DAV)
(% 50 day avg vol) |
52 Wk Hi
% From Hi |
Featured
Date |
Price
Featured |
Pivot Featured |
|
Max Buy |
MWIV
-
NASDAQ
M W I Veterinary Supply
HEALTH SERVICES - Medical Instruments and; Supplies
|
$88.31
|
-0.75
-0.84% |
$90.24
|
70,976
111.60% of 50 DAV
50 DAV is 63,600
|
$89.49
-1.32%
|
7/11/2011
|
$83.39
|
PP = $84.67
|
|
MB = $88.90
|
Most Recent Note - 7/29/2011 6:43:54 PM
G - Its gain today was backed by only +26% above average volume, below the threshold to trigger a proper technical buy signal. Reported earnings +23% on +18% sales revenues for the quarter ended June 30, 2011 versus the year ago period. That marks the weakest sales and earnings increases in the span of 6 quarterly comparisons, raising concerns. The sub par earnings increase (below the +25% guideline) coupled with broader market (M criteria) weakness may give investors reasons to avoid new buying efforts.
>>> The latest Featured Stock Update with an annotated graph appeared on 6/30/2011. Click here.
View all notes |
Alert me of new notes |
CANSLIM.net Company Profile |
SEC |
Zacks Reports |
StockTalk |
News |
Chart |
Request a new note
C
A N
S L
I M
|
OTEX
-
NASDAQ
Open Text Corp
INTERNET - Internet Software and Services
|
$67.17
|
-0.39
-0.58% |
$68.60
|
253,168
90.16% of 50 DAV
50 DAV is 280,800
|
$72.32
-7.12%
|
6/1/2011
|
$65.86
|
PP = $67.18
|
|
MB = $70.54
|
Most Recent Note - 8/1/2011 4:29:20 PM
Y - Holding its ground near its pivot point now, it stalled after its 7/13/11 technical buy signal. Volume totals have been near average or lighter since its negative reversal at its all-time high. Prior resistance near $66 defines important chart support to watch above its 50 DMA line.
>>> The latest Featured Stock Update with an annotated graph appeared on 7/20/2011. Click here.
View all notes |
Alert me of new notes |
CANSLIM.net Company Profile |
SEC |
Zacks Reports |
StockTalk |
News |
Chart |
Request a new note
C
A N
S L
I M
|
PCLN
-
NASDAQ
Priceline.Com Inc
INTERNET - Internet Software and Services
|
$538.86
|
+1.21
0.23% |
$547.88
|
1,142,556
120.40% of 50 DAV
50 DAV is 949,000
|
$561.88
-4.10%
|
7/29/2011
|
$539.46
|
PP = $552.15
|
|
MB = $579.76
|
Most Recent Note - 8/1/2011 5:20:45 PM
Y - Posted a 3rd consecutive small gain today while perched within close striking distance of its 52-week high. Color code was changed to yellow with pivot point cited based on its 7/08/11 high. Due to report earnings on August 3rd. Stellar earnings history satisfies the C and A criteria. Found support well above its 200 DMA line during its consolidation since dropped from the Featured Stocks list on 6/15/11. A subsequent breakout could trigger a technical buy signal, but keep in mind that the M criteria may override all other promising criteria, since 3 out of 4 stocks follow the direction of the major averages. See the latest FSU analysis for more details and a new annotated graph.
>>> The latest Featured Stock Update with an annotated graph appeared on 8/1/2011. Click here.
View all notes |
Alert me of new notes |
CANSLIM.net Company Profile |
SEC |
Zacks Reports |
StockTalk |
News |
Chart |
Request a new note
C
A N
S L
I M
|
PRGO
-
NASDAQ
Perrigo Co
DRUGS - Drug Related Products
|
$89.41
|
-0.90
-1.00% |
$91.09
|
598,906
136.21% of 50 DAV
50 DAV is 439,700
|
$94.61
-5.50%
|
7/13/2011
|
$92.89
|
PP = $92.40
|
|
MB = $97.02
|
Most Recent Note - 8/1/2011 6:31:11 PM
Y - Today's 4th consecutive loss on heavier volume led to a slump further below its pivot point and tested its 50 DMA line, raising more concerns. A gain with sufficient volume did not recently confirm a proper technical buy signal. This riskier late-stage setup stalled after rallying to a new 52-week high.
>>> The latest Featured Stock Update with an annotated graph appeared on 7/13/2011. Click here.
View all notes |
Alert me of new notes |
CANSLIM.net Company Profile |
SEC |
Zacks Reports |
StockTalk |
News |
Chart |
Request a new note
C
A N
S L
I M
|
PSMT
-
NASDAQ
Pricesmart Inc
RETAIL - Drug Stores
|
$61.05
|
+2.53
4.32% |
$61.30
|
224,427
96.74% of 50 DAV
50 DAV is 232,000
|
$62.27
-1.96%
|
7/22/2011
|
$60.04
|
PP = $61.14
|
|
MB = $64.20
|
Most Recent Note - 8/1/2011 4:14:02 PM
Y - Gapped up today for a gain on lighter than average volume, rallying to its second best close ever. A negative bias in the broader market (M criteria) hurts the near-term outlook for all stocks. PSMT did not trigger a proper buy signal since recently featured.
>>> The latest Featured Stock Update with an annotated graph appeared on 7/22/2011. Click here.
View all notes |
Alert me of new notes |
CANSLIM.net Company Profile |
SEC |
Zacks Reports |
StockTalk |
News |
Chart |
Request a new note
C
A N
S L
I M
|
Symbol/Exchange
Company Name
Industry Group |
PRICE |
CHANGE
(%Change) |
Day High |
Volume
(% DAV)
(% 50 day avg vol) |
52 Wk Hi
% From Hi |
Featured
Date |
Price
Featured |
Pivot Featured |
|
Max Buy |
QSII
-
NASDAQ
Quality Systems Inc
COMPUTER SOFTWARE and SERVICES - Healthcare Information Service
|
$90.71
|
-0.65
-0.71% |
$93.64
|
420,164
168.67% of 50 DAV
50 DAV is 249,100
|
$92.38
-1.81%
|
7/6/2011
|
$91.26
|
PP = $91.67
|
|
MB = $96.25
|
Most Recent Note - 8/1/2011 12:58:20 PM
Y - Reversed into the red after spiking to a new all-time high with today's early gains. Reported earnings +55% on +21% sales revenues for the quarter ended June 30, 2011 versus the year ago period. Volume-driven gains and a strong finish for new highs with heavy volume would be a technical buy signal, however the weaker market action (M criteria) of late is arguing against new buying efforts.
>>> The latest Featured Stock Update with an annotated graph appeared on 7/6/2011. Click here.
View all notes |
Alert me of new notes |
CANSLIM.net Company Profile |
SEC |
Zacks Reports |
StockTalk |
News |
Chart |
Request a new note
C
A N
S L
I M
|
UA
-
NYSE
Under Armour Inc Cl A
CONSUMER NON-DURABLES - Textile - Apparel Clothing
|
$72.87
|
-0.54
-0.74% |
$75.66
|
1,058,680
81.49% of 50 DAV
50 DAV is 1,299,100
|
$82.95
-12.15%
|
7/19/2011
|
$81.33
|
PP = $81.52
|
|
MB = $85.60
|
Most Recent Note - 8/1/2011 6:35:05 PM
G - Recent slide has it trading near support at its 50 DMA line. UA did not confirm a proper technical buy signal since recently featured in yellow. Reported earnings +71% on +42% sales revenues for the quarter ended June 30, 2011 versus the year ago period, showing impressive acceleration in sales and earnings increases, sequentially.
>>> The latest Featured Stock Update with an annotated graph appeared on 7/26/2011. Click here.
View all notes |
Alert me of new notes |
CANSLIM.net Company Profile |
SEC |
Zacks Reports |
StockTalk |
News |
Chart |
Request a new note
C
A N
S L
I M
|
ULTA
-
NASDAQ
Ulta Salon Cosm & Frag
SPECIALTY RETAIL - Specialty Retail, Other
|
$63.23
|
+0.20
0.32% |
$65.01
|
550,294
59.36% of 50 DAV
50 DAV is 927,000
|
$68.80
-8.10%
|
1/6/2011
|
$36.12
|
PP = $37.34
|
|
MB = $39.21
|
Most Recent Note - 8/1/2011 6:36:44 PM
G - Consolidating just above support at its 50 DMA line. It rallied +200% since first featured in yellow at $22.81 in the 3/12/10 mid-day report.
>>> The latest Featured Stock Update with an annotated graph appeared on 7/14/2011. Click here.
View all notes |
Alert me of new notes |
CANSLIM.net Company Profile |
SEC |
Zacks Reports |
StockTalk |
News |
Chart |
Request a new note
C
A N
S L
I M
|
ZAGG
-
NASDAQ
Zagg Inc
SPECIALTY RETAIL - Specialty Retail, Other
|
$16.09
|
+0.74
4.82% |
$16.19
|
1,511,021
62.11% of 50 DAV
50 DAV is 2,432,700
|
$16.90
-4.79%
|
6/1/2011
|
$10.92
|
PP = $10.59
|
|
MB = $11.12
|
Most Recent Note - 8/1/2011 4:04:28 PM
G - Gapped up today for a gain with below average volume. Extended from a sound base. No overhead supply remains to act as resistance, however its short V shaped consolidation in recent weeks is not recognized as a sound base pattern. Its 50 DMA line and recent lows define chart support.
>>> The latest Featured Stock Update with an annotated graph appeared on 7/19/2011. Click here.
View all notes |
Alert me of new notes |
CANSLIM.net Company Profile |
SEC |
Zacks Reports |
StockTalk |
News |
Chart |
Request a new note
C
A N
S L
I M
|
|
|
|
THESE ARE NOT BUY RECOMMENDATIONS!
Comments contained in the body of this report are technical
opinions only. The material herein has been obtained
from sources believed to be reliable and accurate, however,
its accuracy and completeness cannot be guaranteed.
This site is not an investment advisor, hence it does
not endorse or recommend any securities or other investments.
Any recommendation contained in this report may not
be suitable for all investors and it is not to be deemed
an offer or solicitation on our part with respect to
the purchase or sale of any securities. All trademarks,
service marks and trade names appearing in this report
are the property of their respective owners, and are
likewise used for identification purposes only.
This report is a service available
only to active Paid Premium Members.
You may opt-out of receiving report notifications
at any time. Questions or comments may be submitted
by writing to Premium Membership Services 665 S.E. 10 Street, Suite 201 Deerfield Beach, FL 33441-5634 or by calling 1-800-965-8307
or 954-785-1121.
|
|
|

