You are not logged in.
This means you
CAN ONLY VIEW reports that were published prior to Monday, April 14, 2025.
You
MUST UPGRADE YOUR MEMBERSHIP if you want to see any current reports.
AFTER MARKET UPDATE - THURSDAY, JUNE 17TH, 2010
Previous After Market Report Next After Market Report >>>
|
|
|
|
DOW |
+24.71 |
10,434.17 |
+0.24% |
|
Volume |
1,157,338,350 |
-1% |
|
Volume |
1,724,409,670 |
-7% |
|
NASDAQ |
+1.23 |
2,307.16 |
+0.05% |
|
Advancers |
1,481 |
47% |
|
Advancers |
1,319 |
48% |
|
S&P 500 |
+1.43 |
1,116.04 |
+0.13% |
|
Decliners |
1,533 |
49% |
|
Decliners |
1,299 |
47% |
|
Russell 2000 |
-0.28 |
665.85 |
-0.04% |
|
52 Wk Highs |
57 |
|
|
52 Wk Highs |
38 |
|
|
S&P 600 |
-0.14 |
354.75 |
-0.04% |
|
52 Wk Lows |
9 |
|
|
52 Wk Lows |
29 |
|
|
 |
Volume Totals Cool As Indices Hold Steady
Adam Sarhan, Contributing Writer,
The major averages ended slightly higher while investors digested a slew of economic data and the CEO of BP Plc (BP -0.44%) spent the day testifying on Capital Hill. Volume totals were reported lower on both major exchanges, which signaled that large institutions were not aggressively selling stocks. Advancers were about even with decliners on the NYSE and on the Nasdaq exchange as the major averages continued consolidating Tuesday's large gains. There were 22 high-ranked companies from the CANSLIM.net Leaders List that made a new 52-week high and appeared on the CANSLIM.net BreakOuts Page, lower than the 35 issues that appeared on the prior session. New 52-week highs outnumbered new 52-week lows on the NYSE and on the Nasdaq exchange.
Before Thursday's opening bell, the Labor Department said US jobless claims rose to 472,000 last week, and the consumer price index (CPI) slid, which helped allay inflation woes. After the bell, the Federal Reserve Bank of Philadelphia’s general economic index fell to a 10-month low of 8, less than half the median estimate of Wall Street economists. The Conference Board's index of leading indicators in April edged down -0.1%, following a +1.3% increase in the prior month.
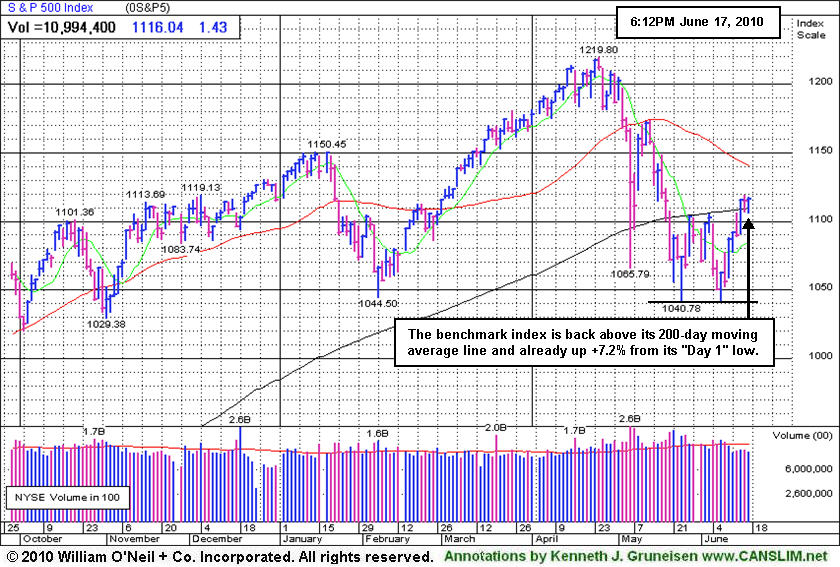
The major averages confirmed their latest rally attempt on Tuesday, June 15, 2010 when they produced a sound follow-through day. Looking forward, the window is now open for disciplined investors to begin carefully buying high-ranked stocks again. Technically, it was encouraging to also see the Dow Jones Industrial Average and the benchmark S&P 500 Index rally above their respective 200-day moving average (DMA) lines. Looking forward, the 200 DMA line should now act as support as this market continues advancing, while any reversal would be a worrisome sign.
Remember to remain very selective because all of the major averages are still trading below their downward sloping 50 DMA lines. It was somewhat disconcerting to see volume remain light (below average) behind the confirming gains. It is important to note that approximately 75% of FTDs lead to new sustained rallies, while 25% fail. In addition, every major rally in market history has begun with a FTD, but not every FTD leads to a new rally. Trade accordingly.
Are You Ready For This NEW Confirmed Rally?
Inquire Today About Our Professional Money Management Services:
If your portfolio is greater than $100,000 and you need assistance, click here to get connected with one of our portfolio managers. ** Serious inquires only, please.
PICTURED: The benchmark S&P 500 Index is back above its 200 DMA line and already up +7.2% from its "Day 1" low.
|
|
|
 |
Defensive Groups' Gains Offset Other Weakness
Kenneth J. Gruneisen - Passed the CAN SLIM® Master's Exam
Weakness in the Retail Index ($RLX -1.25%) and slumping financial shares led to losses for the Broker/Dealer Index ($XBD -1.44%) and Bank Index ($BKX -0.42%), however their negative influence did not drag the major averages lower. Defensive groups had a positive impact as the Gold & Silver Index ($XAU +2.05%) and Healthcare Index ($HMO +2.42%) posted solid gains. The Oil Services Index ($OSX +0.53%) posted a small gain as the Integrated Oil Index ($XOI -0.08%) inched lower. In the tech sector action was mixed as small gains from the Networking Index ($NWX +0.13%) and Biotechnology Index ($BTK +0.16%) were offset by modest losses from the Internet Index ($IIX -0.26%) and Semiconductor Index ($SOX -0.19%).
Charts courtesy www.stockcharts.com
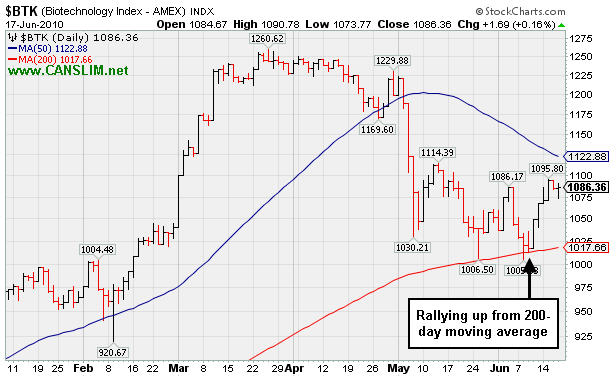
PICTURED: The Biotechnology Index ($BTK +0.16%) has been rallying up from its 200-day moving average, yet remains below its shorter-term average.
| Oil Services |
$OSX |
180.44 |
+0.96 |
+0.53% |
-7.43% |
| Healthcare |
$HMO |
1,572.97 |
+37.12 |
+2.42% |
+6.79% |
| Integrated Oil |
$XOI |
969.41 |
-0.75 |
-0.08% |
-9.25% |
| Semiconductor |
$SOX |
372.39 |
-0.70 |
-0.19% |
+3.47% |
| Networking |
$NWX |
237.73 |
+0.31 |
+0.13% |
+2.89% |
| Internet |
$IIX |
243.66 |
-0.63 |
-0.26% |
+4.19% |
| Broker/Dealer |
$XBD |
106.13 |
-1.55 |
-1.44% |
-7.75% |
| Retail |
$RLX |
432.74 |
-5.46 |
-1.25% |
+5.26% |
| Gold & Silver |
$XAU |
182.38 |
+3.67 |
+2.05% |
+8.40% |
| Bank |
$BKX |
49.67 |
-0.21 |
-0.42% |
+16.30% |
| Biotech |
$BTK |
1,086.36 |
+1.69 |
+0.16% |
+15.31% |
|
|
|
 |
Saucy Details On Apple Worth Reviewing
Kenneth J. Gruneisen - Passed the CAN SLIM® Master's Exam
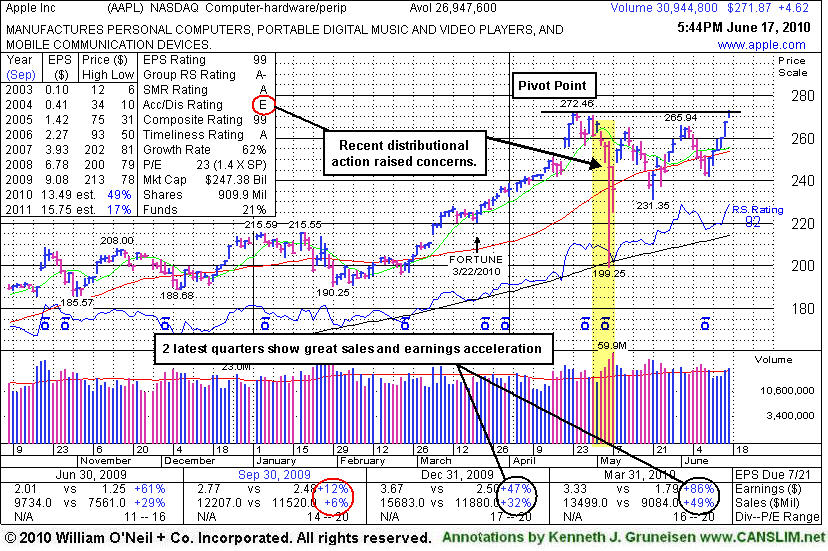
Apple Inc (AAPL +$4.62 or +1.73% to $271.87) gapped up today and touched a new all-time high with volume only +16% above average behind its 6th consecutive gain on the right side of a choppy 9-week consolidation marked by heavy distribution. It was featured earlier today in the mid-day report (read here) in yellow with new pivot point cited based upon its all-time high plus ten cents. Technically, any new breakout should be marked by heavy volume to be considered a tactically sound buy candidate under the guidelines of the fact-based system. Noted in prior mid-day reports - "It showed accelerating sales and earnings increases and rebounded impressively since 'Apple, Once Sweet, Now Rotten!' long ago headlined follow-up coverage of this previously featured favorite with a stellar annual earnings (A criteria) history."
Its 900 million shares outstanding is a huge supply (not most favorable regarding the S criteria), however that makes the fact that recent quarterly comparisons have shown impressive earnings and sales acceleration even more impressive! Quarterly growth has improved meaningfully, and it was repeatedly noted in recent mid-day reports while "again looking more like the big winning examples shown in the book 'How to Make Money in Stocks' with regard to the C criteria of the proven investment system." The latest action has been a direct result of great demand for its new iPad computer notebook-type product which is driving stronger sales and earnings growth again. A key to a company satisfying the N criteria is a hot new product or service, and a powerful breakout to new highs too! Another concern now is that the number of top-rated funds owning its shares fell from 896 in Dec '09 to 851 in Mar '10, which is not a favorable trend with respect to the I criteria. That trend is all the more reason to be watching for proof of fresh and significant institutional buying demand like the demand once shown for its shares - very important to be discussed further.
In this FSU section we have summarized prior coverage on AAPL throughout its past ups and downs. Sometimes it showed decelerating sales and earnings growth and poor technical action, with an annotated graph pointing out exactly where and why it was dropped from the Featured Stocks list on 6/27/08 - when it had closed at $170 per share. Under the headline "Can You Tell A Good Apple From A Bad Apple?" on 1/23/2009 an annotated graph accompanied the analysis after the company reported its results for the quarter ended December 31, 2008 showing only a +6% sales revenues increase and only a +1% earnings per share increase over the year earlier period - clear fundamental evidence of worrisome deterioration. We did some additional research and included an old graph of AAPL from 6/15/2004 (shown in the article linked to above) allowing everyone to take a look back in time to the days when AAPL was near the beginning of a 15-fold advance over 45 months! In March 2004, one full year after the Iraq war began and the major averages had signaled a confirmed rally with a follow-through day, institutional investors were accumulating AAPL shares. Volume did not just barely limp over the minimum +50% above average volume threshold when it broke out, but instead, volume spiked up more than +500% as the price blasted to new multi-year highs. Investors who looked at its P/E Ratio of 70 may have easily made the mistake of assuming it was dangerously "overvalued" at the time. Quarterly sales and earnings increases were showing a drastic upturn, helped by the company's hot new iPod product. Apple's current P/E Ratio of 23 is not as lofty as it was at the beginning of its great move in 2004, and also well below the P/E of other high-ranked leaders today including THOR 49, NFLX 53, BIDU 95, CRM 119, respectively.
Time will only tell if fact-based investors might be justifiably emboldened to go ahead and accumulate shares, and those with strict discipline may choose to take action when they see sound fundamental and technical reasons to do so. Institutional investors, due to the size of their positions, cannot easily or quickly move in or out of stocks without causing too much slippage. They accumulate shares of companies they like on an ongoing basis, building up to larger positions by adding to their holdings when the stock consolidates near a support level. While support promptly arrived near its long-term 200-day moving average (DMA) line during the "flash-crash" on May 6th, 2010, its fall from $272.46 to as low as $199.25 in the span of 9 trading sessions serves as a warning notice as to how quickly even a strong leader can fall in a bad market (M criteria) environment.
Here is a summary of its other Featured Stock Update section appearances in the past:
Apple's Loss Has Very Little To Do With Jobs' Health- 1/15/2009
Apple Fell -50% Since Removed From Featured Stocks List- 11/13/2008
Deep Cup Pattern Reminiscent of Some Past Tech Greats- 6/1/2008
Positive Reversal Near Important Chart Support- 1/30/2006
Market Leaders Tend to Keep on Leading- 10/20/2005
A Normal Pullback- 9/30/2005
Apple Tests Trendline- 9/28/2005
Classic Breakout Continues Higher- 9/19/2005 |
|
|
Color Codes Explained :
Y - Better candidates highlighted by our
staff of experts.
G - Previously featured
in past reports as yellow but may no longer be buyable under the
guidelines.
***Last / Change / Volume data in this table is the closing quote data***
Symbol/Exchange
Company Name
Industry Group |
PRICE |
CHANGE
(%Change) |
Day High |
Volume
(% DAV)
(% 50 day avg vol) |
52 Wk Hi
% From Hi |
Featured
Date |
Price
Featured |
Pivot Featured |
|
Max Buy |
AAPL
-
NASDAQ
Apple Inc
COMPUTER HARDWARE - Personal Computers
|
$271.87
|
+4.62
1.73% |
$272.87
|
31,126,103
116.55% of 50 DAV
50 DAV is 26,707,100
|
$272.46
-0.22%
|
6/17/2010
|
$270.95
|
PP = $272.56
|
|
MB = $286.19
|
 Most Recent Note - 6/17/2010 6:21:35 PM
Y - In today's mid-day report (read here) it was featured again in yellow with a new pivot point cited based upon its all-time high plus ten cents. It gapped up and touched a new all-time high while posting its 6th consecutive gain, working on the right side of a choppy 9-week consolidation marked by heavy distribution.
>>> The latest Featured Stock Update with an annotated graph appeared on 6/17/2010. Click here.
View all notes |
Alert me of new notes |
CANSLIM.net Company Profile |
SEC |
Zacks Reports |
StockTalk |
News |
Chart |
Request a new note
C
A N
S L
I M


|
APEI
-
NASDAQ
American Public Educ Inc
DIVERSIFIED SERVICES - Education and Training Services
|
$47.34
|
+0.03
0.06% |
$47.98
|
103,497
62.69% of 50 DAV
50 DAV is 165,100
|
$48.26
-1.91%
|
6/7/2010
|
$46.60
|
PP = $46.29
|
|
MB = $48.60
|
Most Recent Note - 6/17/2010 4:19:17 PM
Y - Quietly held its ground today. Recently slumped near its 50 DMA line, then positively reversed and closed with a solid gain.
>>> The latest Featured Stock Update with an annotated graph appeared on 6/14/2010. Click here.
View all notes |
Alert me of new notes |
CANSLIM.net Company Profile |
SEC |
Zacks Reports |
StockTalk |
News |
Chart |
Request a new note
C
A N
S L
I M
|
BIDU
-
NASDAQ
Baidu Inc Ads
INTERNET - Internet Information Providers
|
$72.47
|
-2.34
-3.13% |
$75.35
|
11,769,148
77.64% of 50 DAV
50 DAV is 15,157,800
|
$82.29
-11.93%
|
1/13/2010
|
$43.13
|
PP = $42.68
|
|
MB = $44.81
|
Most Recent Note - 6/17/2010 4:21:12 PM
G - Volume ticked higher but remained below average behind today's small loss. Quietly consolidating above its 50 DMA line within -12% of its 52-week high. A worrisome negative reversal from its all-time high on 5/13/10 followed a 10:1 stock split.
>>> The latest Featured Stock Update with an annotated graph appeared on 6/1/2010. Click here.
View all notes |
Alert me of new notes |
CANSLIM.net Company Profile |
SEC |
Zacks Reports |
StockTalk |
News |
Chart |
Request a new note
C
A N
S L
I M
|
BRLI
-
NASDAQ
Bio Reference Labs Inc
HEALTH SERVICES - Medical Laboratories and Researc
|
$23.21
|
+0.03
0.13% |
$23.48
|
114,133
60.52% of 50 DAV
50 DAV is 188,600
|
$24.67
-5.93%
|
6/15/2010
|
$23.57
|
PP = $24.77
|
|
MB = $26.01
|
Most Recent Note - 6/17/2010 4:23:00 PM
Y - Volume has been very quiet in recent weeks while consolidating near its 50 DMA line. Color code was changed to yellow with new pivot point cited.
>>> The latest Featured Stock Update with an annotated graph appeared on 6/15/2010. Click here.
View all notes |
Alert me of new notes |
CANSLIM.net Company Profile |
SEC |
Zacks Reports |
StockTalk |
News |
Chart |
Request a new note
C
A N
S L
I M
|
CISG
-
NASDAQ
Cninsure Inc Ads
INSURANCE - Insurance Brokers
|
$26.60
|
-0.65
-2.39% |
$27.24
|
102,397
34.40% of 50 DAV
50 DAV is 297,700
|
$28.62
-7.06%
|
6/16/2010
|
$27.20
|
PP = $27.75
|
|
MB = $29.14
|
Most Recent Note - 6/17/2010 4:43:47 PM
Y - Loss today on very light volume. Recent gains helped it rally back above its 50 DMA line, technically helping its outlook improve. Featured again in yellow in the 6/16/10 mid-day report (read here) with new pivot point cited based upon its 5/13/10 high. Based on weak action it was previously dropped from the Featured Stocks list on 5/19/10.
>>> The latest Featured Stock Update with an annotated graph appeared on 5/12/2010. Click here.
View all notes |
Alert me of new notes |
CANSLIM.net Company Profile |
SEC |
Zacks Reports |
StockTalk |
News |
Chart |
Request a new note
C
A N
S L
I M
|
Symbol/Exchange
Company Name
Industry Group |
PRICE |
CHANGE
(%Change) |
Day High |
Volume
(% DAV)
(% 50 day avg vol) |
52 Wk Hi
% From Hi |
Featured
Date |
Price
Featured |
Pivot Featured |
|
Max Buy |
CRM
-
NYSE
Salesforce.Com Inc
INTERNET - Internet Software and Services
|
$97.10
|
+2.76
2.93% |
$97.56
|
3,525,612
134.67% of 50 DAV
50 DAV is 2,617,900
|
$97.09
0.01%
|
6/2/2010
|
$88.44
|
PP = $89.60
|
|
MB = $94.08
|
Most Recent Note - 6/17/2010 4:45:09 PM
G - Gain today with above average volume for a new all-time high, extended from its latest sound base. Prior highs in the $89 area are an important support level to watch above its 50 DMA line.
>>> The latest Featured Stock Update with an annotated graph appeared on 6/2/2010. Click here.
View all notes |
Alert me of new notes |
CANSLIM.net Company Profile |
SEC |
Zacks Reports |
StockTalk |
News |
Chart |
Request a new note
C
A N
S L
I M
|
DECK
-
NASDAQ
Deckers Outdoor Corp
CONSUMER NON-DURABLES - Textile - Apparel Footwear
|
$162.79
|
-0.11
-0.07% |
$165.99
|
464,378
90.38% of 50 DAV
50 DAV is 513,800
|
$167.49
-2.81%
|
6/11/2010
|
$157.34
|
PP = $158.57
|
|
MB = $166.50
|
Most Recent Note - 6/17/2010 5:18:32 PM
Y - Holding its ground -3% off its 52-week high. Prior chart highs may now serve as initial support on pullbacks.
>>> The latest Featured Stock Update with an annotated graph appeared on 6/11/2010. Click here.
View all notes |
Alert me of new notes |
CANSLIM.net Company Profile |
SEC |
Zacks Reports |
StockTalk |
News |
Chart |
Request a new note
C
A N
S L
I M
|
FFIV
-
NASDAQ
F 5 Networks Inc
INTERNET - Internet Software and Services
|
$73.42
|
-1.27
-1.70% |
$75.93
|
1,614,793
100.30% of 50 DAV
50 DAV is 1,609,900
|
$75.24
-2.41%
|
6/16/2010
|
$74.50
|
PP = $74.10
|
|
MB = $77.81
|
Most Recent Note - 6/17/2010 5:23:13 PM
Y - Negatively reversed today after gapping up and hitting new all-time highs, closing back under its pivot point with a small loss on average volume. Gain on 6/16/10 with +55% above average volume helped it trigger a technical buy signal with its breakout from a flat base of about 5-weeks. Featured in the 6/16/10 mid-day report (read here) as its color code was changed to yellow with a pivot point based upon its 5/13/10 high plus ten cents.
>>> The latest Featured Stock Update with an annotated graph appeared on 6/16/2010. Click here.
View all notes |
Alert me of new notes |
CANSLIM.net Company Profile |
SEC |
Zacks Reports |
StockTalk |
News |
Chart |
Request a new note
C
A N
S L
I M
|
MELI
-
NASDAQ
Mercadolibre Inc
INTERNET - Internet Software and; Services
|
$60.75
|
+0.15
0.25% |
$61.44
|
880,140
116.90% of 50 DAV
50 DAV is 752,900
|
$62.14
-2.24%
|
5/13/2010
|
$54.21
|
PP = $55.85
|
|
MB = $58.64
|
Most Recent Note - 6/17/2010 5:27:33 PM
G - Today marked its 8th consecutive gain, getting extended from its prior base. Prior chart highs in the $55 area may now act as an initial support level on pullbacks.
>>> The latest Featured Stock Update with an annotated graph appeared on 6/10/2010. Click here.
View all notes |
Alert me of new notes |
CANSLIM.net Company Profile |
SEC |
Zacks Reports |
StockTalk |
News |
Chart |
Request a new note
C
A N
S L
I M
|
ROVI
-
NASDAQ
Rovi Corp
COMPUTER SOFTWARE andamp; SERVICES - Security Software andamp; Services
|
$38.38
|
-0.07
-0.18% |
$38.74
|
1,529,704
115.80% of 50 DAV
50 DAV is 1,321,000
|
$40.06
-4.19%
|
6/3/2010
|
$38.70
|
PP = $40.16
|
|
MB = $42.17
|
Most Recent Note - 6/17/2010 5:29:20 PM
G - Held its ground today while trading higher volume, consolidating above its 50 DMA line just -4% off its 52-week high. Recently found support near prior lows in the $35 area, and stayed above its October 2009 chart high.
>>> The latest Featured Stock Update with an annotated graph appeared on 6/9/2010. Click here.
View all notes |
Alert me of new notes |
CANSLIM.net Company Profile |
SEC |
Zacks Reports |
StockTalk |
News |
Chart |
Request a new note
C
A N
S L
I M
|
Symbol/Exchange
Company Name
Industry Group |
PRICE |
CHANGE
(%Change) |
Day High |
Volume
(% DAV)
(% 50 day avg vol) |
52 Wk Hi
% From Hi |
Featured
Date |
Price
Featured |
Pivot Featured |
|
Max Buy |
SUMR
-
NASDAQ
Summer Infant Inc
CONSUMER NON-DURABLES - Personal Products
|
$7.26
|
+0.13
1.82% |
$7.41
|
51,865
65.32% of 50 DAV
50 DAV is 79,400
|
$8.42
-13.78%
|
5/4/2010
|
$6.85
|
PP = $7.09
|
|
MB = $7.44
|
Most Recent Note - 6/17/2010 5:31:24 PM
G - Today marked its 5th consecutive gain on light volume. It has rallied back above its 50 DMA line and prior chart highs in the $7 area, technically improving its outlook. Recent chart lows in the $6.25 area define important support to watch now.
>>> The latest Featured Stock Update with an annotated graph appeared on 6/8/2010. Click here.
View all notes |
Alert me of new notes |
CANSLIM.net Company Profile |
SEC |
Zacks Reports |
StockTalk |
News |
Chart |
Request a new note
C
A N
S L
I M
|
THOR
-
NASDAQ
Thoratec Corp
HEALTH SERVICES - Medical Instruments and Supplies
|
$46.12
|
-0.96
-2.04% |
$47.38
|
1,015,562
109.45% of 50 DAV
50 DAV is 927,900
|
$47.93
-3.78%
|
6/3/2010
|
$44.38
|
PP = $45.35
|
|
MB = $47.62
|
Most Recent Note - 6/17/2010 5:34:47 PM
Y- Consolidating back toward prior chart highs with a loss today on average volume, its color code is changed to yellow again. No resistance remains due to overhead supply, and it could produce more climactic gains.
>>> The latest Featured Stock Update with an annotated graph appeared on 6/3/2010. Click here.
View all notes |
Alert me of new notes |
CANSLIM.net Company Profile |
SEC |
Zacks Reports |
StockTalk |
News |
Chart |
Request a new note
C
A N
S L
I M
|
ULTA
-
NASDAQ
Ulta Salon Cosm & Frag
SPECIALTY RETAIL - Specialty Retail, Other
|
$25.80
|
-0.05
-0.19% |
$26.45
|
677,591
117.80% of 50 DAV
50 DAV is 575,200
|
$26.50
-2.64%
|
5/28/2010
|
$25.58
|
PP = $25.86
|
|
MB = $27.15
|
Most Recent Note - 6/17/2010 5:36:34 PM
Y - Holding its ground near its 52-week high and its pivot point. No overhead supply remains to act as resistance, however, on 6/11/10 it completed a Secondary Offering which may hinder upward price progress for the near-term.
>>> The latest Featured Stock Update with an annotated graph appeared on 6/7/2010. Click here.
View all notes |
Alert me of new notes |
CANSLIM.net Company Profile |
SEC |
Zacks Reports |
StockTalk |
News |
Chart |
Request a new note
C
A N
S L
I M
|
|
|
|
THESE ARE NOT BUY RECOMMENDATIONS!
Comments contained in the body of this report are technical
opinions only. The material herein has been obtained
from sources believed to be reliable and accurate, however,
its accuracy and completeness cannot be guaranteed.
This site is not an investment advisor, hence it does
not endorse or recommend any securities or other investments.
Any recommendation contained in this report may not
be suitable for all investors and it is not to be deemed
an offer or solicitation on our part with respect to
the purchase or sale of any securities. All trademarks,
service marks and trade names appearing in this report
are the property of their respective owners, and are
likewise used for identification purposes only.
This report is a service available
only to active Paid Premium Members.
You may opt-out of receiving report notifications
at any time. Questions or comments may be submitted
by writing to Premium Membership Services 665 S.E. 10 Street, Suite 201 Deerfield Beach, FL 33441-5634 or by calling 1-800-965-8307
or 954-785-1121.
|
|
|


