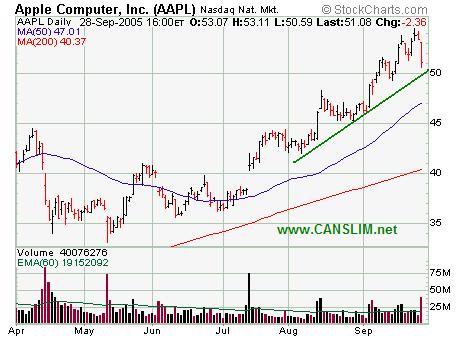
Apple Tests Trendline
Wednesday, September 28, 2005 CANSLIM.net

Apple Computer Inc. (AAPL -2.36 or -4.62% to $51.08) gapped lower on Wednesday on above average volume to test support at its upward trendline. Leading stocks tend to pull back towards their upward trendlines to consolidate recent gains. This is exactly what transpired today. Apple's trendline (shown below) is currently acting as near term support and thus far this is a relatively normal pull back. However, should the selling continue and if this issue fails to find support at its upward trendline, then the next level of support is its 50 DMA. Any losses's beyond that point would constitute a technical failure and should not be tolerated.
This stock was recently featured on 8/24/2005 in the CANSLIM.net Mid Day Breakouts Report and has been rallying ever since. In the September 19, 2005 edition of CANSLIM.net's After Market Report (read here) it was noted that, "After rallying over +200% in 2004 this issue spent the first half of 2005 building a new base and consolidating. After tracing out 6-month base this issue was ready to continue marching higher. On August 12th, 2005 it blasted above its pivot point we gave of $45.54 on massive volume trigger a technical buy signal. From that point it was not a straight up run, as the stock retraced like the majority of healthy breakouts, finding good support above the prior resistance levels and continuing to trade above its pivot point.
Charts courtesy www.stockcharts.com

C A N S L I M | StockTalk | News | Chart | SEC | Zacks Reports